Nikkei, Xiaomi, Healius & Hitachi lead the Weekly Top Gainers/Losers

By IFCMarkets

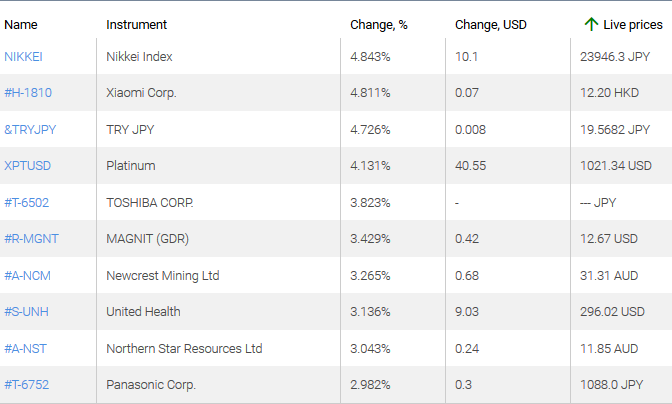
Top Gainers – The World Market

1. Nikkei Stock Average – a Japanese stock index.

2. Xiaomi Corporation – a Chinese manufacturer of electronics and mobile devices.

market sentiment ratio long short positions

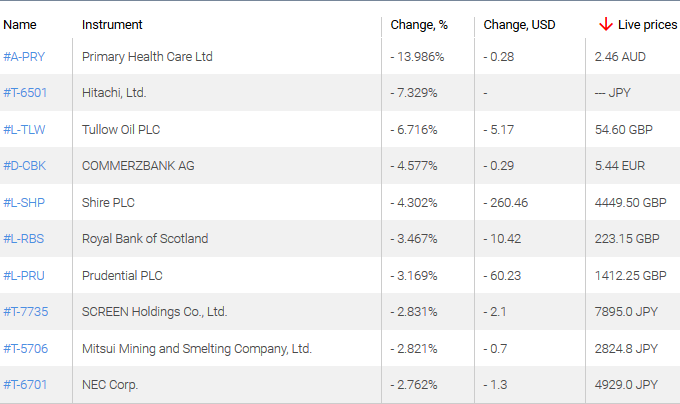
 Top Losers – The World Market

1. Healius Ltd – an Australian healthcare company(formerly Primary Health Care Ltd).

2. Hitachi Ltd – a Japanese manufacturer of electronics.

market sentiment ratio long short positions

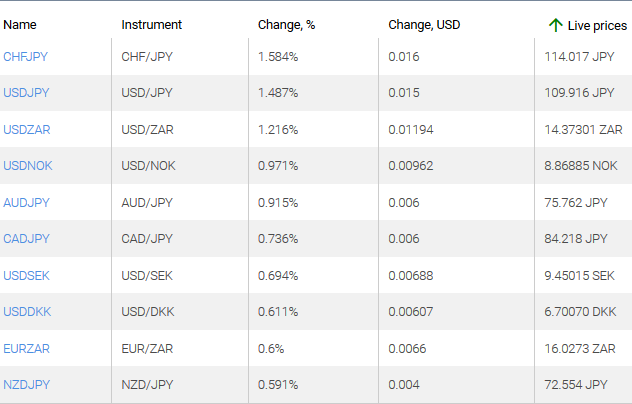
 Top Gainers – Foreign Exchange Market (Forex)

1. CHFJPY, USDJPY – an increase in these charts means the weakening of the Japanese yen against the Swiss franc and the US dollar.

2. USDZAR, USDNOK – an increase in these charts means the strengthening of the US dollar against the South African rand and the Norwegian krone.

market sentiment ratio long short positions

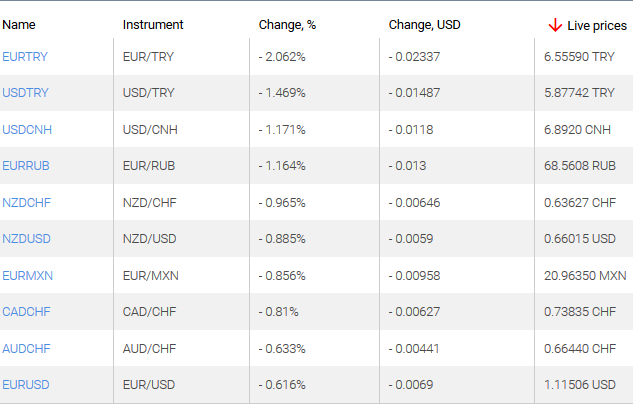
 Top Losers – Foreign Exchange Market (Forex)

1. EURTRY, USDTRY – a decrease in these charts indicates the strengthening of the Turkish lira against the euro and the US dollar.

2. USDCNH, EURRUB – a decrease in these charts indicates the weakening of the US dollar against the Chinese yuan and the euro against the Russian ruble.

market sentiment ratio long short positions

Market Analysis provided by IFCMarkets

Note:
This overview has an informative and tutorial character and is published for free. All the data, included in the overview, are received from public sources, recognized as more or less reliable. Moreover, there is no guarantee that the indicated information is full and precise. Overviews are not updated. The whole information in each overview, including opinion, indicators, charts and anything else, is provided only for familiarization purposes and is not financial advice or а recommendation. The whole text and its any part, as well as the charts cannot be considered as an offer to make a deal with any asset. IFC Markets and its employees under any circumstances are not liable for any action taken by someone else during or after reading the overview.

BRENT Analysis: Expectations of global oversupply bearish for BRENT

By IFCMarkets

Expectations of global oversupply bearish for BRENT

On the 4-hour timeframe the BRENT: H4 has fallen below the 200-period moving average MA(200) which is rising.

We believe the bearish momentum will resume after the price breaches below the lower boundary of Donchian channel at 63.12. A level below this can be used as an entry point for placing a pending order to sell. The stop loss can be placed above last fractal high at 64.16. After placing the order, the stop loss is to be moved every day to the next fractal high, following Parabolic signals. Thus, we are changing the expected profit/loss ratio to the breakeven point. If the price meets the stop loss level (64.16) without reaching the order ( 63.12), we recommend cancelling the order: the market has undergone internal changes which were not taken into account.

Market Analysis provided by IFCMarkets

USD Sinks On Data Weakness

By Orbex

USD Selling Off On Data Dump

The US dollar has been a little lower over the European morning on Thursday. Following some weakness in the monthly CPI reading earlier in the week, yesterday, PPI was also lower than expected last month.

After the NFP miss last week, this latest round of data weakness has seen the dollar index pulling back further from recent highs, trading 96.91 last.

Euro Rallying

EURUSD has rallied from the European open today, boosted by weakness in USD which has seen the pair trading back up to 1.1156 last, just ahead of the 1.1166 resistance level. Today, traders will get the December ECB minutes.

The market will be paying close attention to the discussions around any further easing, with regard to how much support and division there is within the ECB camp.

GBP Higher Despite Data Weakness

GBPUSD has been a little firmer today also, taking advantage of the weakness in USD. Yesterday, December CPI came in lower than expected at 1.3% YoY vs 1.5%.

On the back of a weak December GDP reading, further weight has been given to Carney’s recent warning that the BOE might be forced to cut rates to help buffer the economy despite a Brexit deal having been reached. GBPUSD trades 1.3059 last.

SPX500 Hits New Highs

Risk assets have been higher today, boosted by the official signing of the phase-one trade deal between the US and China last night. The deal, which has been in the works since October last year, is the first step towards dismantling the trade restrictions which have been in place for two years now.

SPX500 trades 3303.63 last, having broken out to new, record highs overnight.

JPY Down, Gold Up

Safe havens have had a mixed morning so far. JPY has been lower, in light of the rally in equities. Meanwhile, gold has been higher given the weakness in USD. XAUUSD trades 1555.18 last, having rallied off the January lows. USDJPY trades 109.97, making its way back up to recent highs.

Crude Fall Ceases (For Now)

Oil prices have been flat so far today. The bullish update from the EIA yesterday reported a 2.5 million barrel drawdown in US crude stores. This has stemmed the declines in oil for now.

Crude trades 58.23 last. Crude has been under heavy selling pressure recently following the passing of risks around potential US/Iran conflict.

Loonie Lower

USDCAD has been a little weaker today given the selling in USD and the pause in crude downside. USDCAD has now fallen back below the 1.3037 level following the reversal from above the 1.3068 level earlier in the week

Aussie Trying To Climb

AUDUSD has been firmer today, benefiting from the weakness in USD. The signing of the US/China trade deal last night is a positive omen for the Aussie though, in light of the bushfires there, the market is now expecting the RBA to cut rates in February, which is keeping upside contained here. AUDUSD trades .6914 last, edging back towards .6929 resistance.

By Orbex

EIA Reports Unexpected Inventories Decrease

By Orbex

Crude Inventories Rise

The latest data from the Energy Information Administration showed an unexpected decrease in US crude stores. Over the week ending January 10th, US crude inventories were lower by 2.5 million barrels.

This inventory drawdown was in sharp contrast to the expected 500k barrel increase the market was looking for.

With this latest drawdown, US crude stores are now sitting at 428.5 million barrels, the five year average for this time of year.

Gasoline Inventories Climb

The data also showed that gasoline inventories were higher over the week.

Gasoline inventories rose by 6.7 million barrels, now sitting around 5% above the five year average for this time of year.

Distillate stockpiles, which include diesel and heating oil, were also seen higher by 8.2 million barrels. They are around 3% down on the five year average for this time of year.

Crude Imports Fall

Looking at the rest of the data, US crude imports were down by 179k barrels per day on the previous week, averaging 6.6 million barrels per day.

Over the last four weeks, crude oil imports have been down 13.1% on the same period last year, sitting also at 6.6 million barrels per day on average.

Fading US/Iran Tensions

Despite news of the drawdown in inventories, crude prices saw only limited buying. It seems for now, that crude prices are still weighed down in the wake of the reversal in tensions between the US and Iran.

Crude prices exploded higher on news of the Iranian retaliation against the US last week. However, following Trump’s restraint reaction to the event, the risk of a further escalation in hostilities has subsided.

US/China Trade Deal Impact

The US/China trade deal, signed this week in Washington, should offer some support to crude in the near term. This is especially true if the two countries can quickly make a start on the second round of negotiations.

However, given the risk that the next round of talks will take longer and possibly be more fractured than last year’s talks, it will take some visible positive momentum to drive crude prices higher in the short term.

Technical Perspective

The rally in crude has now reversed sharply and as price heads back down towards the triangle’s rising trend line, there is a risk that the break above the triangle top might prove to have been a flaws breakout, suggesting scope for a further move lower.

To the downside, the next key level is the 57 mark, with the rising trend line support coming in below. A break below there could open up the way for a run down to deeper support at the 51-level.

By Orbex

US & China Sign Phase One Deal

By Orbex

After nearly a year since President Trump started his trade war rhetoric against China, both parties have signed a deal.

The phase one of the trade deal is seen by many as a first step towards easing trade tensions between the two economic powerhouses of the world.

Equity markets charted into new highs intraday ahead of the signing of the deal.

Euro Rises on a Softer USD

The euro was recovering from the weakness earlier in the week. The gains came largely due to a weaker dollar.

Economic data from the eurozone saw the industrial production figures rising 0.2% on the month, falling below estimates. The common currency, however, brushed aside the data.

EURUSD to Move into a New Range

The currency pair is rebounding off the support area near the 1.1131 level. This is pushing the currency pair higher. However, the gains will be limited as the EURUSD will settle into the new range.

The resistance level at 1.1180 and the 1.1131 support will set the new corridor for the currency pair. A breakout from this level is needed to further confirm the direction.

UK Inflation Weaker than Forecasts

Consumer prices in the United Kingdom were tame in December. On a year over year basis, headline CPI rose just 1.3%. This was below the estimates of a 1.5% increase and down from 1.5% in November.

The pound sterling was, however, unmoved by the report.

GBPUSD Consolidating Near the Bottom

Cable is gradually rising off the lows near 1.2960. Price action is forming a higher low currently. This will potentially indicate a move to the upside as the bullish divergence is forming.

The upside target remains at the 1.3100 region, with the possibility to breakout slightly higher. However, given the fact that the lower support at 1.2960 is not tested, we could see a move lower.

Gold Prices Turn Weaker on Rising Risk Appetite

The precious metal is trading weaker on the day as the risk appetite remains in favor. Investors are bullish on the US and China trade deal. The fourth-quarter earnings report kicked off with the financial companies reporting, adding to the risk appetite.

XAUUSD Could Decline Lower in the Near Term

The precious metal is forming a hidden bearish divergence. The Stochastics indicate a higher high against a lower high in price. This supports the downside test toward the 1534 region. A breakdown below this level will indicate further declines to the 1514 support area next.

By Orbex

US Retail Sales To Recover

By Orbex

Retail sales figures for the United States, covering the month of December will be coming up today.

The data released by the Commerce Department will show how much Americans spent at retail stores over the holiday month.

In November, retail sales were weaker than forecasts, surprising to the downside. The declines came amid a pullback in discretionary spending. On a monthly basis, retail sales rose just 0.2% on the month compared to a 0.5% forecast. For December, expectations are once again to the upside.

Economists forecast that core retail sales will rise 0.5% on the month, while headline retail sales will rise 0.3% for the period.

US Retail Sales, November 2019

However, it will be interesting to watch for any revisions to November’s data. In October, retail sales were revised higher to show a 0.4% increase rather than the 0.3% increase which was initially reported.

If the retail sales data comes on top of the expectations, it will be most likely due to an increase in core sales that excludes automobiles and gasoline performing better than estimates.

While the retail sales figures will not give a direct assessment of the pace of growth in the US economy, it will at the very least point to the overall sentiment among consumers. This is because growth in the United States is driven largely by consumer demand.

So far, Fed officials remain hopeful that this demand will continue to drive growth in the US over the coming quarters. The US economy is on a weaker trend, falling from a 3% average growth rate to just close to 2%.

Thus, investors will be keen to see the data on consumer spending during the month.

Weaker Auto Sales & Wages Could Point to Slower Increase

Automobile sales are one of the important components that play a big role in the retail sales report. In December, data indicates that auto sales fell to 16.7 million units compared to 17.1 million units in November.

This translates to a 2.3% decline on a month over month basis in automobile sales. But offsetting this will be the gasoline prices. Although gasoline prices have increased, it still remains stable in the longer-term horizon.

The weaker pace of wage growth is also another factor to consider.

According to the recent payrolls report for December, wage growth rose just 2.9% on the year ending December 2019. This was a pullback from the time when wages rose above the 3% threshold.

Thus, the lower earnings could see consumers cutting back on spending.

In terms of consumer optimism, we can see that according to various surveys, optimism among consumers remains high. Although the conference board’s consumer confidence index was weaker on a month to month basis, it is still at historically high levels.

Combining the above with the fact that spending usually increases during December, we could see a broad match on the expectations. But the drag from lower auto sales will be clearly felt.

Thus, there is scope for core retail sales, which exclude gasoline and automobile sales, to outperform the headline retail sales expectations.

Following today’s report, investors will further be able to assess the impact it will have on the fourth-quarter GDP. Thus, the market reaction could be a bit more than anticipated.

At the time of writing, the average expectations are about a 2.1% growth rate for the fourth quarter of the year. But this will certainly change depending on the actual figures from retail sales.

By Orbex

Ichimoku Cloud Analysis 16.01.2020 (AUDUSD, NZDUSD, USDCAD)

Article By RoboForex.com

AUDUSD, “Australian Dollar vs US Dollar”

AUDUSD is trading at 0.6904; the instrument is moving inside Ichimoku Cloud, thus indicating a sideways tendency. The markets could indicate that the price may continue the correction, test the cloud’s upside border at 0.6915, and then resume moving downwards to reach 0.6790. Another signal to confirm further descending movement is the price’s rebounding from the resistance level. However, the scenario that implies further decline may be canceled if the price breaks the cloud’s upside border and fixes above 0.6955. In this case, the pair may continue growing towards 0.7035. After breaking the rising channel’s downside border and fixing below 0.6855, the price may resume moving downwards.

AUDUSD
Risk Warning: the result of previous trading operations do not guarantee the same results in the future

NZDUSD, “New Zealand Dollar vs US Dollar”

NZDUSD is trading at 0.6629; the instrument is moving below Ichimoku Cloud, thus indicating a descending tendency. The markets could indicate that the price may test the cloud’s downside border at 0.6635 and then resume moving downwards to reach 0.6515. Another signal to confirm further descending movement is the price’s rebounding from the descending channel’s upside border. However, the scenario that implies further decline may be canceled if the price breaks the cloud’s upside border and fixes above 0.6695. In this case, the pair may continue growing towards 0.6775.

NZDUSD
Risk Warning: the result of previous trading operations do not guarantee the same results in the future

USDCAD, “US Dollar vs Canadian Dollar”

USDCAD is trading at 1.3046; the instrument is moving above Ichimoku Cloud, thus indicating an ascending tendency. The markets could indicate that the price may test the cloud’s upside border at 1.3030 and then resume moving upwards to reach 1.3175. Another signal to confirm further ascending movement is the price’s rebounding from the support level. However, the scenario that implies further growth may be canceled if the price breaks the cloud’s downside border and fixes below 1.2995. In this case, the pair may continue falling towards 1.2905. After breaking Triangle’s upside border and fixing above 1.3090, the price may continue moving upwards.

USDCAD

Article By RoboForex.com

Attention!
Forecasts presented in this section only reflect the author’s private opinion and should not be considered as guidance for trading. RoboForex LP bears no responsibility for trading results based on trading recommendations described in these analytical reviews.

Japanese Candlesticks Analysis 16.01.2020 (GOLD, NZDUSD)

Article By RoboForex.com

XAUUSD, “Gold vs US Dollar”

As we can see in the H4 chart, the correction within the ascending tendency continues. By now, XAUUSD has completed several Doji patterns. At the moment, the pair is reversing and may later reach 1525.00. After that, the price may continue growing towards 1600.00. However, one shouldn’t ignore another scenario, according to which the instrument may continue the ascending tendency towards 1525.00 without any corrections.

GOLD
Risk Warning: the result of previous trading operations do not guarantee the same results in the future

NZDUSD, “New Zealand vs. US Dollar”

As we can see in the H4 chart, the descending tendency continues. After forming Harami pattern near the resistance level, NZDUSD is reversing. The closest downside target may be at 0.6577. At the same time, one shouldn’t exclude an opposite scenario, according to which the instrument may grow to return to 0.6670.

NZDUSD

Article By RoboForex.com

Attention!
Forecasts presented in this section only reflect the author’s private opinion and should not be considered as guidance for trading. RoboForex LP bears no responsibility for trading results based on trading recommendations described in these analytical reviews.

The Analytical Overview of the Main Currency Pairs on 2020.01.16

by JustForex

The EUR/USD currency pair

Technical indicators of the currency pair:
  • Prev Open: 1.11282
  • Open: 1.11496
  • % chg. over the last day: +0.22
  • Day’s range: 1.11446 – 1.11581
  • 52 wk range: 1.0879 – 1.1572

The EUR/USD currency pair continues to recover. The trading tool has updated local highs. At the moment, EUR/USD quotes are consolidating in the range of 1.11450-1.11650. In December, the US producer price index was 0.1%, which is below market expectations at 0.2%. Washington and Beijing signed the first phase of the trade agreement. The parties began preparations for the second phase of the transaction. We do not exclude further growth of EUR/USD quotes. Today, participants in financial markets will evaluate a number of important economic releases. Open positions from key levels.

The Economic News Feed for 16.01.2020 is calm.

  • – Publication of the minutes of the ECB meeting on monetary policy – 14:30 (GMT+2:00);
  • – Report on the US retail sales – 15:30 (GMT+2:00);
  • – Philadelphia Federal Reserve Employment Index – 15:30 (GMT+2:00).
EUR/USD

The price has fixed above 50 MA and 100 MA, which signal the strength of buyers.

The MACD histogram is in the positive zone, but below the signal line, which gives a weak signal to buy EUR/USD.

The Stochastic Oscillator is in the neutral zone, the %K line is above the %D line, which indicates a bullish sentiment.

Trading recommendations
  • Support levels: 1.11450, 1.11200, 1.10900
  • Resistance levels: 1.11650, 1.12000

If the price consolidates above 1.11650, expect further growth toward 1.12000.

An alternative could be a decrease in the EUR/USD currency pair to 1.11200-1.11000.

The GBP/USD currency pair

Technical indicators of the currency pair:
  • Prev Open: 1.29872
  • Open: 1.30373
  • % chg. over the last day: +0.17
  • Day’s range: 1.30369 – 1.30566
  • 52 wk range: 1.1959 – 1.3516

GBP/USD quotes moved to growth. Sterling updated local highs. The trading tool found resistance at 1.30550. 1.30000 is a key support. The GBP/USD currency pair has the potential for further correction. Investors expect up-to-date information on Brexit. Today, the focus is on economic reports from the United States. Positions should be opened from key levels.

The Economic News Feed for 16.01.2020 is calm.

GBP/USD

The price has fixed above 100 MA, which signals the strength of buyers.

The MACD histogram is in the positive zone, indicating a bullish sentiment.

The Stochastic Oscillator is in the neutral zone, the %K line has crossed the %D line. There are no signals at the moment.

Trading recommendations
  • Support levels: 1.30000, 1.29600, 1.29200
  • Resistance levels: 1.30550, 1.31000, 1.31400

If the price consolidates above 1.30550, expect further growth toward 1.30900-1.31200.

Alternatively, the quotes could descend toward 1.29700-1.29500.

The USD/CAD currency pair

Technical indicators of the currency pair:
  • Prev Open: 1.30602
  • Open: 1.30424
  • % chg. over the last day: -0.17
  • Day’s range: 1.30350 – 1.30483
  • 52 wk range: 1.2949 – 1.3566

The USD/CAD currency pair continues to trade in a protracted flat. There is no defined trend. At the moment, USD/CAD is testing the support level of 1.30350. Mark 1.30550 is the nearest resistance. A trading instrument has a downside potential. Today we recommend paying attention to statistics on the US economy, as well as the dynamics of prices for oil. Open positions be opened from key levels.

The Economic News Feed for 16.01.2020 is calm.

USD/CAD

Indicators do not give accurate signals: 50 MA crossed 100 MA.

The MACD histogram is in the negative zone but above the signal line, which gives a weak signal to sell USD/CAD.

The Stochastic Oscillator has started to leave the overbought zone, the %K line is below the %D line, which indicates a bearish sentiment.

Trading recommendations
  • Support levels: 1.30350, 1.30200, 1.30000
  • Resistance levels: 1.30550, 1.30750, 1.31000

If the price consolidates below 1.30350, expect the quotes to drop toward 1.30000-1.29800.

Alternatively, the quotes could grow toward 1.30750-1.31000.

The USD/JPY currency pair

Technical indicators of the currency pair:
  • Prev Open: 109.981
  • Open: 109.899
  • % chg. over the last day: -0.09
  • Day’s range: 109.855 – 109.990
  • 52 wk range: 104.45 – 113.53

The USD/JPY currency pair stabilized after a protracted rally. The trading instrument is currently consolidating. Unidirectional trends are not observed. Participants in financial markets expect additional drivers. The key range is 109.700-110.200. In the near future, technical correction is not ruled out. Today we recommend paying attention to the news background on the US economy. Positions must be opened from key levels.

The Economic News Feed for 16.01.2020 is calm.

USD/JPY

Indicators do not give accurate signals: the price crossed 50 MA and 100 MA.

The MACD histogram is near the 0 mark.

The Stochastic Oscillator is in the neutral zone, the %K line is above the %D line, which indicates bullish sentiment.

Trading recommendations
  • Support levels: 109.700, 109.350, 109.000
  • Resistance levels: 110.200, 110.500

If the price consolidates above 110.200, expect further growth toward 110.500-110.700.

Alternatively, the quotes could correct toward 109.400-109.200.

by JustForex

The Dollar Index Is Consolidating. Investors Assess US-China Trade Deal

by JustForex

During yesterday’s trading session, the US dollar fell slightly against a basket of major currencies. The dollar index (#DX) closed yesterday in the red zone (-0.14%). The day before China and the US signed the phase-one trade deal in the White House, taking a step towards resolving the trade dispute. US Vice President Mike Pence said the second phase of negotiations has already begun, and the parties are working to resolve the differences. As part of the first phase, Washington reduced duties on Chinese goods $120 billion worth, from 15% to 7.5%. Beijing, in turn, agreed to increase purchases of US manufactured goods, agriculture, energy and services by $200 billion over the next two years.

Yesterday, the US House of Representatives delegation referred charges against President Donald Trump to the Senate. It will be the third impeachment process in US history. The trial should begin next week.

The “black gold” prices are rising. Currently, futures for the WTI crude oil are testing the $58.10 mark per barrel. At 17:30 (GMT+2:00), US crude oil inventories will be published.

Market Indicators

Yesterday, there was a variety of trends in the US stock market: #SPY (-0.15%), #DIA (+0.07%), #QQQ (-0.39%).

The 10-year US government bonds yield has declined. At the moment, the indicator is at the level of 1.79-1.80%.

The Economic News Feed for 16.01.2020:
  • – ECB monetary policy meeting account at 14:30 (GMT+2:00);
  • – Philadelphia Fed manufacturing index at 15:30 (GMT+2:00);
  • – Report on retail sales in the US at 15:30 (GMT+2:00).

by JustForex