The two developments that already took place this year are addressed in an H.C. Wainwright & Co. report.
In a Jan. 16 research note, H.C. Wainwright & Co. analyst Joseph Pantginis reported that Ligand Pharmaceuticals Inc. (LGND:NASDAQ) kicked off the year with news of entering into a global licensing agreement with Pandion Therapeutics pertaining to Ligand’s OmniAb antibody discovery platform. The “agreement might accelerate drug discovery at Pandion and generate additional revenue streams to Ligand in the future,” Pantginis added.
The agreement allows Pandion to deploy the platform, which encompasses OmniRat, OmniFlic, OmniMouse, OmniChicken and OmniClic, to develop new therapeutics. In exchange, Ligand might receive an upfront access fee, development and regulatory milestone payments and potential royalties on product sales.
Now, Ligand’s OmniAb is licensed is to more than 40 corporate partners and “should progressively gain attention with growing news flow and developments,” commented Pantginis.
In other news, Pantginis relayed that Ligand’s partner Verona reported positive data from its Phase 2b dose-ranging study (0.375, 0.75, 1.5 and 3 milligrams), evaluating nebulized ensifentrine in patients with moderate to severe chronic obstructive pulmonary disease. In this 416-patient study, all primary endpoints were met at all doses. Secondary endpoints also were recorded. The therapeutic was well tolerated with adverse effects being on par with those experienced with the placebo.
Verona has a post phase 2 meeting with the FDA scheduled for Q2/20 to discuss how to move forward. “The idea is to progress the program into Phase 3 trials, which could commence in Q3/20,” noted the analyst.
Finally, Pantginis highlighted that whereas Ligand continues to deliver on its business model, it remains undervalued. The company continues to develop future revenue streams and shareholder value through its shots-on-goal business strategy. “Ligands assets, both in-house and from partners, are positively advancing towards the clinic and may reach a certain investment verdict promptly.”
H.C. Wainwright & Co. has a Buy rating and a $214 per share target price on Ligand, whose stock is currently trading at around $89.76 per share.
Disclosure: 1) Doresa Banning compiled this article for Streetwise Reports LLC and provides services to Streetwise Reports as an independent contractor. She or members of her household own securities of the following companies mentioned in the article: None. She or members of her household are paid by the following companies mentioned in this article: None. 2) The following companies mentioned in this article are billboard sponsors of Streetwise Reports: None. Click here for important disclosures about sponsor fees. 3) Comments and opinions expressed are those of the specific experts and not of Streetwise Reports or its officers. The information provided above is for informational purposes only and is not a recommendation to buy or sell any security. 4) The article does not constitute investment advice. Each reader is encouraged to consult with his or her individual financial professional and any action a reader takes as a result of information presented here is his or her own responsibility. By opening this page, each reader accepts and agrees to Streetwise Reports’ terms of use and full legal disclaimer. This article is not a solicitation for investment. Streetwise Reports does not render general or specific investment advice and the information on Streetwise Reports should not be considered a recommendation to buy or sell any security. Streetwise Reports does not endorse or recommend the business, products, services or securities of any company mentioned on Streetwise Reports. 5) From time to time, Streetwise Reports LLC and its directors, officers, employees or members of their families, as well as persons interviewed for articles and interviews on the site, may have a long or short position in securities mentioned. Directors, officers, employees or members of their immediate families are prohibited from making purchases and/or sales of those securities in the open market or otherwise from the time of the interview or the decision to write an article until three business days after the publication of the interview or article. The foregoing prohibition does not apply to articles that in substance only restate previously published company releases.
Disclosures from H. C. Wainwright, Ligand Pharmaceuticals Inc., Company Update, January 16, 2020
Investment Banking Services include, but are not limited to, acting as a manager/co-manager in the underwriting or placement of securities, acting as financial advisor, and/or providing corporate finance or capital markets-related services to a company or one of its affiliates or subsidiaries within the past 12 months.
I, Joseph Pantginis, Ph.D., certify that 1) all of the views expressed in this report accurately reflect my personal views about any and all subject securities or issuers discussed; and 2) no part of my compensation was, is, or will be directly or indirectly related to the specific recommendation or views expressed in this research report; and 3) neither myself nor any members of my household is an officer, director or advisory board member of these companies.
None of the research analysts or the research analyst’s household has a financial interest in the securities of Ligand Pharmaceuticals, Inc. (including, without limitation, any option, right, warrant, future, long or short position).
As of December 31, 2019 neither the Firm nor its affiliates beneficially own 1% or more of any class of common equity securities of Ligand Pharmaceuticals, Inc.
Neither the research analyst nor the Firm has any material conflict of interest in of which the research analyst knows or has reason to know at the time of publication of this research report.
The research analyst principally responsible for preparation of the report does not receive compensation that is based upon any specific investment banking services or transaction but is compensated based on factors including total revenue and profitability of the Firm, a substantial portion of which is derived from investment banking services.
The Firm or its affiliates did not receive compensation from Ligand Pharmaceuticals, Inc. for investment banking services within twelve months before, but will seek compensation from the companies mentioned in this report for investment banking services within three months following publication of the research report.
The Firm does not make a market in Ligand Pharmaceuticals, Inc. as of the date of this research report.
H.C. Wainwright & Co., LLC and its affiliates, officers, directors, and employees, excluding its analysts, will from time to time have long or short positions in, act as principal in, and buy or sell, the securities or derivatives (including options and warrants) thereof of covered companies referred to in this research report.
Precious metals ended 2019 on a high note and started off 2020 with a bang. Will this continue? Our cover story reveals what we expect.
Your free Money Metals Insider newsletter also gives you a heads up about the new American Eagle coin designs, updates you on the state of sound money across America, answers your questions, and more.
Also, a quick reminder, not only does Money Metals offer super competitive pricing when you want to BUY, but we are also – without a doubt – the #1 place in the country to SELL, STORE, or even GIVE YOU A CASH LOAN AGAINST your precious metals.
Here are the highlights from your free Money Metals Insider newsletter:
It’s the Final Year of Silver and Gold Eagles As We Know Them
So download the PDF of this fantastic free newsletter right now – and pass it around to your friends! It’s another free benefit for those who have signed up for the Money Metals email list.
The Money Metals News Service provides market news and crisp commentary for investors following the precious metals markets.
Given current market conditions, the location and potential of its flagship project, and the strength of its management team, Ron Struthers of Struthers’ Resource Stock Report believes this firm represents a solid investment.
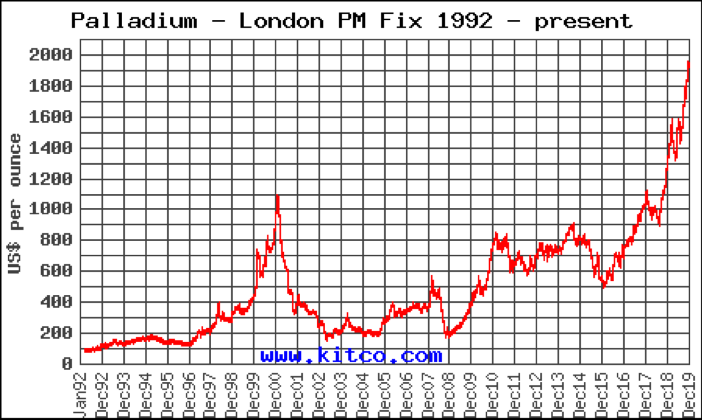
I have been looking for a very good junior palladium stock, and I believe this is the best one out there for potential enormous gains. But before I get to that, it is important to have a look at the palladium market, because this bull market is much different than the last one.
The one from 1997 to 2000 was about three years’ long, and then palladium dropped, giving up most of the gains in less than a year. There was a nice bump up from the 2008 crisis and then the price traded sideways for several years. The price bottomed at the end of 2015 with the severe bear market in precious metals.
Since then the price has been going steadily higher, with a major break out in 2016. This bull market is not going to end anytime soon for the reasons I will show you in the next couple pages.
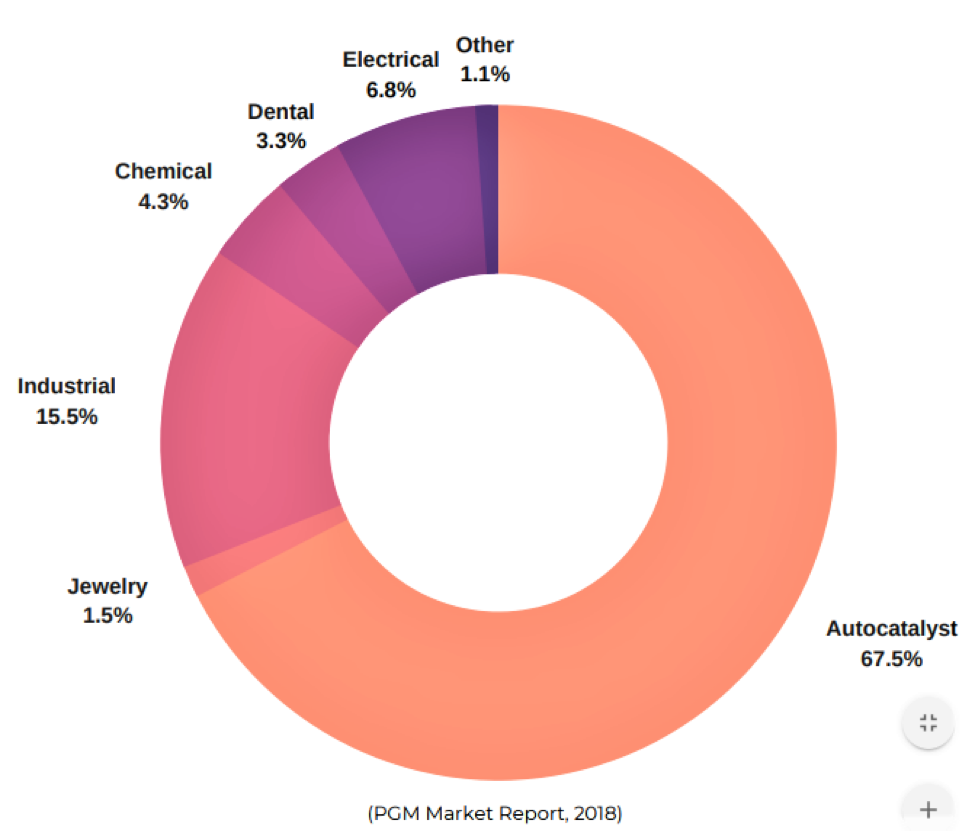
Palladium is mostly used in the auto industry for pollution control with catalytic converters. Electric vehicles will be a long time coming to replace any significant amount of gasoline/diesel-driven vehicles. Meanwhile, pollution standards are being tightened that will keep demand high. China has been gobbling up palladium since their China 5 pollution standards took effect in 2013. China 6 will now be coming into effect, which will increase loads per vehicle of palladium. Many analysts have been commenting that China has been secretly stockpiling the metal and is driving prices.
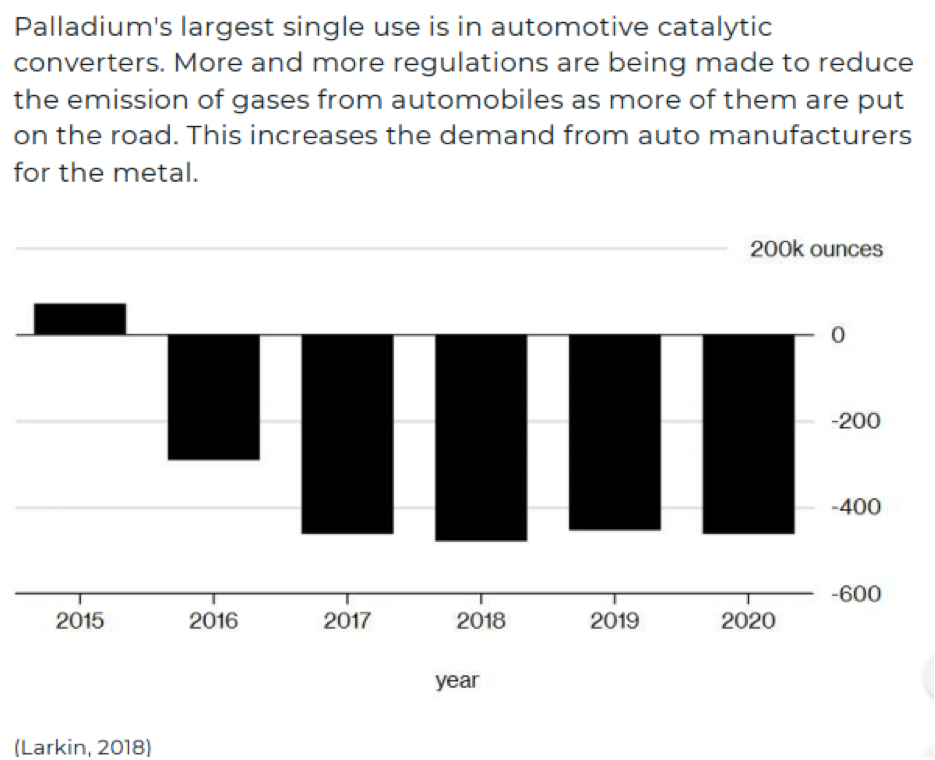
There is no doubt the demand will remain strong, but the real story is on the supply side and I have more detail.
This next graphic illustrates the supply deficit since 2016.
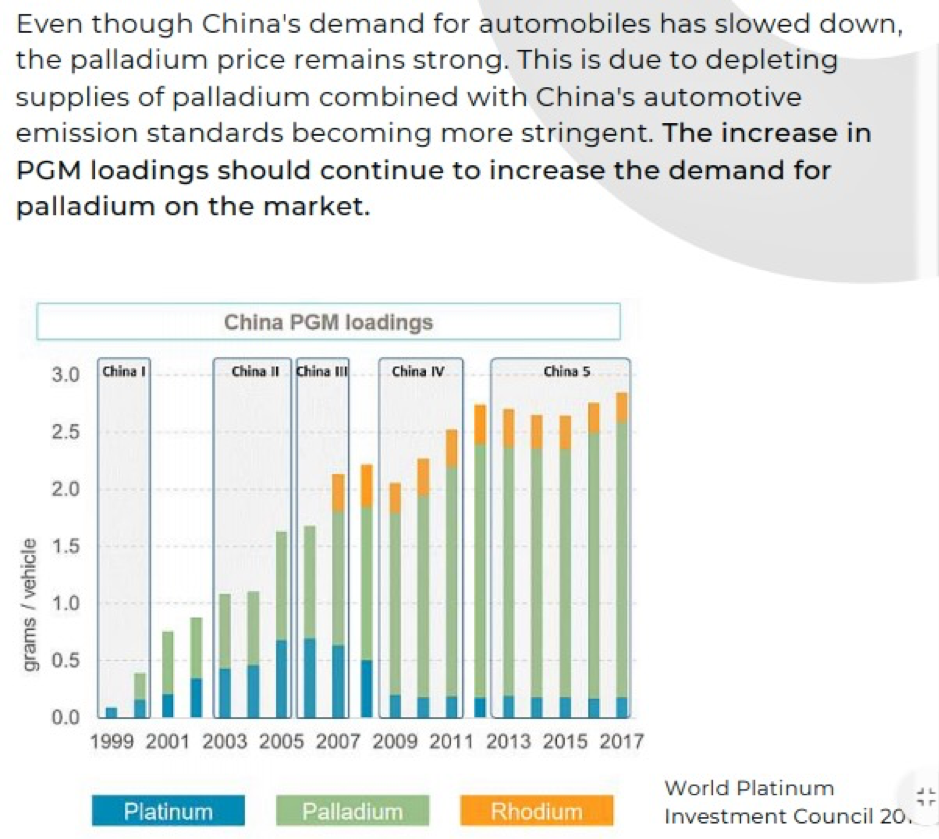
It is obvious to see the increase demand from China as pollution regulations are tightened. They are now moving to China 6.
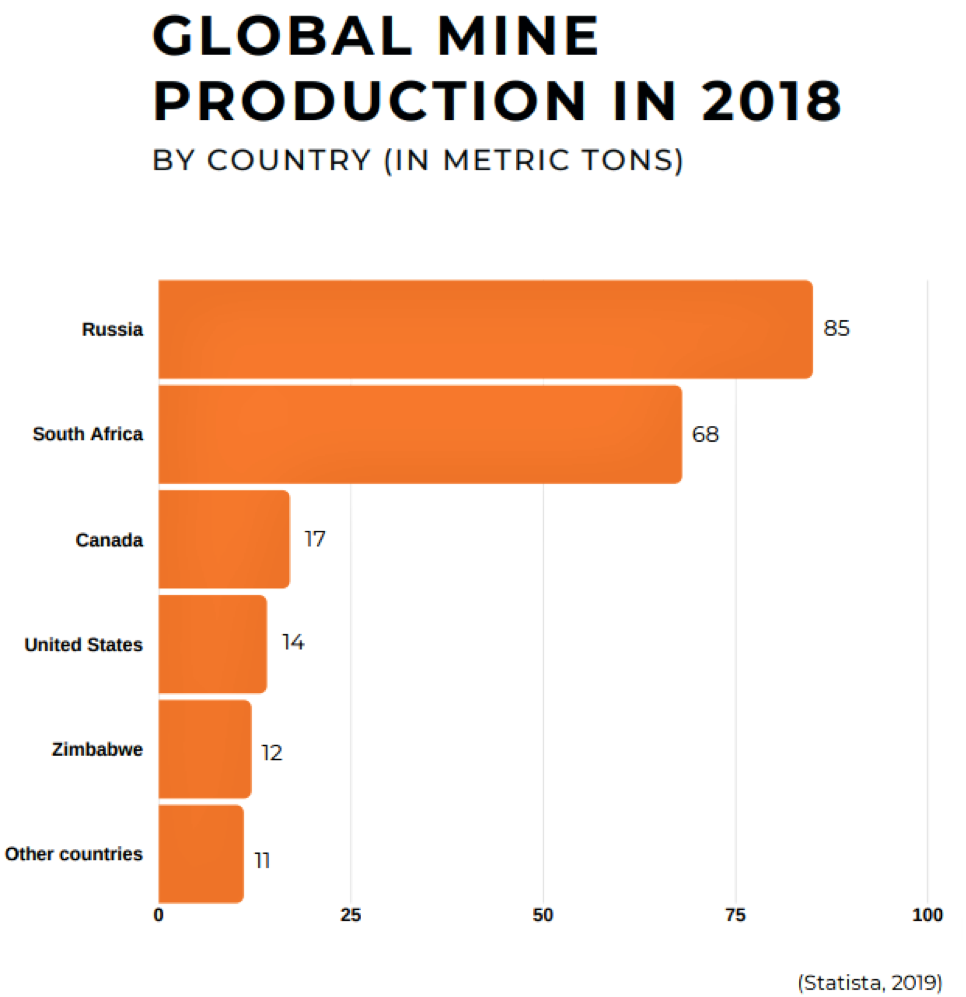
This next graphic of global mine production is very important because palladium supply is in very unstable regions.
The Russia supply from Norilsk Nickel has always been quite stable and is of no concern, but as investors we cannot really participate there. South Africa is the other big producer and that country is becoming very unstable. More worrisome is that is where all the future reserves are.
The world’s largest platinum group metals (PGM) reserves are in South Africa, precisely in the Bushveld Complex (in the central-northern part of the country), which alone accounts for about 50% of the world’s palladium resources. But overall South Africa has reserves of 63 million kilograms, which represent over 91% of the worldwide availability.
South African (SA) mines have always been plagued with labor issues, strikes and high costs. To make matters worse the country is now facing an energy crisis, with rolling blackouts shutting down mines. The country will probably become much more unstable, with unemployment hitting 10-year highs. Half the youth are unemployed, and the company that provides 95% of the electricity (when it can) is reporting record financial losses. This is a country teetering on the brink of chaos, which will likely be very disruptive to PGM mine supply.
With all the issues in SA, Sibanye Gold Ltd. (SBGL:NYSE) began diversifying out of the country and acquired the Stillwater PGM mine in the U.S. That used to be my favorite stock to play palladium bull markets. However, they jumped right back into the fray, acquiring Lonmin in late 2019, a struggling SA PGM producer. They promptly cut 5,000 jobs at the mine and it now appears Sibanye is moving more into PGMs from gold. The stock has done well with the rising palladium price, but at these stock prices and a move back to SA, it has become too risky.
Canada is the third largest producing country, so is an obvious place to look. A lot of the palladium production comes from major miners in the Sudbury nickel/copper complex as a byproduct. Obviously this is a good area to look, and there was an excellent investor proxy play there for investors called North American Palladium, which was operating the Lac des Iles palladium mine. Unfortunately for us investors, it was bought out last year by SA producer Implats.
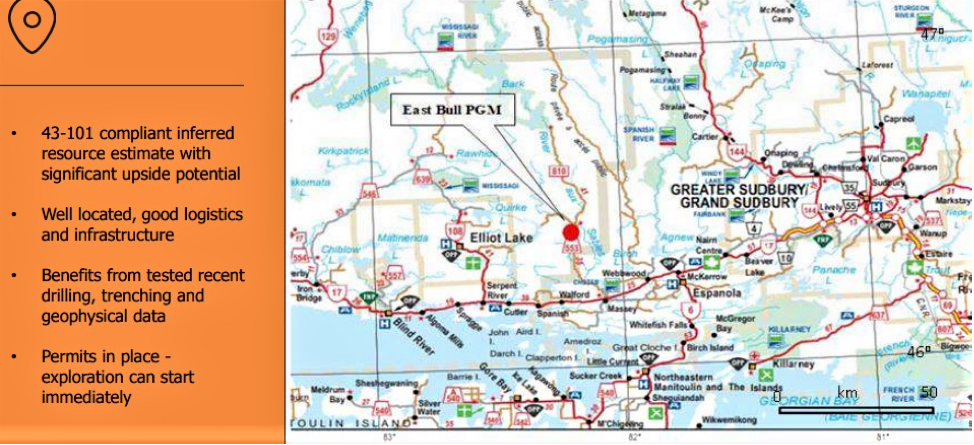
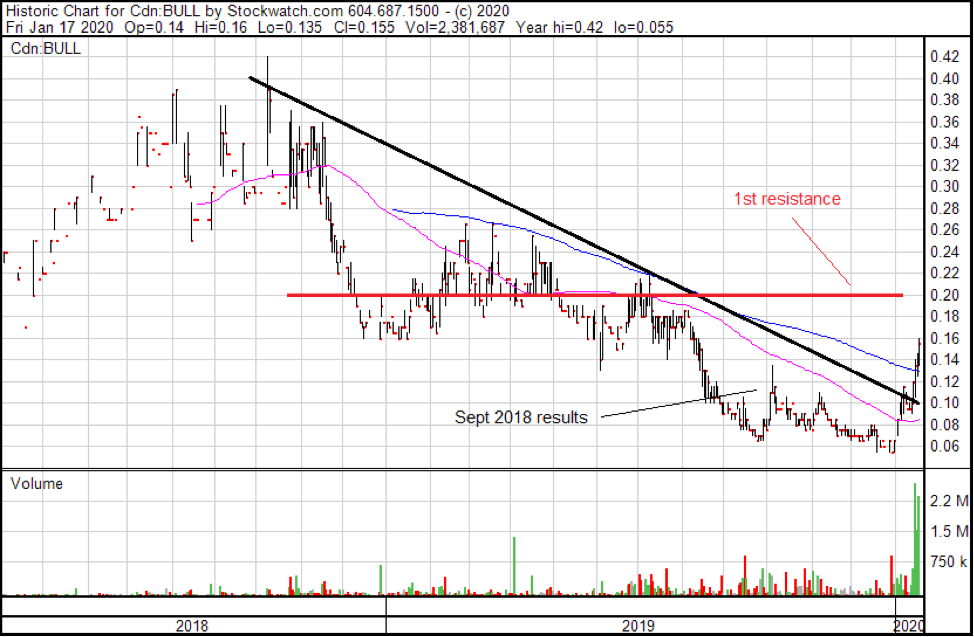
The area had a number of discoveries back in the last bull market, around the year 2000, and I visited a number of those projects back then. I believe the best one is a junior company that just changed its name to Canadian Palladium Resources Inc. (BULL:CSE; DCNNF:OTCQB) (from 21C Metals), and they acquired the East Bull project last year.
East Bull was drilled by Freewest Resources Canada Inc. (FWR:TSX.V) and Mustang Minerals (now Grid Metals Corp. (GRDM: TSX.V) back in the 2000 era and now has a NI43-101-compliant, 523,000-ounce palladium resource. A private company, Pavey Ark Minerals, had the property, and in 2017 they twinned old drill holes and completed the work to bring the project to 43-101 standards. Canadian Palladium acquired a 100% option on the project last February. What makes it very appealing now is that the stock got whacked down in price in the poor junior market of late 2019.
Canadian Palladium Recent Price: $0.14 52-week trading range: $0.06 to $0.265 Shares outstanding: 64.5 million approx. All warrants and options are at $0.30 cents and higher
Mr. Tisdale has a keen eye for finding projects that can quickly be advanced further to make them prime acquisition targets. Canadian Palladium only has a market value now of less than $10 million, and I have no doubt that Mr. Tisdale is going to do it again, and advance East Bull and sell it for hundreds of millions.
Highlights:
Company run by Wayne Tisdale
Low market valuationCA$18 per ounce
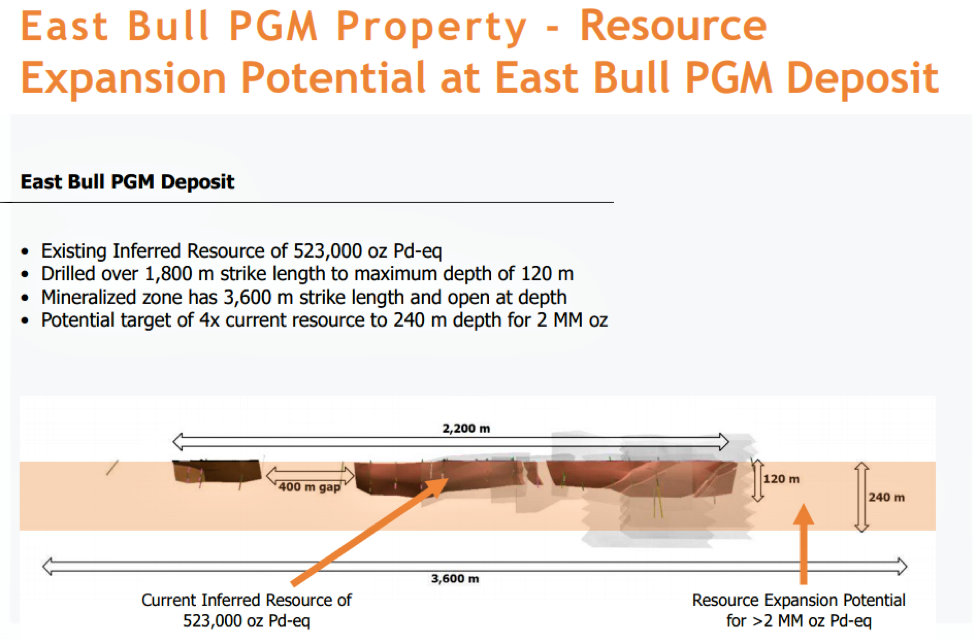
East Bull with NI43-101-compliant, 523,000-ounce palladium resource
East Bull can easily be expanded to depth and along strike
Widely spaced drilling only needs infill drilling to upgrade resource
Over 2 million ounce potential
Close to Sudbury complex where ore can be processed
Management Highlights (from the company website)
Wayne Tisdale, CEO, has 40 years of experience in investing, financing and consulting to private and public companies in the areas of mining, oil and gas, and agriculture. He runs his own merchant bank and sits on the board of a number of private and public companies. Over his career, Mr. Tisdale has raised over $2 billion of both equity and debt financing, and has been instrumental in founding several highly successful companies, including Rainy River Resources (purchased by Newgold) and Ryland Oil Corp. (purchased by Crescent Point). Most recently, Mr. Tisdale was integral to the successful sale of US Cobalt to First Cobalt Corp., creating a post-transaction cobalt company valued at almost $400 million.
Michelle Gahagan, chair and director, has been a director of Canadian Palladium since January, 2011. Ms. Gahagan is currently a director of Moovly Media Inc, (MVY:TSX.V) and Versus Systems Inc. (VS:CSE). Prior to her involvement in merchant banking, Ms. Gahagan graduated from Queens University Law School and practiced corporate law for 20 years. Ms. Gahagan has extensive experience advising companies with respect to international tax-driven structures, mergers and acquisitions. Ms. Gahagan has successfully completed the Investment Management Certificate course offered by the Financial Conduct Authority (UK). Most recently, Ms. Gahagan was integral to the successful sale of US Cobalt to First Cobalt Corp.
Garry Clark, director, is a geologist (P Geo) with over 30 years of mineral exploration experience and has held various geological positions with a number of public mining companies. Mr. Clark has extensive experience in managing large-scale exploration and development programs internationally, including in Asia and North America, and has worked extensively in the Hemlo and Wawa districts. He is the executive director of the Ontario Prospectors Association (OPA) and currently serves on the Minister of Mines Mining Act Advisory Committee. Most recently, Mr. Clark was integral to the successful sale of US Cobalt to First Cobalt Corp.
Paul McGuigan, consultant, is a professional geoscientist with 42 years of international experience in economic geology and mineral exploration management, spanning grassroots exploration through to mine feasibility studies and mining operations. Early in his career, he was employed by IBM Canada Ltd., Geological Survey of Canada, Pechiney Ugine Kuhlmann, Imperial Oil, and Esso Minerals Canada. For the last thirty years, Mr. McGuigan has led several consulting and junior mining companies, operating in West Africa, the Middle East, the Southwest Pacific and all of North and South America. His geological expertise includes iron oxide-copper-gold (IOCG), volcanogenic massive sulphides, epithermal gold, porphyry Cu-Au, and residual & alluvial gold, platinum and diamond deposits.
ProjectsEast Bull
In the 19992000 period, Freewest drilled 27 holes for a total of 2,902 meters (2,902m) and carried out extensive surface trenching on present claim 4272475. Work by Mustang on the eastern part of the property (claim 1227910) included 11 drill holes for a total of 1,766m. The work by Freewest and Mustang forms the majority of the data for the current resource estimate. The company has copies of Freewest and Mustang logs, sample records and assay certificates for trenches and drill holes.
Additionally, Pavey Ark has reviewed and resampled drill core from the 27 BQ and NQ holes from the Freewest drilling program. Pavey Ark’s exploration results in 2017 included:
hole EB17-01 that intersected 12.0 m at 2.87 g/t PGM+Au, 0.23% Cu and 0.13% Ni, and
hole EB17-03 that intersected 7.0 m of 3.21 g/t PGM+Au, 0.16% Cu and 0.07% Ni.
(Note: Au = gold, Cu = copper, and Ni = nickel)
In 2019, BULL completed their initial exploration program at East Bull and reported results Sept. 17, 2019. The following is from the company press release:
“These are highlights from the first sampling program on the East Bull palladium project and field program on the Agnew Lake project: The East Bull property hosts an Inferred resource of 11.1 million tons at 1.46 grams per tonne palladium equivalent (Pd eq) for a total estimate of 523,000 ounces of Pd eq.
“The grab sampling and mapping of the East Bay palladium mineralization has allowed BULL to determine locations to channel sample. The sampling focused on selecting sample locations that were not previously documented. The sampling and mapping were successful in defining areas of the mineralization that when channel sampled will provide economic mineralized intercepts that will increase confidence of the mineral resource. The channel samples will also allow definition of areas of higher-grade palladium that could to direct BULL to potential starter pit locations. The channel sample is a continuous sample cut using a diamond bladed rock saw:
“Seventy-three grab samples were selected to help identify the palladium-bearing rock types of the mineralized trend. Grab samples are used to determine the presence mineralization and may not be indicative of the overall grade of the zone.
Sampling successfully defined locations for channel sampling and the higher grades could indicate potential zones within the mineralized zone for higher-grade starter pits.
Range of palladium assay sample results (1,000 ppb is equivalent to 1.0 grams per tonne).
“Number of samples Range palladium (ppb) 8 Below detection limit 29 less than 100 17 101 to 500 5 501 to 1,000 5 1,001 to 2,000 6 2,001 to 4,000 3 4,001 to 6,569
“This is the same as g/t, so 6 samples ran 2 to 4 g/t palladium. Geological mapping and review of the Freewest diamond drilling in 2000 indicates the northeast-trending faults are composed of multi-intrusions of mafic to diabase dikes. Left lateral movement on the dikes is measured to be up to 100 metres. This graphic gives a good snap shot of the current resource and expansion potential, Mineralization starts at surface and the system appears to be about 30 meters wide. This would be an open pit operation.”
Agnew Lake property (also from company resources)
“The Agnew Lake property was acquired in July 2017 after discussions with the company’s advisers and review of the Ontario government geological database. It is located 80 kilometers west of Sudbury, Ontario, home of Glencore and Vale’s Canadian nickel-copper-platinum-group-elements mining and smelting operations.
“The Agnew Lake property comprises over 260 claims (about 6,000 hectares) and is part of the larger East Bull Lake-Agnew Lake mafic-ultramafic complex. The company believes this acquisition will position it to be one of the larger non-producing palladium explorers in North America.
“The Agnew Lake magmas have major element compositions that are very similar to the model parent liquids proposed for the mafic portions of the Stillwater and Bushveld complexes. The Agnew intrusion and the East Bull Lake intrusion are also considered to host significant PGE-Cu-Ni mineralization in marginal rock units (Peck & James, 1990; Peck et al., 1993a, 1993b, 1995; Vogel et al., 1997).”
In late 2017, BULL completed some initial work on this project. Review of historical data indicated that various palladium-platinum showings were acquired within the staked area. A two-week prospecting and grab sampling program was completed to assess the locations and grade of the various showings. A total of 58 samples have been submitted to the lab.”
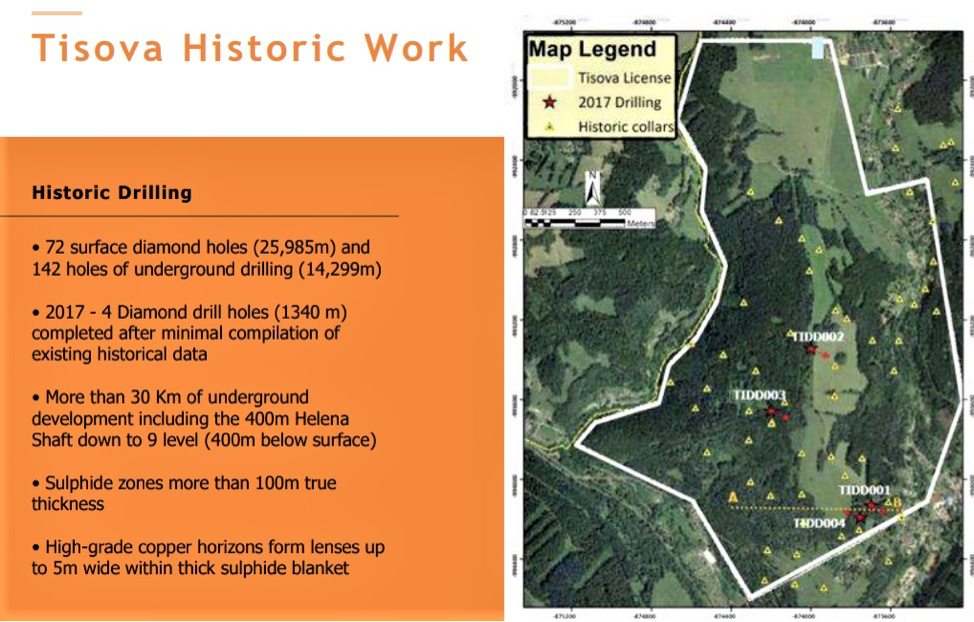
BULL has a third advanced project, the 15,928-hectare Tisova project. It is not the focus now, but just might end up being Mr. Tisdale’s fifth sale down the road some day. Here is a graphic of the historical work; more info can be found on the company presentation.
Financial
Last financial statements show just over $400,000 cash. The last financing was $2.8 million done at $0.18 per unit in a May 2018 placement, and included a 24-month $0.30 warrant. The company will have to raise more funding and I do not see any problem with that. When the stock gets over $0.30 they could have substantial financing with warrant exercise.
Summary
A recent update on palladium by TD Securities highlights tightening emission controls, and South Africa as I have explained, is risky, but most interesting is lack of speculative trading positions. TD comments positions held by traders are below average. This rally has room to move and if excessive speculation builds the stock could go way higher.
Regardless whether palladium is $1,200 or $2,000 per ounce, palladium discoveries and deposits will be worth premium valuations, especially in stable jurisdictions. The potential for discoveries in South Africa is very good, but the political risks are rising.
BULL has a lot more going for it besides the bull market in palladium (nice pun). Wayne Tisdale has been successful financing and increasing value of properties and dealing them off for large profits. I believe he will do it again, and he also has a loyal following of shareholders from his past success. BULL just acquired the property last year and there has been little exploration and no drilling, so it has been under the radar. The discovery is on surface, so will be cheap to mine, and is close to the Sudbury complex where refiners can recover PGMs. There are a couple other palladium exploration plays in Canada, but they are mostly old, stale stories, and I believe none have the short-term potential that the East Bull project has.
Currently the 523,000-ounce palladium resource is valued at a mere CA$18 per ounce, which is very low. Part of the reason is that the resource is only Inferred. If drilling success starts to prove larger potential and the resource gets move up to the measured and indicated category it could easily be valued at $300 to $500 per ounce.
The only exploration news from last year was sample results that came out last September, just when the junior market started heading south. The stock made a decent move higher, then just drifted lower until a typical year-end bottom. Last week the stock broke above the downtrend line when it hit $0.12 on good volume. I expect this move will take the stock to at least the $0.20 resistance area. The project has year-round access and the winter is a good time to drill. If we get that news, the stock could more easily break above the $0.20 resistance level.
Ron Struthers founded Struthers’ Resource Stock Report 23 years ago. The report covers senior and junior companies with ample trading liquidity. He started his Millennium Index of dividend stocks in 2003 – $1,000 invested then was worth over $4,000 end of 2014 and the index returned 26.8% in 2016. He retired from IBM after 30 years in customer service, systems and business analyst, also developing his own charting software. He has expertise in junior start-ups and was a co-founder of Paramount Gold and Silver.
Disclosure: 1) Ron Struthers: I, or members of my immediate household or family, own shares of the following companies mentioned in this article: Canadian Palladium. I personally am, or members of my immediate household or family are, paid by the following companies mentioned in this article: None. My company currently has a financial relationship with the following companies mentioned in this article: Canadian Palladium is an advertiser at playstocks.net. Additional disclosures below. I determined which companies would be included in this article based on my research and understanding of the sector. 2) The following companies mentioned in this article are sponsors of Streetwise Reports: None. Click here for important disclosures about sponsor fees. 3) Statements and opinions expressed are the opinions of the author and not of Streetwise Reports or its officers. The author is wholly responsible for the validity of the statements. The author was not paid by Streetwise Reports for this article. Streetwise Reports was not paid by the author to publish or syndicate this article. The information provided above is for informational purposes only and is not a recommendation to buy or sell any security. Streetwise Reports requires contributing authors to disclose any shareholdings in, or economic relationships with, companies that they write about. Streetwise Reports relies upon the authors to accurately provide this information and Streetwise Reports has no means of verifying its accuracy. 4) This article does not constitute investment advice. Each reader is encouraged to consult with his or her individual financial professional and any action a reader takes as a result of information presented here is his or her own responsibility. By opening this page, each reader accepts and agrees to Streetwise Reports’ terms of use and full legal disclaimer. This article is not a solicitation for investment. Streetwise Reports does not render general or specific investment advice and the information on Streetwise Reports should not be considered a recommendation to buy or sell any security. Streetwise Reports does not endorse or recommend the business, products, services or securities of any company mentioned on Streetwise Reports. 5) From time to time, Streetwise Reports LLC and its directors, officers, employees or members of their families, as well as persons interviewed for articles and interviews on the site, may have a long or short position in securities mentioned. Directors, officers, employees or members of their immediate families are prohibited from making purchases and/or sales of those securities in the open market or otherwise from the time of the interview or the decision to write an article until three business days after the publication of the interview or article. The foregoing prohibition does not apply to articles that in substance only restate previously published company releases.
Charts and images provided by the author.
Author’s Disclosures: Copyright 2020, Struthers’ Resource Stock Report. All forecasts and recommendations are based on opinion. Markets change direction with consensus beliefs, which may change at any time and without notice. The author/publisher of this publication has taken every precaution to provide the most accurate information possible. The information & data were obtained from sources believed to be reliable, but because the information & data source are beyond the author’s control, no representation or guarantee is made that it is complete or accurate. The reader accepts information on the condition that errors or omissions shall not be made the basis for any claim, demand or cause for action. Because of the ever-changing nature of information & statistics the author/publisher strongly encourages the reader to communicate directly with the company and/or with their personal investment adviser to obtain up to date information. Past results are not necessarily indicative of future results. Any statements non-factual in nature constitute only current opinions, which are subject to change. The author/publisher may or may not have a position in the securities and/or options relating thereto, & may make purchases and/or sales of these securities relating thereto from time to time in the open market or otherwise. Neither the information, nor opinions expressed, shall be construed as a solicitation to buy or sell any stock, futures or options contract mentioned herein. The author/publisher of this letter is not a qualified financial adviser & is not acting as such in this publication.
Chris Vermeulen joins me today to shares his trading strategy for 4 different markets. While most of these markets are not correlated he has reasons for why he is long in each. Pick and choose where you want to deploy your capital.
International lending by European banks, especially French banks, continued to rise in the third quarter, suggesting the contraction seen following the 2007-2009 global financial crises has now been reversed, according to the Bank for International Settlements (BIS).
The expansion of European banks’ cross-border lending comes amid an overall 9 percent rise global cross-border claims in the third quarter to $31 trillion at the end of September, the highest growth rate since end-March 2008, according to the latest International banking statistics by BIS, the Swiss-based forum for central bank cooperation.
The global expansion in lending was mainly driven by activity in advanced economies, which rose 10 percent year-on-year in the third quarter, while claims on emerging and developing economies contracted by 3 percent, with the biggest falls seen in claims on China, Turkey and Mexico.
As in recent quarters, lending to non-bank financial institutions continued to expand rapidly, rising by an annual 17 percent in the third quarter, outpacing the growth in claims on all other sectors.
One of the effects of the global financial crises was that banking regulators worldwide tightened their supervision of major banks, forcing them to retreat from riskier financing operations.
Non-bank financial firms, such as insurance companies, specialized lenders, leasing firms or institutional investors, such as pension funds and brokerage firms, took advantage of this hole in the market place.
Following the global financial crises, European banks retreated from international lending whereas U.S. and Japanese banks continued to expand their presence, BIS said.
For example, between mid-2008 and end-2017 German banks’ cross-border claims on non-banks fell an average annual rate of 5 percent while those of Japanese and U.S. banks’ claims rose an average 7.0 percent and 4.0 percent, respectively.
But since 2018 European banks’ cross-border lending has been expanding again, with an average annual growth rate of cross-border claims 9 percent by euro area banks and 11 percent by UK banks.
French banks have been particularly active, with their claims expanding at an average annual rate of 21 percent while the claims of German banks has remained virtually unchanged, BIS said.
Day after day, companies have been forced to make technological changes in order to adapt to new regulations, technological innovations and advances in society.
One of these changes that companies are now facing is the PSD2 digital payments regulation, which has gone into action since September 14, 2019.
What is PSD2?
PSD2 is the European regulation focused on electronic payment services. This system aims to facilitate and give maximum security to monetary transactions in Europe.
The PSD2 laws have been adapted and renewed according to technological advances and cybersecurity. In November 2018, the European Union communicated the new PSD2 regulation in order to fight against fraud in electronic payments, which has now entered into force on 14 September 2019.
What is the PSD2 regulation?
Some experts have announced that the new regulation will radically change the way we shop on the internet. But what does this new regulation really consist of?
Until now, when we wanted to make an online purchase, the platform redirected us to a payment gateway in which we had to insert certain information from our bank card (such as the number, expiration date and CVV). In many cases, this action is complemented with verification codes sent via SMS.
Therefore, we need a series of intermediaries to contact the company issuing the card, in order to indicate to our bank that the payment should be charged to another bank account.
With the new PSD2 regulation, every time the customer wants to make a digital payment, they must authenticate themselves using three ways: something you have (for example, coordinate card, mobile or ID card), something you know (a password or code, for example) or something you are (biometric proof such as voice or fingerprint).
In other words, bank cards will no longer be necessary to make purchases over the internet, nor will we be redirected to external payment gateways. With the new law, there will no longer be intermediaries and purchases can be made in a much easier way between client-company with total security.
How can companies adapt to this new law?
Faced with this, companies must adapt and have resources that adapt to the new regulations.
For example, payments through DTMF, i.e. by means of written insertion of digits, must update their resources, as this system will not serve them. Thus, other tools arrive that assume the role of the new regulation, such as telephone charging with a credit card.
This system, in addition to adapting to the new regulations, is integrated into a virtual PBX service. This also allows companies to offer customer service over the phone, as well as make payments over the phone.
However, given that many companies have not yet made any changes in their payment methods and are not ready to apply the new regulations, the Bank of Spain announced on September 5th a moratorium of 14 to 18 months for its full application.
The Bank of Spain points out that there will be no more postponements, and companies will have to adapt as soon as possible to this new law. This law aims to improve the security of both businesses and their customers, reduce intermediaries, and make businesses more competitive.
Bob Moriarty of 321gold explains why he has invested in this silver explorer with a project in Colorado.
Metals other than gold have finally gotten their wake-up call. Last week rhodium shot up to $7700 up from $575 three and a half years ago. Platinum broke $1000 to settle at $1027 and even silver was up.
South Africa has gone the Zimbabwe route. They are murdering white farmers and set the price of electricity below the cost of production. Much to their great surprise there isn’t much being produced. Since South Africa mines 78% of platinum and palladium along with the trace PGM rhodium, metal prices look a lot higher in the future.
I’ve always been a fan of silver at the right price. With the ratio of gold to silver hovering above 86-1 silver is cheap relative to gold. So if you like gold because you see the Fed is doing their best to destroy the world’s financial system, you should be buying silver. Over the last one hundred years the silver gold ratio has averaged 53-1. Above that silver is cheap relative to gold, below that gold is cheap relative to silver. Remember, buy when things are cheap and sell when they are dear.
Viscount Mining Corp. (VML:TSX.V; VLMGF:OTCBB) likes silver a lot. That’s probably because they have a lot of it. The company owns 100% of the Silver Cliff project located in Colorado. When Tenneco was an oil and gas company prior to their sale in 1988, they spent millions drilling and doing a pre-feasibility study to put Silver Cliff into production. Their work showed fifty million ounces of silver at Silver Cliff. Of course that resource was prior to 43-101 so doesn’t come with the money back guarantee that all 43-101 resources come with. It is now termed a “historic” resource. I don’t have any particular problem with it. Tenneco wasn’t going to go into production on a whim.
Silver Cliff does have an official 43-101 presumably coming with that standard double your money back guarantee. The resource came out in April of 2018 and showed 5.6 million ounces at 84 g/t silver in the indicated category and 7.1 million ounces at 70 g/t silver in the inferred category. The other 38 million ounces of silver that Tenneco found are probably still sitting right where they were in the 1980s waiting to be mined.
On the property there are a number of old mines dating back as far as 1878 when mining started until as late as 1894 when the price of silver wouldn’t carry the cost of production. At the very worst, Silver Creek provides Viscount Mining and potential investors a cheap long-term call on the price of silver.
But Viscount is not a one trick pony. In their stable of horses, they also have the Cherry Creek property located in Nevada just north of Ely in Eastern Nevada. Cherry Creek consists of over 400 patented and unpatented claims along with mill rights.
Some of the earliest mining in Nevada came from some of the 20 past producing mines now belonging to Viscount. In as early as 1861 a gold silver vein was discovered just south of the Cherry Creek property with mining starting in 1863. Silver was the primary economic value but there was some gold and even tungsten.
Viscount believes there is some central source to the mineralization to all the different mines. This is the first time in 150 years that all the properties and former mines have been assembled in one company.
Like most juniors, Viscount is trying to hang on with their teeth until market conditions improve. The Fed has so totally distorted the financial system that FOMO is the primary reason for investors to toss their money onto the table and pick up the dice. It seems that the dumber the investment the more attractive it is to the punting public.
I managed to call the top of “Bitcon” correctly over two years ago. $600 billion (with a capital B) disappeared off to Bitcon heaven. The FOMO fans still don’t understand that what they are holding in their hands smells like used dog poop because it is used dog poop. Even John McAfee now calls Bitcon “Ancient Technology.” I’m not real sure how much credibility to hand McAfee for his free advice. The last time anyone listened to him was when he was teaching Trump how to style his hair the McAfee way.
Then we had weed and obviously investors in weed were doing too much weed and got whacked once again. Now Apple and Tesla are popular. It would seem there is no shortage of investor stupidity. FOMO isn’t the best theory on investing, it is the worst.
Viscount needs to raise some money and get cranking but the market is being fickle. One day soon the tiny juniors will have their day and more money will come flowing into the resource sector. Meanwhile Silver Cliff puts a sort of floor under the shares. In 2006 and beyond, juniors were getting $3 an ounce for silver. Right now Viscount is only getting $1 an ounce so there isn’t all that much downside. It is a cheap perpetual call on silver.
For those who have never participated in a metals bull market, they get really interesting. Tech stocks had their day; real estate had its day, weed and Tesla are testing investor stupidity and the general stock market has turned into a reverse IQ test for Mensa.
The door to the resource candy store is sort of tiny and when everyone wants in at the same time it’s going to get crowded. And it is on the cards, it will happen.
I bought shares in the open market, I ‘m going to sit on them patiently and wait. Viscount is an advertiser and I naturally am biased. Do your own due diligence.
Bob Moriarty founded 321gold.com, with his late wife, Barbara Moriarty, more than 16 years ago. They later added 321energy.com to cover oil, natural gas, gasoline, coal, solar, wind and nuclear energy. Both sites feature articles, editorial opinions, pricing figures and updates on current events affecting both sectors. Previously, Moriarty was a Marine F-4B and O-1 pilot with more than 832 missions in Vietnam. He holds 14 international aviation records.
Disclosure: 1) Bob Moriarty: I, or members of my immediate household or family, own shares of the following companies mentioned in this article: Viscount Mining. My company has a financial relationship with the following companies mentioned in this article: Viscount Mining is an advertiser on 321 Gold. I determined which companies would be included in this article based on my research and understanding of the sector. 2) The following companies mentioned are billboard sponsors of Streetwise Reports: None. Click here for important disclosures about sponsor fees. 3) Statements and opinions expressed are the opinions of the author and not of Streetwise Reports or its officers. The author is wholly responsible for the validity of the statements. The author was not paid by Streetwise Reports for this article. Streetwise Reports was not paid by the author to publish or syndicate this article. The information provided above is for informational purposes only and is not a recommendation to buy or sell any security. Streetwise Reports requires contributing authors to disclose any shareholdings in, or economic relationships with, companies that they write about. Streetwise Reports relies upon the authors to accurately provide this information and Streetwise Reports has no means of verifying its accuracy. 4) The article does not constitute investment advice. Each reader is encouraged to consult with his or her individual financial professional and any action a reader takes as a result of information presented here is his or her own responsibility. By opening this page, each reader accepts and agrees to Streetwise Reports’ terms of use and full legal disclaimer. This article is not a solicitation for investment. Streetwise Reports does not render general or specific investment advice and the information on Streetwise Reports should not be considered a recommendation to buy or sell any security. Streetwise Reports does not endorse or recommend the business, products, services or securities of any company mentioned on Streetwise Reports. 5) From time to time, Streetwise Reports LLC and its directors, officers, employees or members of their families, as well as persons interviewed for articles and interviews on the site, may have a long or short position in securities mentioned. Directors, officers, employees or members of their immediate families are prohibited from making purchases and/or sales of those securities in the open market or otherwise from the time of the interview or the decision to write an article until three business days after the publication of the interview or article. The foregoing prohibition does not apply to articles that in substance only restate previously published company releases.
Preparing for the publication of important economic data in Australia
On the daily timeframe, the AUDUSD: D1 approached the neck line of the “head-shoulders” chart pattern of technical analysis.. It should be breached down before opening a position.
The bearish momentum may develop in case AUDUSD falls below the two last fractal lows at 0.6835. This level may serve as an entry point. The initial stop loss may be placed above the last fractal high, the 200-day moving average line and the Parabolic signal at 0.6942. After opening the pending order, we shall move the stop to the next fractal low following the Bollinger and Parabolic signals. Thus, we are changing the potential profit/loss to the breakeven point. More risk-averse traders may switch to the 4-hour chart after the trade and place there a stop loss moving it in the direction of the trade. If the price meets the stop level(0.6942) without reaching the order (0.6835), we recommend closing the position: the market sustains internal changes that were not taken into account.
China is the main trading partner of Australia. Chinese stock indices have decreased significantly, as investors fear that the viral infection will hurt the economy. Will the AUDUSD? fall
The Severe Acute Respiratory Syndrome (SARS) virus has spread in China and it can damage the economy and reduce demand for raw materials, including Australian ones. Another negative factor for the Australian dollar is the plan of the Reserve Bank of Australia (RBA) to cut the rate, which is now 0.75%. According to Fed Funds futures, the probability of this is 42% at the next meeting on February 4, 2020, and 62% at the meeting in March. While making a decision on a rate, the RBA will take into account the Consumer Sentiment Index for January, which will be released on January 22. This week, on Thursday and Friday, other significant macroeconomic data will published in Australia: unemployment and labor market indicators for December, as well as 3 PMI indices (industrial, service industries and composite) for January.
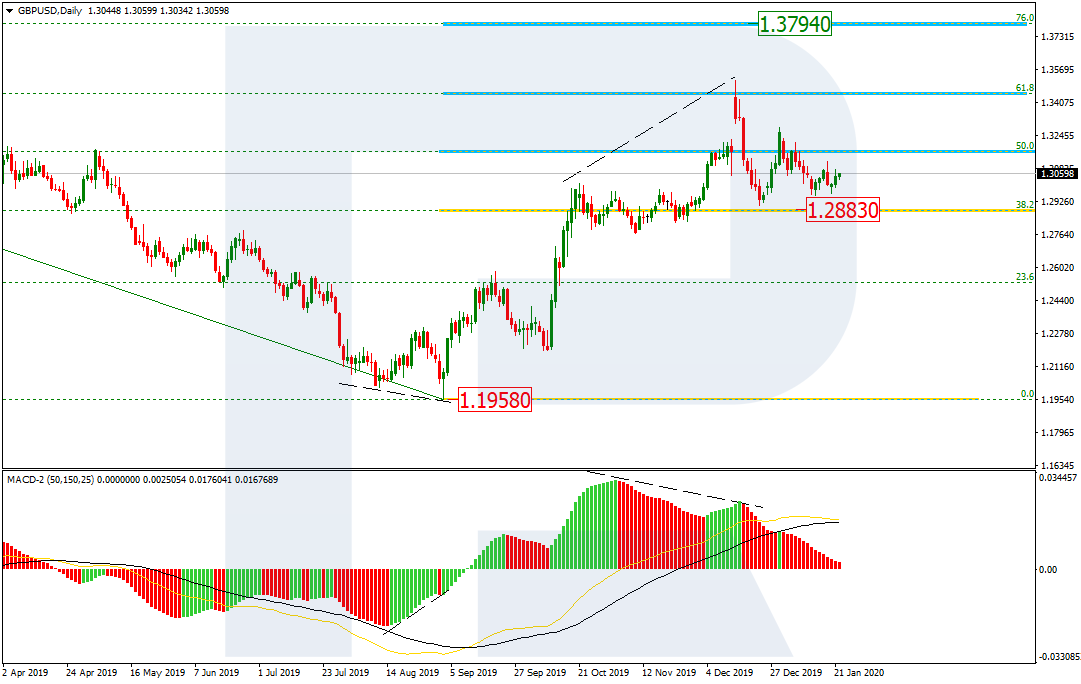
As we can see in the daily chart, GBPUSD is still correcting and forming Triangle pattern. The pair is stuck above the support at 38.2% (1.2883). If the price fails to break this level, it may start a new rising impulse to break the high at and reach mid-term 76.0% fibo at 1.3794.
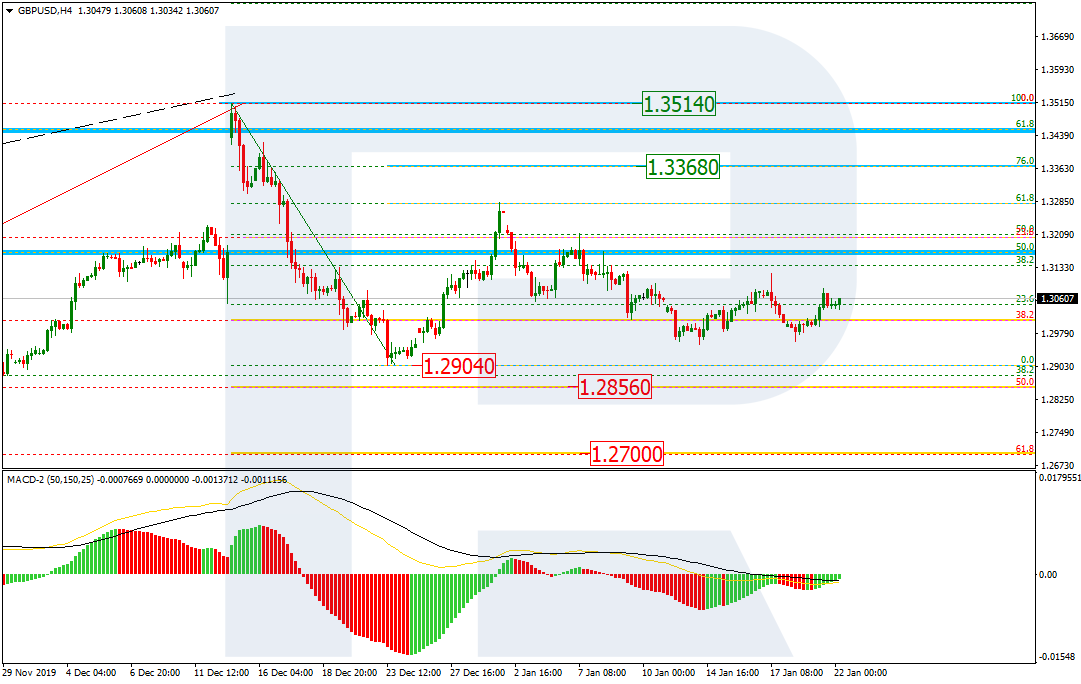
The H4 chart shows that the correction has stopped at 38.2% fibo. If the price breaks the local low at 1.2904, the pair may continue falling towards 50.0% and 61.8% fibo at 1.2856 and 1.2700 respectively.
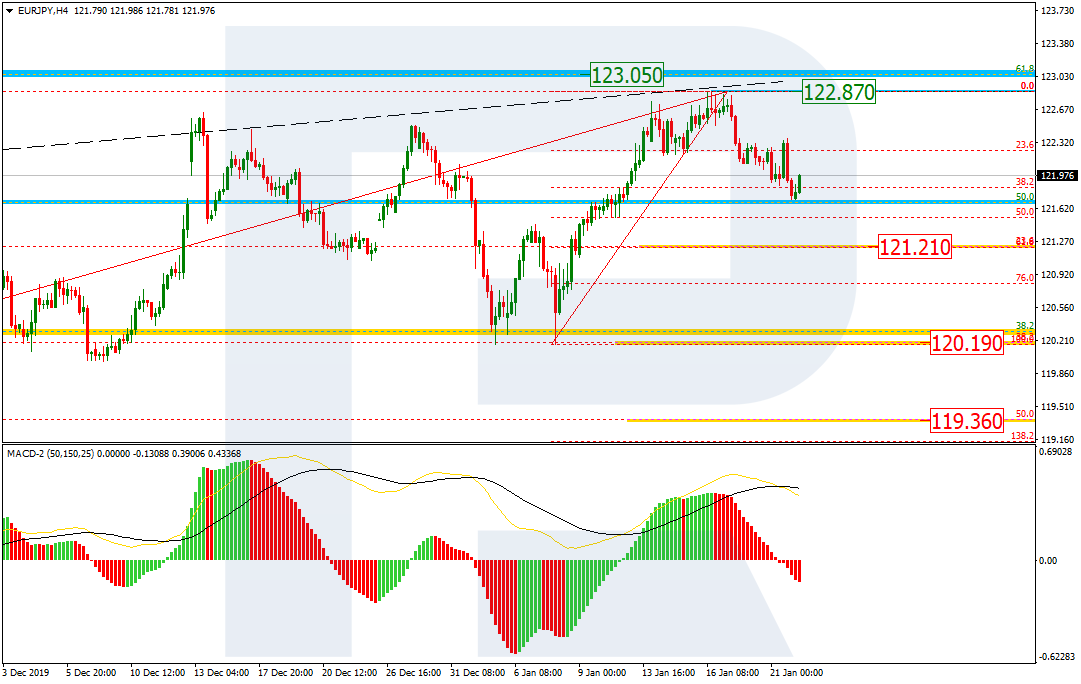
EURJPY, “Euro vs. Japanese Yen”
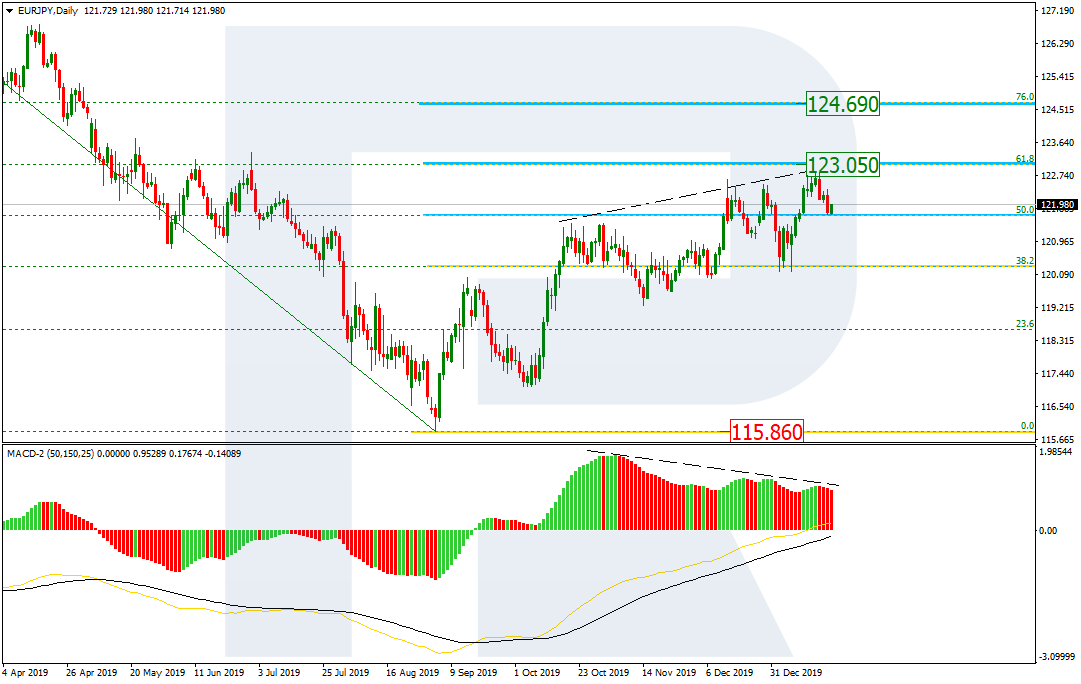
In the daily chart, after updating the previous high and failing to reach 61.8% fibo at 123.05, the pair has started a new pullback towards 50.0% fibo. Despite the divergence on MACD, it’s too early to think about the trend reverse, at least as long as EURJPY is trading above the support. It means that this decline should be considered as a new short-term correction, which may be followed by further growth towards 61.8% and 76.0% fibo at 123.05 and 124.69 respectively.
The H4 chart shows that the pair is moving downwards to reach 38.2%. However, if the price falls towards 23.6% fibo at 121.21, the decline may continue to reach 38.2% and 50.0% fibo at 120.19 and 119.36 respectively. If the price breaks the resistance at 122.87, the mid-term growth will continue.
Attention! Forecasts presented in this section only reflect the author’s private opinion and should not be considered as guidance for trading. RoboForex LP bears no responsibility for trading results based on trading recommendations described in these analytical reviews.
Trading in China has been hit by a double whammy: the spread of a deadly pneumonia virus (which has already claimed nine lives), only made worse by the (planned) closing of the financial markets, ahead of the traditional Lunar New Year celebrations.
While the jury is still out on what that could actually mean, by Tuesday (21 January 2020), we already saw a falling yuan, as well as steep declines in the FTSE China A50 Index (registering the biggest drop in six months), reports Bloomberg.
Quoting a Shanghai trader, Bloomberg points to the fact that “people are getting nervous and cashing out”. What fuels uncertainty is the five-day trading break, which will affect the markets in China and Hong Kong (starting on Friday).
As we try to explain below, Forex trading has already taken note, leading to a global shake-up in the currency markets.
People are “discouraged” from leaving their homes, having a spill-over effect on travel and sale of consumer goods.
This is likely to impact European luxury stocks, which are most exposed to fluctuations in the Asian market. In a separate article, Bloomberg shows that luxury holdings LVMH SE and Kering have already registered falls to the tune of 2.5% and 3.7% (respectively). But it is not those investing in Europe that should be worried.
Some are already drawing comparisons to the outbreak of SARS (Severe acute respiratory syndrome) pandemic, that hit southern China in 2002-2003. The biggest concern for FX trading is whether the virus is capable of spreading. Why? This might negatively affect the surrounding countries, whose currencies are considerably more vulnerable.
The downfall spiral is driven by speculation about how serious the virus actually is. And the official numbers, released by the Chinese authorities are not helping, says the Financial Times. Talking to epidemiologists and leading public health experts, the paper believes that they are prone to underreporting and are actually much higher in reality.
Adding to growing concerns, CNN confirmed that the virus can spread between humans, breaking news this morning (Wednesday, 22 January 2020). The virus, which originally started in the city of Wuhan, central China, has now traveled to Japan, South Korea, Taiwan, Thailand and, the United States.
Effects on Forex trading: markets are growing more risk-averse, as safer “options” gain territory.
On Tuesday (21 January 2020), analysts were pointing to “a stronger yen, a stronger Swiss franc and risk aversion is setting in across everything”, which made gains at the expense of a weaker yuan. Reuters picked up on 0.54% rise by US dollar against offshore yuan (standing at 6.904 per dollar).
What is more, FX traders should “exercise caution” in making transactions in currencies, linked to Chinese trade and tourism. As discussed, this is likely to have a negative effect on markets in South-East Asia. Taking another example, Reuters points to the Australian dollar, which “touched its lowest in over a month” (standing at 0.6842 against the US dollar).