Malaysia’s central bank surprised financial markets by cutting its benchmark Overnight Policy Rate (OPR) by 25 basis points to 2.75 percent in what it described as a “pre-emptive measure to secure growth trajectory and price stability.”
It was the first rate cut by Bank Negara Malaysia (BNM) since May 2019 when it was among the first wave of central banks to loosen their monetary policy in response to the slowing global economy alongside the Philippines, New Zealand and India.
Since May last year BNM had maintained its rate as the global pace of easing accelerated month-by-month with 67 central banks cutting rates a total of 159 times in 2019.
BNM’s monetary policy committee signaled today’s rate cut likely was a one-off, saying “the MPC considers the stance of monetary policy to be appropriate in sustaining economic growth with price stability.”
Economists had expected BNM to hold off on any easing until the effects of the government’s fiscal tightening, aimed at lowering the deficit and debt, on consumption becomes clearer.
Although BNM was relatively upbeat about the outlook for the both the global and domestic economy, it said downside risks remain due to geopolitical tensions and policy uncertainty in a number of countries that could trigger financial market volatility and weigh on global growth.
Looking at Malaysia’s economy, the central bank said economic activity in the fourth quarter of 2019 expanded moderately and growth for the year would be within the projected range and then gradually improve in 2020, with continued support from household spending, better exports and a modest recover in investments, both in the public and private sectors.
In the third quarter of 2019 Malaysia’s gross domestic product grew by an annual 4.4 percent, down from 4.9 percent in the second quarter and the government has estimated 2019 growth of 4.7 percent, rising to 4.8 percent in 2020.
Last month the International Monetary Fund estimated 2019 growth of 4.5 percent and the same rate in 2020 but cautioned the risks to the growth outlook remain to the downside as continued tensions between the U.S. and China affect Malaysia’s growth.
Malaysia’s inflation rate averaged 0.7 percent last year and BNM forecast it would rise this year but still “remain modest.”
Malaysia’s ringgit has been appreciating since December last year though it gave back some its gains in the last few days. But in response to the rate cut, the ringgit rose to 4.06 to the U.S. dollar to be up 0.7 percent since the start of the year.
Bank Negara Malaysia issued the following press release:
“At its meeting today, the Monetary Policy Committee (MPC) of Bank Negara Malaysia decided to reduce the Overnight Policy Rate (OPR) to 2.75 percent. The ceiling and floor rates of the corridor of the OPR are correspondingly reduced to 3.00 percent and 2.50 percent, respectively.
The global economy continues to expand at a moderate pace. Latest indicators and the recent dissipation of trade tensions point to improving global trade activity. Monetary easing across major economies in the second half of 2019 has helped ease financial conditions, and is expected to continue to support economic activity. However, downside risks remain due to geopolitical tensions and policy uncertainties in a number of countries. This could cause a resurgence of financial market volatility and weigh on the global growth outlook.
For the Malaysian economy, latest indicators and supply disruptions in commodity-related sectors point to moderate expansion of economic activity in the fourth quarter. For 2019, growth will be within the projected range. For 2020, growth is expected to gradually improve, with continued support from household spending and better export performance. Overall investment activity is expected to record a modest recovery, underpinned by ongoing and new projects, both in the public and private sectors. However, downside risks to growth remain. These include uncertainty from various trade negotiations, geopolitical risks, weaker-than-expected growth of major trade partners, heightened volatility in financial markets, and domestic factors that include weakness in commodity-related sectors and delays in the implementation of projects.
Headline inflation averaged at 0.7% in 2019. In 2020, headline inflation is expected to average higher but remain modest. The trajectory of headline inflation will be dependent on global oil and commodity price developments and the timing of the lifting of the domestic retail fuel price ceilings. Underlying inflation is expected to remain broadly stable, reflecting the continued expansion in economic activity and the absence of strong demand pressures.
The adjustment to the OPR is a pre-emptive measure to secure the improving growth trajectory amid price stability. At this current level of the OPR, the MPC considers the stance of monetary policy to be appropriate in sustaining economic growth with price stability.”
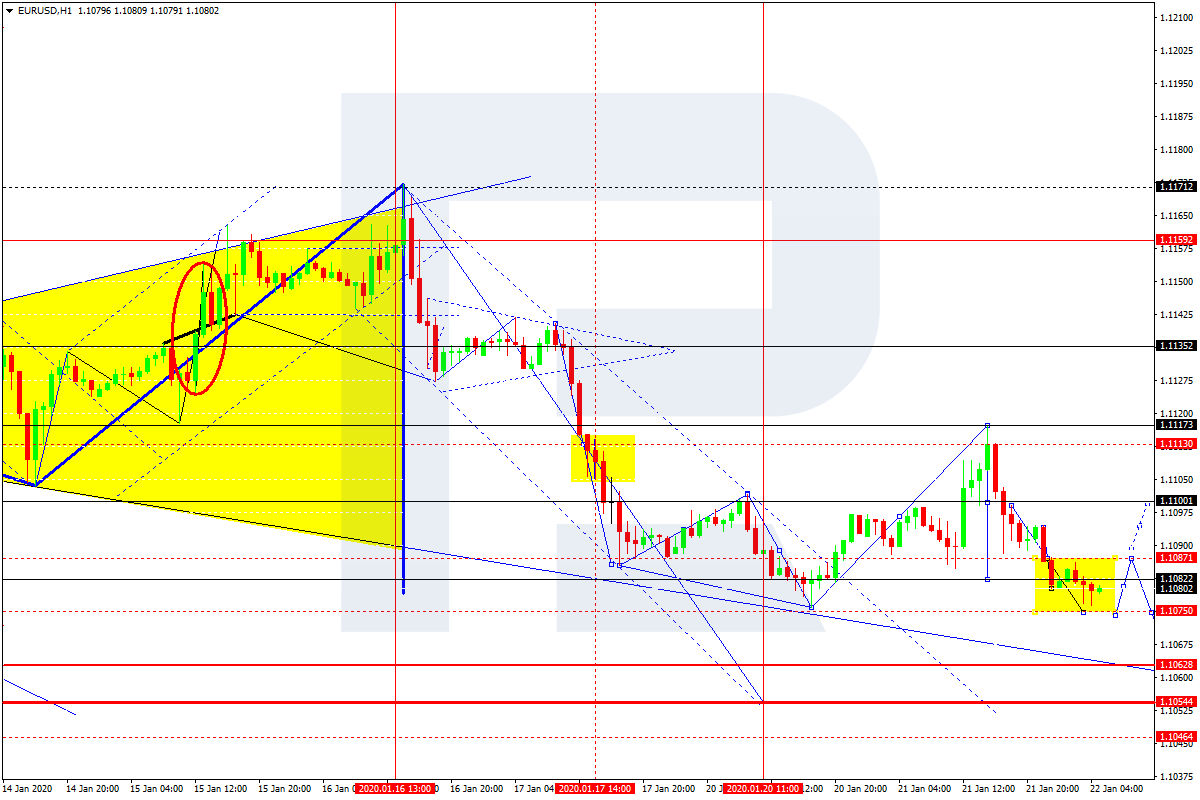
EURUSD is forming the fifth descending wave; after finishing the correctional wave towards 1.1117, the price has completed another descending structure with the first target at 1.1080. At the moment, the instrument is consolidating. Possibly, the pair may fall to reach 1.1075 and then grow towards 1.1087 at least. Later, the market may start a new decline with the target at 1.1062.
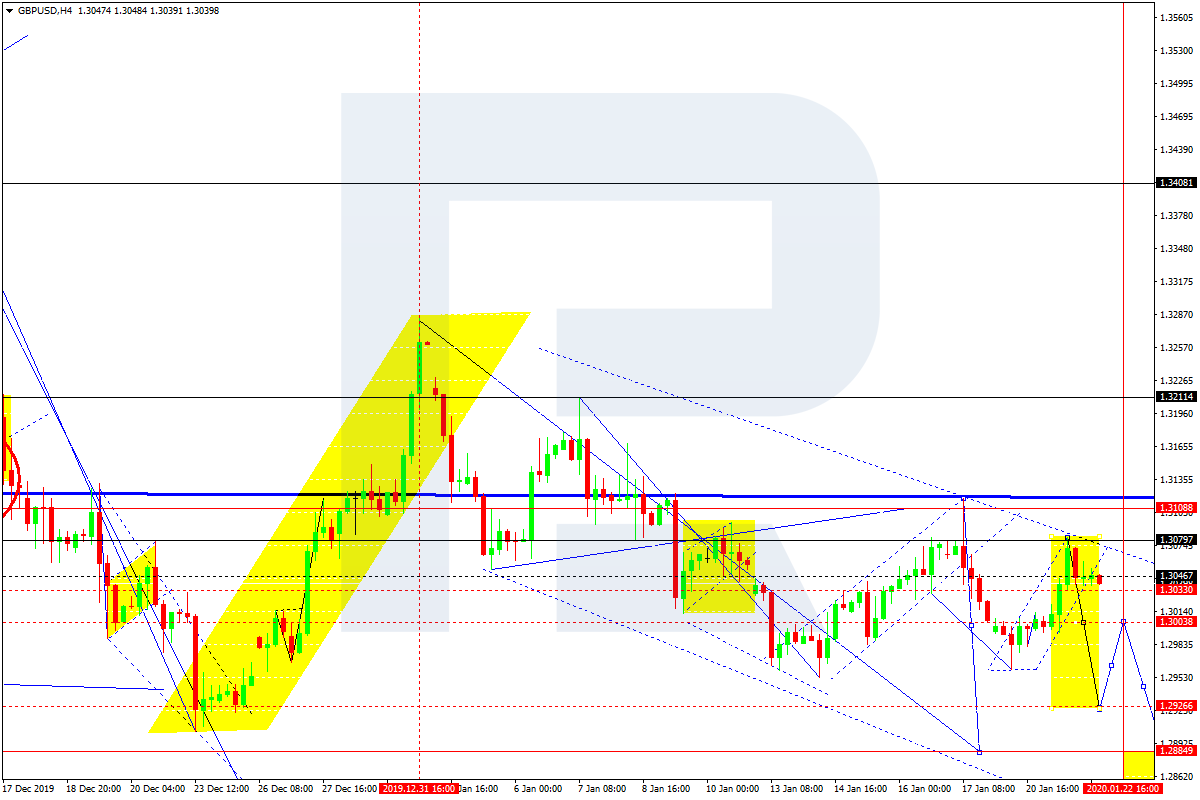
GBPUSD, “Great Britain Pound vs US Dollar”
GBPUSD has finished the ascending correctional structure towards 1.3080. Today, the pair may fall to break 1.3000 and then continue trading inside the downtrend with the short-term target at 1.2927.
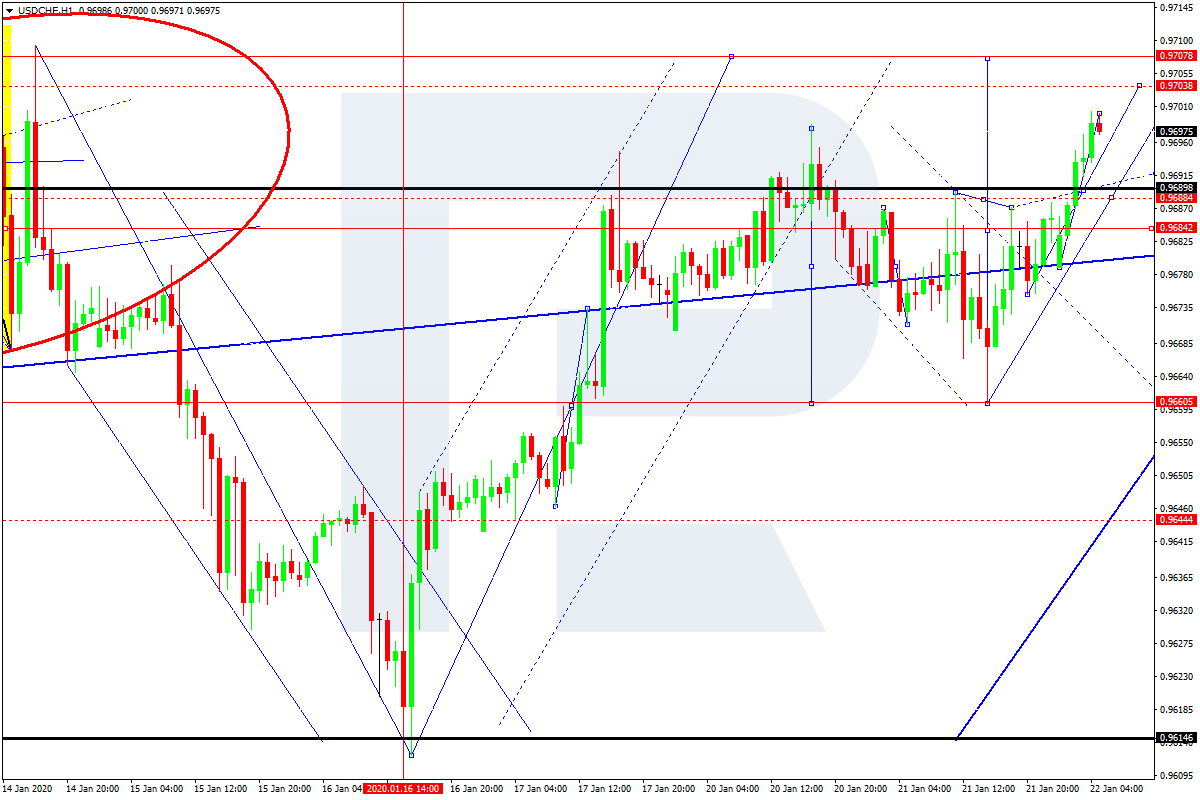
USDCHF, “US Dollar vs Swiss Franc”
USDCHF has broken 0.9688; right now, it is still forming the fifth ascending wave. Possibly, today the pair may test 0.9690 from above and then form one more ascending structure with the short-term target at 0.9703.
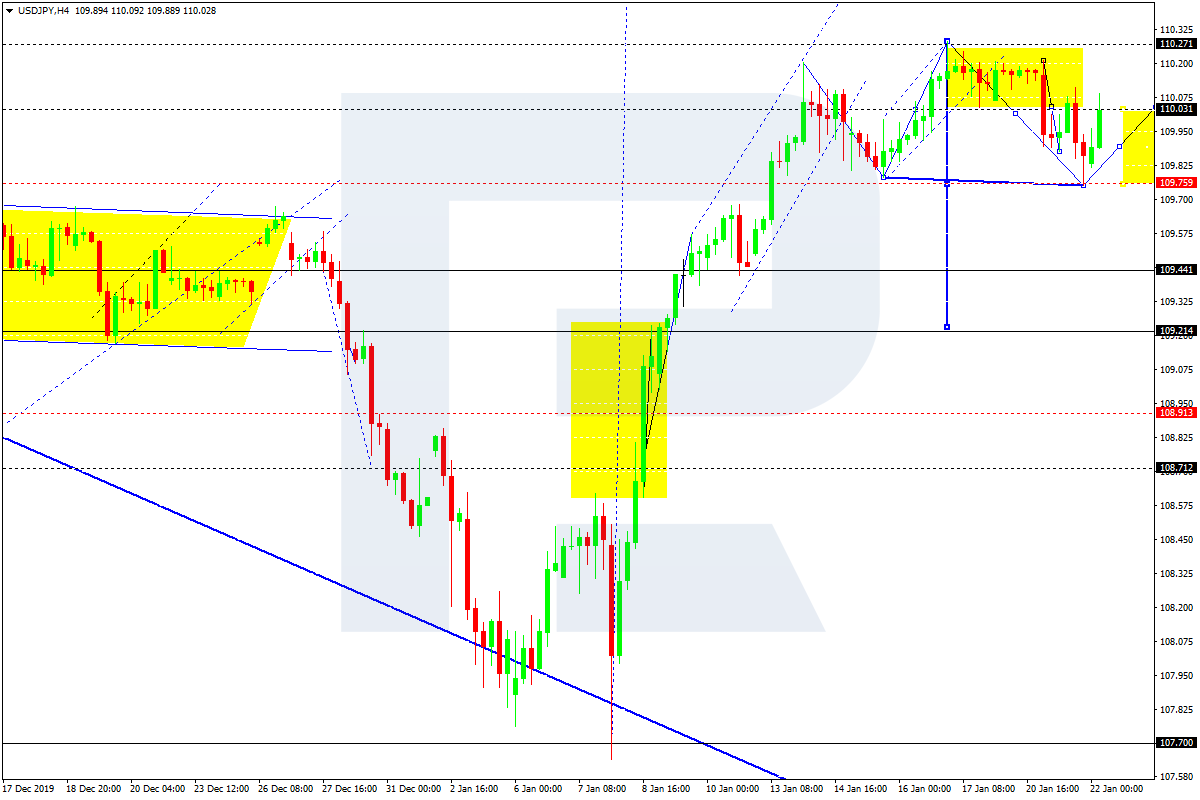
USDJPY, “US Dollar vs Japanese Yen”
After completing the descending impulse at 109.80, USDJPY has finished the correction towards 110.03. Today, the pair may fall to break 109.80 and then continue moving downwards with the short-term target at 109.41.
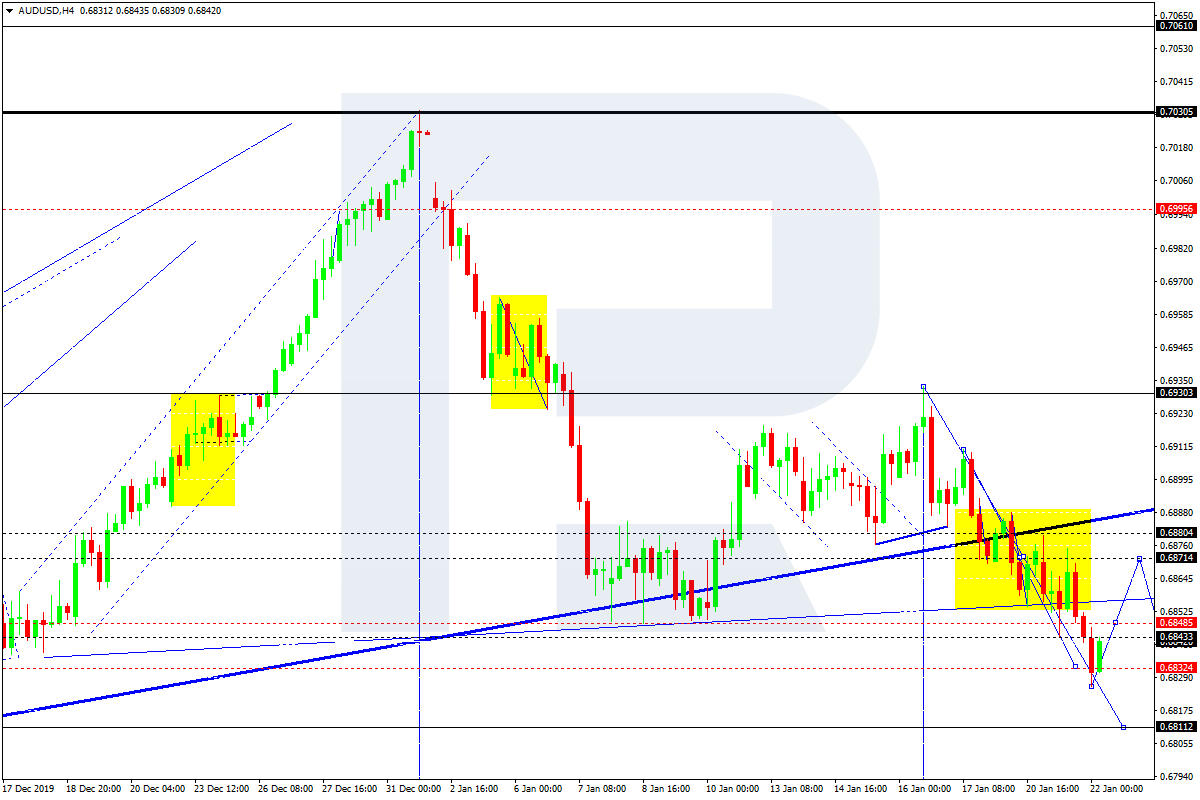
AUDUSD, “Australian Dollar vs US Dollar”
AUDUSD has finished the descending structure towards 0.6832. Possibly, today the pair may resume moving upwards to reach 0.6850 and then start another decline with the target at 0.6811.
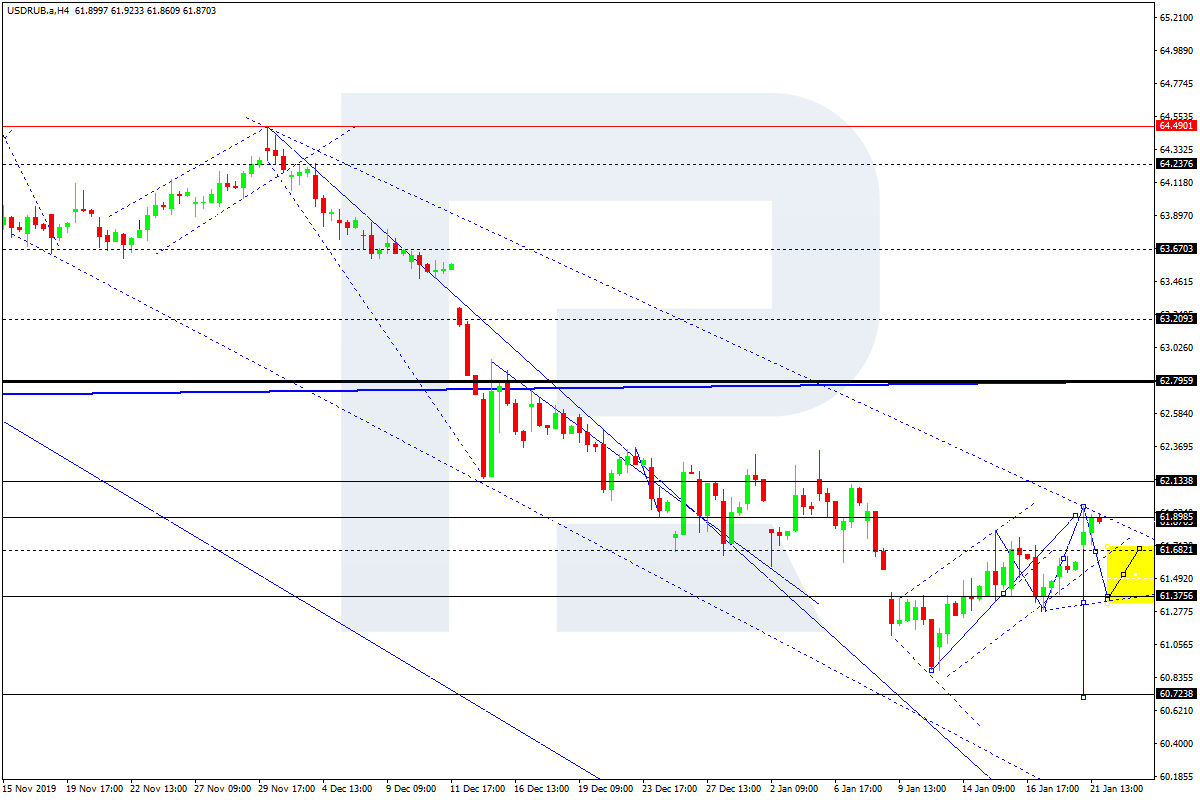
USDRUB, “US Dollar vs Russian Ruble”
USDRUB has reached 61.90; right now, it is consolidating at the top. According to the main scenario, the price is expected to resume trading inside the downtrend with the target at 61.37.
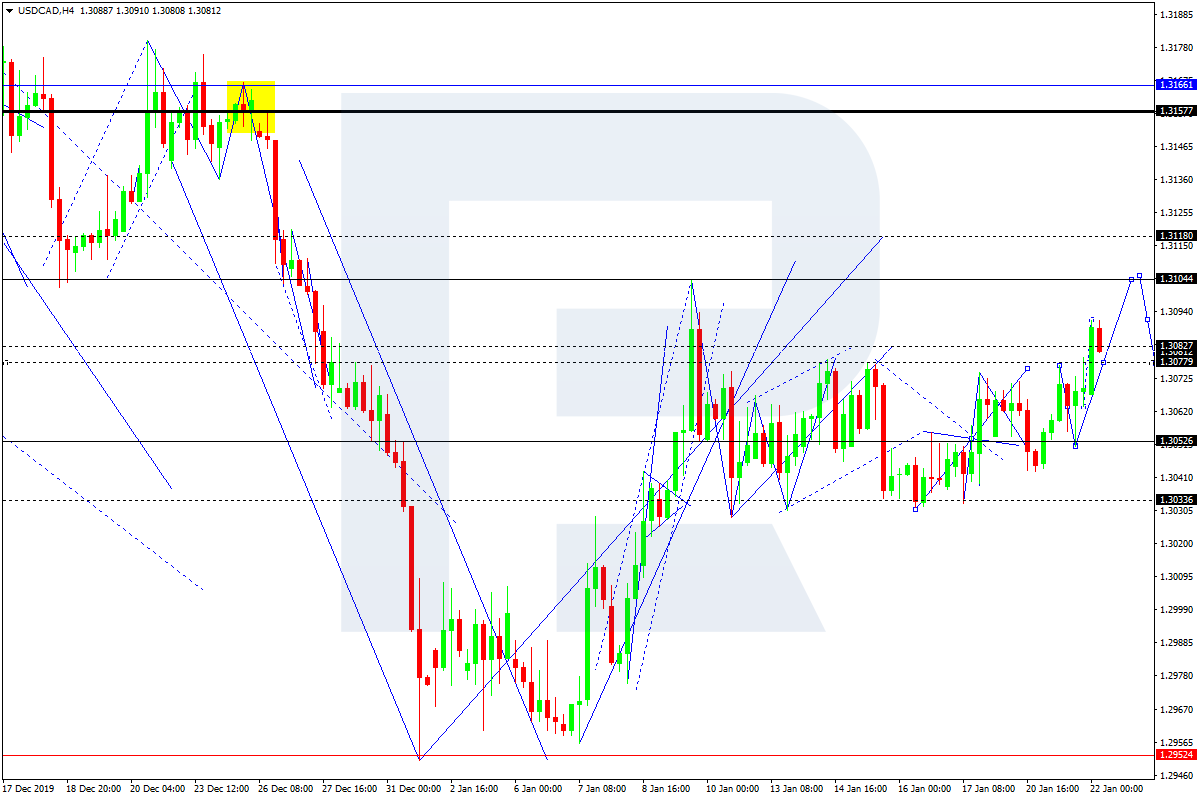
USDCAD, “US Dollar vs Canadian Dollar”
USDCAD is forming another ascending structure towards 1.3104. After that, the instrument may start a new correction to reach 1.3077 and then resume trading upwards growth with the target at 1.3118.
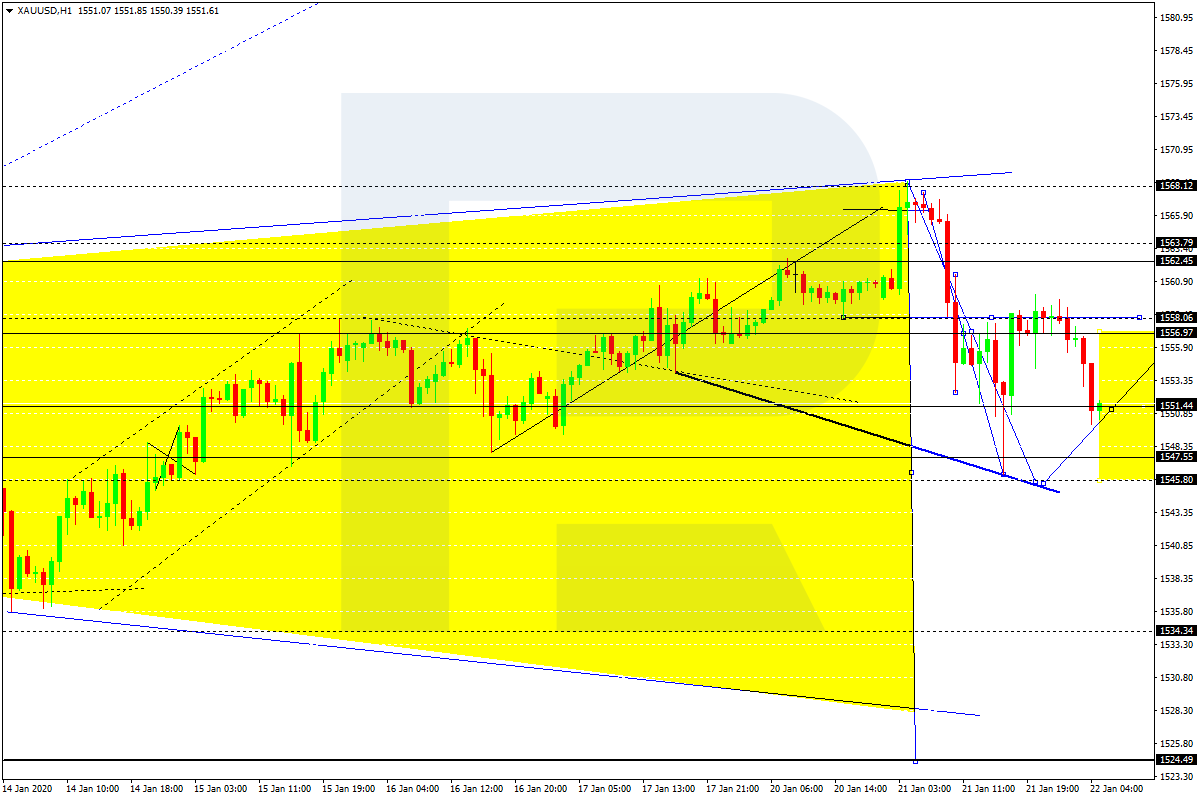
XAUUSD, “Gold vs US Dollar”
Gold is forming one more descending structure towards 1545.80. Later, the market may start another correction with the target at 1556.96 and then resume trading downwards to reach 1534.34.
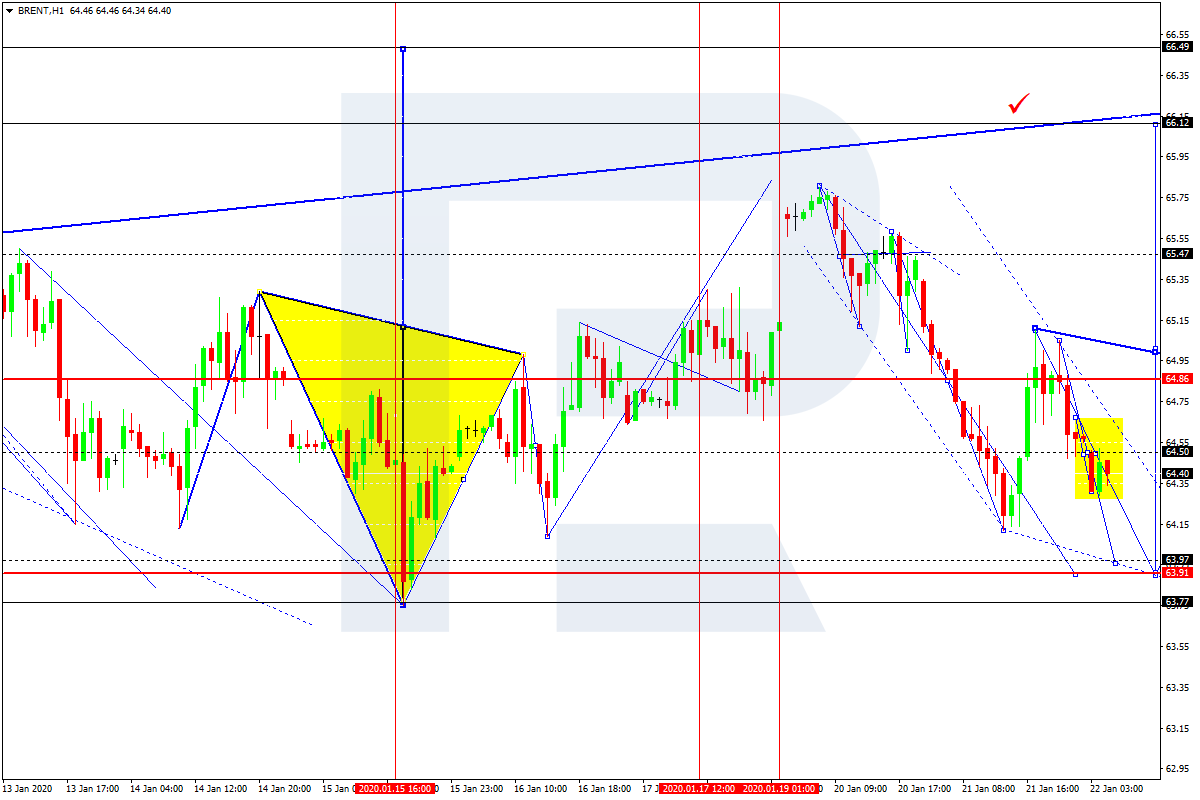
BRENT
Brent is moving downwards. Possibly, the pair may reach 63.97 and then start another growth with the target at 64.90.
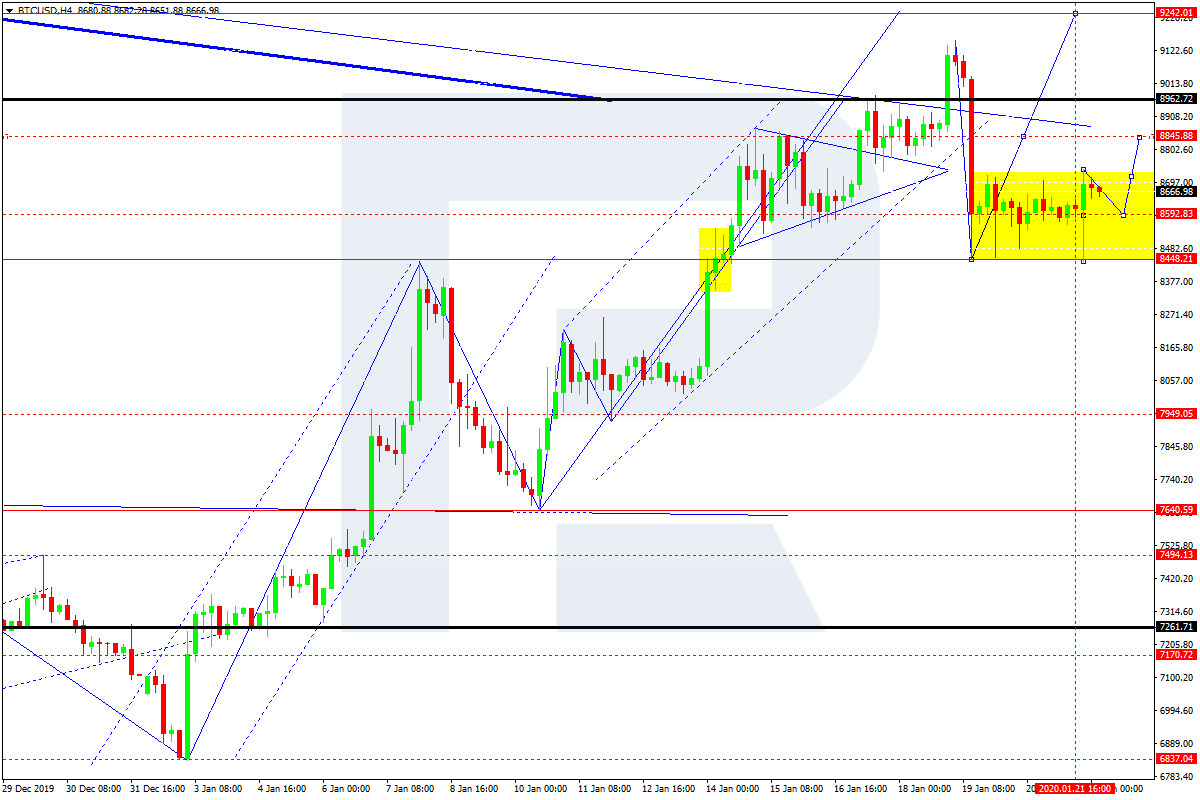
BTCUSD, “Bitcoin vs US Dollar”
BTCUSD is still consolidating around 8600.00. The main scenario implies that the pair may grow to break 8850.00 and then continue trading upwards to reach 9240.00. After that, the instrument may start a new decline with the target at 7700.00.
Attention! Forecasts presented in this section only reflect the author’s private opinion and should not be considered as guidance for trading. RoboForex LP bears no responsibility for trading results based on trading recommendations described in these analytical reviews.
The bullish financial markets are indifferent to the Trump impeachment trial – more concerning is the U.S.-China trade deal and the Coronavirus, says the CEO of one of the world’s largest independent financial services and advisory organizations.
The comments from deVere Group chief executive, Nigel Green, come as U.S. President Donald Trump’s historic impeachment trial got underway on Tuesday in the Senate, with Democrats calling for his removal from office and Republicans determined to have him acquitted.
Mr Green says: “A major geopolitical event such as the impeachment trial of a U.S. President would, typically, send shock waves through financial markets.
“This has not been the case here. The seemingly relentlessly bullish markets have largely shown indifference to the impeachment process.
“This is because investors see the likelihood of Trump being removed from the White House following a Senate trial as almost zero.”
He continues: “However, what is far more likely to cause market jitters in the coming weeks are vulnerable trade relations between the U.S. and China, the world’s two largest economies.
“U.S.-China phase one deal has stopped additional tariffs being imposed on each other’s goods. However, it does not address serious structural issues of trade between two vastly different economies, one which has enormous state capacity. In addition, the sheer number of goods – amounting to $200bn –that China will need to buy from the U.S. could, ultimately, make the deal unworkable.
“The hard part is negotiations yet to come.”
Mr Green goes on to add: “Markets will also be weighing concerns regarding the spread of the Coronavirus that has afflicted hundreds in China so far – as hundreds of millions prepare to travel during the Lunar New Year period. It’s the largest annual human migration on Earth.
“The World Health Organisation is meeting on Wednesday to discuss the situation. An upscaling of the threat could depress markets and hit consumer sentiment and spending.”
The deVere CEO concludes: “This bull market isn’t bothered about Trump’s impeachment trial. It will be closely monitoring other major issues, including the U.S.-China trade dispute – the far-reaching impact of which is likely to outlive Trump’s presidency.”
About:
deVere Group is one of the world’s largest independent advisors of specialist global financial solutions to international, local mass affluent, and high-net-worth clients. It has a network of more than 70 offices across the world, over 80,000 clients and $12bn under adviseme
Since the beginning of this week, trading on the EUR/USD currency pair has been very active. At the same time, there is no defined trend. At the moment, EUR/USD quotes are testing local support of 1.10800. Round level 1.11000 is the nearest resistance. Investors expect additional drivers. The trading instrument can decline further. We recommend opening positions from key levels.
At 17:00 (GMT+2:00) the US will publish data on existing home sales.
The price is fixed below 50 MA and 100 MA, which signals the strength of the sellers.
The MACD histogram has moved to the negative zone, which indicates a bearish sentiment.
The stochastic oscillator is in the neutral zone, the %K line is above the %D line, which gives a signal to buy EUR/USD.
Trading recommendations
Support levels: 1.10800, 1.10500
Resistance levels: 1.11000, 1.11200, 1.11450
If the price fixes below 1.10800, further decline of EUR/USD quotes is expected. Expect movement toward 1.10500-1.10300.
Alternatively, the EUR/USD currency pair may recover to 1.11200-1.11400.
The GBP/USD currency pair
Technical indicators of the currency pair:
Prev Open: 1.30076
Open: 1.30450
% chg. over the last day: +0.27
Day’s range: 1.30347 – 1.30614
52 wk range: 1.1959 – 1.3516
The GBP/USD currency pair has moved up. The trading instrument has updated its local highs. Sterling was supported by a positive report on the UK labor market. At the moment GBP/USD quotes are consolidating. The key range is 1.30350-1.30750. The technical picture signals about further correction of GBP/USD currency pair. Today we recommend you to pay attention to the economic releases from the USA. Positions should be opened from key levels.
The news background on the UK economy is quite calm.
Indicators do not give an accurate signal: 50 MA crossed 100 MA.
The MACD histogram is in the positive zone, which indicates the growth of GBP/USD quotes.
The stochastic oscillator is in the neutral zone, the %K line is above the %D line, which indicates a bullish mood.
Trading recommendations
Support levels: 1.30350, 1.30000, 1.29600
Resistance levels: 1.30750, 1.31000, 1.31450
If the price fixes above 1.30750, expect further growth of GBP/USD to 1.31000-1.31400.
Alternatively, the GBP/USD currency pair may decline to 1.30100-1.29800.
The USD/CAD currency pair
Technical indicators of the currency pair:
Prev Open: 1.30474
Open: 1.30712
% chg. over the last day: +0.20
Day’s range: 1.30712 – 1.30918
52 wk range: 1.2949 – 1.3566
USD/CAD quotes have started to recover. The trading instrument has updated its local highs. Currently, the Moon is consolidating in the range of 1.30700-1.30900. Financial markets participants took a waiting position before the Bank of Canada meeting. It is expected that the regulator will leave the main monetary policy parameters at the same level. We also recommend to pay attention to the dynamics of oil prices. Positions should be opened from key levels.
The Economic News Feed for 22.01.2020:
– Data on inflation in Canada – 15:30 (GMT+2:00);
– Bank of Canada key interest rate decision – 17:00 (GMT+2:00).
The indicators signal the strength of buyers: the price has fixed above 50 MA and 100 MA.
MACD histogram is in the positive zone, which gives a signal to buy USD/CAD.
The stochastic oscillator is in the neutral zone, the %K line is below the %D line, which indicates a bearish sentiment.
Trading recommendations
Support levels: 1.30700, 1.30500, 1.30350
Resistance levels: 1.30900, 1.31000, 1.31200
If the price fixes above 1.30900, expect further growth toward 1.31200-1.31400.
Alternatively, the quotes could descend toward 1.30500-1.30300.
The USD/JPY currency pair
Technical indicators of the currency pair:
Prev Open: 110.176
Open: 109.848
% chg. over the last day: -0.25
Day’s range: 109.827 – 110.096
52 wk range: 104.45 – 113.53
The USD/JPY currency pair has an ambiguous technical picture. The trading instrument is being consolidated. USD/JPY quotes are testing local support and resistance levels: 109.800 and 110.100, respectively. In the nearest future correction of USD/JPY currency pair after the prolonged growth is not excluded. We recommend you to pay attention to the US government bond yield dynamics. Positions should be opened from key levels.
The Economic News Feed for 22.01.2020 is calm.
Indicators do not give an accurate signal: 50 MA crossed 100 MA.
MACD histogram is near the 0 mark.
The stochastic oscillator is located in the neutral zone, the %K line has crossed the %D line. No signals at the moment.
Trading recommendations
Support levels: 109.800, 109.600, 109.350
Resistance levels: 110.100, 110.300, 110.600
If the price fixes below 109.800, USD/JPY quotes are expected to correct. Potential movement towards 109.500-109.300.
Alternative is the growth of USD/JPY pair to 110.400-110.600.
The US currency fell slightly against a basket of major currencies. The dollar index (#DX) closed in the red zone (-0.07%). Investors’ attention was focused on the outbreak of coronavirus in China yesterday. However, the Chinese authorities assured the population and the international community that they had taken large-scale measures to prevent viral shedding. This has improved the sentiment of financial market participants. It should be recalled that the outbreak of pneumonia was recorded in China in December, the previously unknown coronavirus became the causative agent.
The winner of yesterday’s trading was the British pound, which rose against the US dollar. The British currency was supported by optimistic data on the UK labor economy. The average salary rose in November by 3.2%, while experts expected growth by 3.1%. Initial jobless claims fell in December and counted to 14.9K instead of the forecasted value of 22.6K. Today, the Bank of Canada will announce its interest rate decision. It is expected that the regulator will keep the key marks of monetary policy at the same level.
The “black gold” prices are declining. Currently, futures for the WTI crude oil are testing the $57.95 mark per barrel.
Market Indicators
Yesterday, there was the bearish sentiment on the US stock market: #SPY (-0.20%), #DIA (-0.49%), #QQQ (-0.04%).
The 10-year US government bonds yield has declined. At the moment, the indicator is at the level of 1.77-1.78%.
The Economic News Feed for 22.01.2020:
– Core consumer price index in Canada at 15:30 (GMT+2:00);
– Existing home sales in the US at 17:00 (GMT+2:00);
– Bank of Canada interest rate decision at 17:00 (GMT+2:00).
Drill results for this company’s prospect, flanked by notable mines, is the subject of this interview with Proven and Probable’s Maurice Jackson.
Maurice Jackson: Welcome to Proven and Probable. Joining us for a conversation is the president and CEO of Riverside Resources Inc. (RRI:TSX.V; RVSDF:OTCQB), John-Mark Staude. Riverside has some intriguing news now, starting 2020, regarding high-grade gold coming from the company’s Los Cuarentas gold project in Sonora, Mexico.
John-Mark, before we discuss today’s press release, for someone new to Riverside, please introduce the unique value proposition the company presents to the market.
John-Mark S.: Riverside is an integrated prospect generator company. We have major alliances with some of the biggest mining companies. We expose the shareholder to multiple opportunities and multiple commodities with a limited risk. We really like this model.
Maurice Jackson: Let’s visit Sonora State, Mexico, where, as I understand, [you’ve] just returned from the field. John-Mark, talk to us about the Los Cuarentas gold project and the recent rock-chip sample program results. How did Riverside come up with such a project and acquire this location?
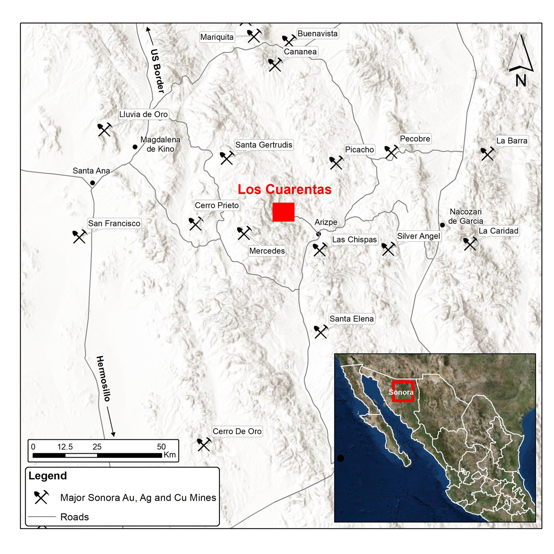
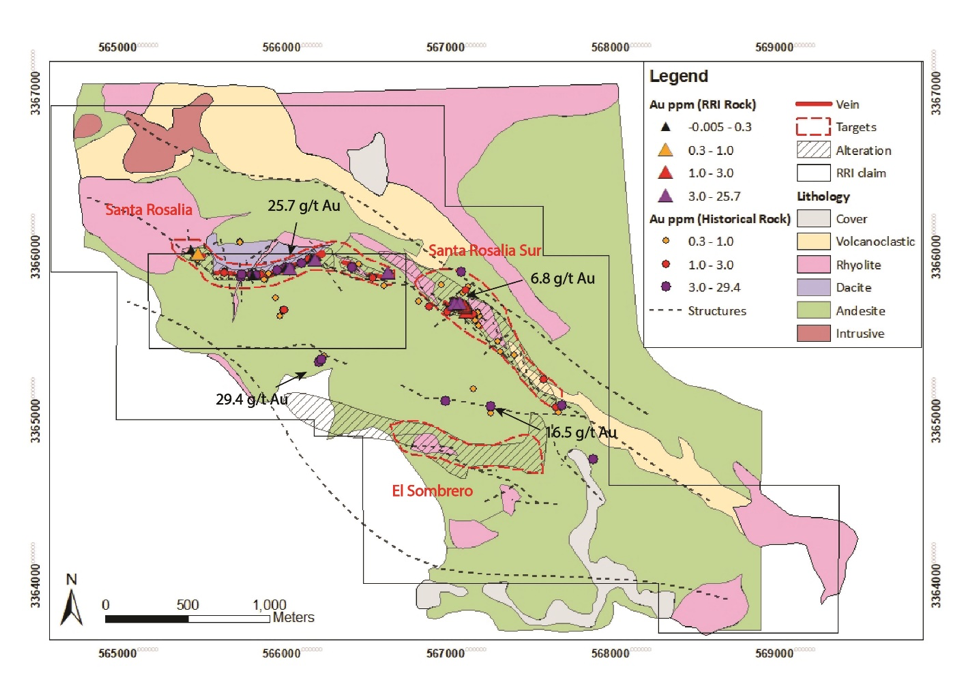
John-Mark S.: We’re really excited. Riverside acquired the Los Cuarantes by optioning and then buying five projects from Millrock Resources Inc. (MRO:TSX.V; MLRKF:OTCQB). The location of Los Cuarentas is immediately to the east of the major gold mine of Mercedes that’s operated now by Premier Gold Mines Ltd. (PG:TSX). It’s immediately to the west of the Las Chispas project, which is very exciting for SilverCrest Metals Inc. (SIL:TSX.V), which has been making big discoveries, moving ahead quickly toward development, [which] shows that there’s mining right adjacent to us. Our location is fabulous for very fast potential transactions, and we can see immediately that the high-grade material from the Los Cuarentas could feed into either Las Chispas or into Premier Gold Mines’ Mercedes mining complexes.
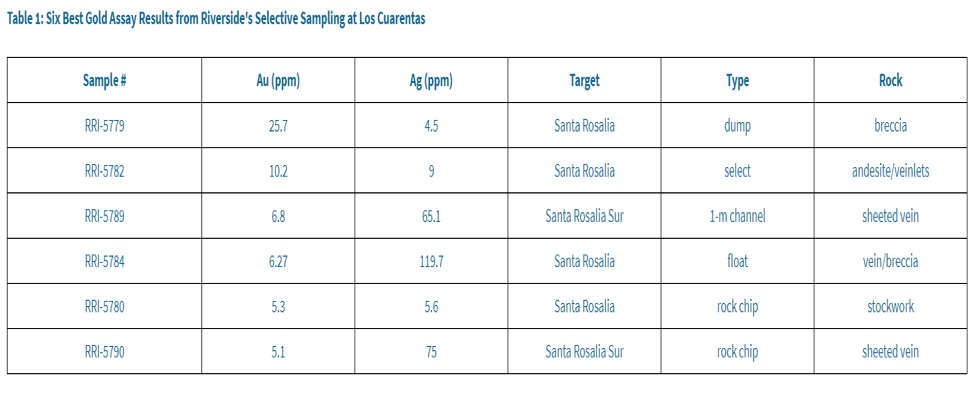
Maurice Jackson: Now, for early 2020, Riverside just released some impressive rock chip sampling results from the current field program that is looking to set up drill targeting. Dr. Staude, can you briefly summarize the Los Cuarentas gold project and some of the key highlights from the recent sample program?
John-Mark S.: The location, with Las Chispas immediately to the east and Mercedes immediately to the west, makes Los Cuarentas an ideal [prospect]. In fact, we’re surrounded by various mines, really a good mining location. These results are excellent for us. Having 25 grams of gold, high-grade gold, from dump samples and having multiple samples of rock float, rock chip, all having high-grade mineralization, really makes it exciting for us at the project Los Cuarentas.
Maurice Jackson: Consistency is paramount to achieve success and accelerate exploration efforts. How do the first set of results conducted by Riverside correspond with historical results on the Los Cuarentas?
John-Mark S.: Looking at the map, it shows the historical work along with Riverside’s work. We have similar values along the structures here going multiple kilometers longhigh-grade mineralizationand particularly the Santa Rosalia target, and the Santa Rosalia Sur target, are very good for high-grade mineralization right at the surface.
Maurice Jackson: John-Mark, you referenced two target areas. Can we take a more in-depth look at both of them please?
John-Mark S.: The first target is the Santa Rosalia. We can follow this target along strike here well over a kilometer with very little mining, hydrate mining in here, but no drilling. So we’re very excited about the drill potential at the Santa Rosalia.
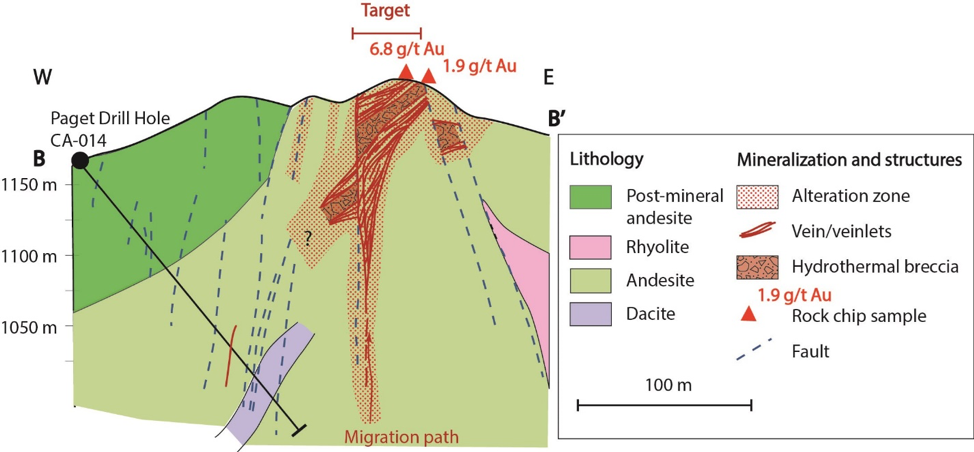
If you go to the Santa Rosalia Sur immediately to the south, there’s an old drill hole that didn’t reach the actual target and the target zone has wide intercepts of 68.8 grams, [and] other gold mineralization right at the surface next to the vein structures. On the Santa Rosalia Sur, we have a long zone, again, a kilometer of mineralization. Our team’s been working hard. Very excited to have just got back from the field and now have this newsresults out for the Santa Rosalia Sur target[for] two of the top targets we have at the property.
Maurice Jackson: Dr. Staude, before we leave the Los Cuarentes gold project, what can you share with us regarding the genetic model?
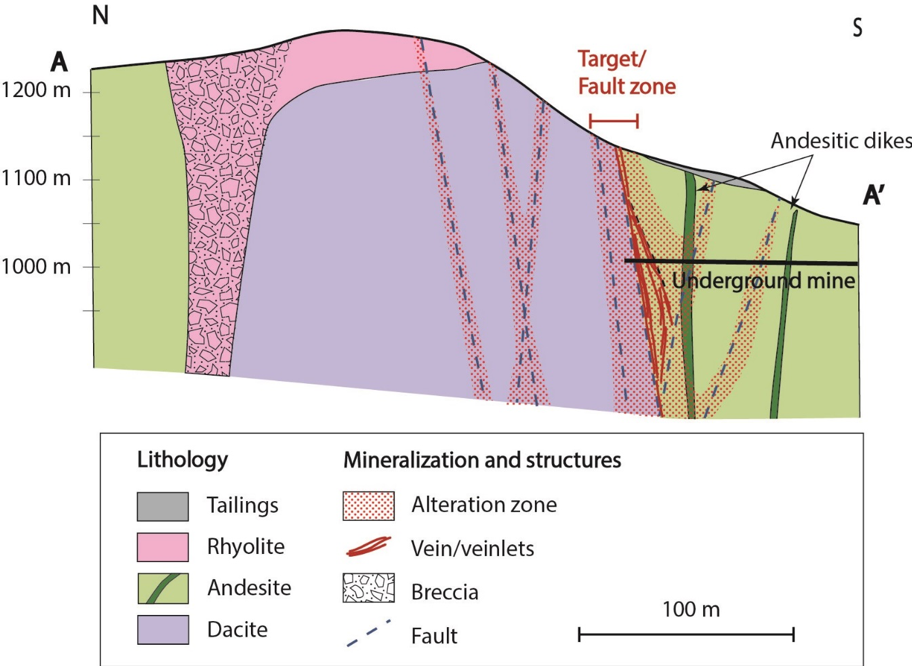
John-Mark S.: The genetic model really fits for a dome complex. Here we see the dome breccia epithermal low sulfidation vein systems, the veins following structures and sheers, and particularly the sheers around different fault zones,. . .typical of the upper levels of an epithermal gold system. We really like that type of model and the potential for this type of epithermal rhyolite complex.
Maurice Jackson: Switching gears, John-Mark, what is the next unanswered question for Riverside? When can we expect an answer, and what will determine success?
John-Mark S.: The next unanswered question at the Los Cuarentes project is how big, how deep, and how far this can go? We will now focus our efforts on mapping, and more sampling, and getting a drill permit. We’re very excited about the value proposition before us. Riverside could drill Los Cuarentas ourselves. We do have interest from other parties. We really like the results here, it’s a super good project.
What would determine success is more high-grade gram thicknesses. We have to the east of us Las Chispas, and to the west we have the Mercedes mine. Riverside believes we have the potential for a mine at the Los Cuarentas. That would really help us determine success.
Maurice Jackson: Before we close, John-Mark, please provide us with an update on the capital structure.
John-Mark S.: Riverside continues to have a tight share structure, with 63 million shares out, no debt, and over $3 million cash. We’re in a great financial situation and [have] a very focused share structure.
Maurice Jackson: Dr. Staude, for someone listening that wants to get more information on Riverside Resources, please share the contact details.
John-Mark S.: Please visit our website at www.rivres.com or phone us at (778) 327-6671.
Maurice Jackson: Before you make your next precious metals purchase, make sure you visit us at www.provenandprobable.com or call (855) 505.1900. We are licensed representatives for Miles Franklin Precious Metals Investments. Riverside Resources is a sponsor of Proven and Probable, and we are proud shareholders for the virtues conveyed in today’s message.
Dr. John-Mark Staude of Riverside Resources, thank you for joining us today on Proven and Probable.
Maurice Jackson is the founder of Proven and Probable, a site that aims to enrich its subscribers through education in precious metals and junior mining companies that will enrich the world.
Disclosure: 1) Maurice Jackson: I, or members of my immediate household or family, own shares of the following companies mentioned in this article: Riverside Resources and Millrock Resources. I personally am, or members of my immediate household or family are, paid by the following companies mentioned in this article: None. My company has a financial relationship with the following companies mentioned in this article: Riverside Resources and Millrock Resources are sponsors of Proven and Probable. Proven and Probable disclosures are listed below. 2) The following companies mentioned in this article are billboard sponsors of Streetwise Reports: None. Click here for important disclosures about sponsor fees. 3) Statements and opinions expressed are the opinions of the author and not of Streetwise Reports or its officers. The author is wholly responsible for the validity of the statements. The author was not paid by Streetwise Reports for this article. Streetwise Reports was not paid by the author to publish or syndicate this article. The information provided above is for informational purposes only and is not a recommendation to buy or sell any security. Streetwise Reports requires contributing authors to disclose any shareholdings in, or economic relationships with, companies that they write about. Streetwise Reports relies upon the authors to accurately provide this information and Streetwise Reports has no means of verifying its accuracy. 4) This article does not constitute investment advice. Each reader is encouraged to consult with his or her individual financial professional and any action a reader takes as a result of information presented here is his or her own responsibility. By opening this page, each reader accepts and agrees to Streetwise Reports’ terms of use and full legal disclaimer. This article is not a solicitation for investment. Streetwise Reports does not render general or specific investment advice and the information on Streetwise Reports should not be considered a recommendation to buy or sell any security. Streetwise Reports does not endorse or recommend the business, products, services or securities of any company mentioned on Streetwise Reports. 5) From time to time, Streetwise Reports LLC and its directors, officers, employees or members of their families, as well as persons interviewed for articles and interviews on the site, may have a long or short position in securities mentioned. Directors, officers, employees or members of their immediate families are prohibited from making purchases and/or sales of those securities in the open market or otherwise from the time of the interview or the decision to write an article until three business days after the publication of the interview or article. The foregoing prohibition does not apply to articles that in substance only restate previously published company releases. As of the date of this article, officers and/or employees of Streetwise Reports LLC (including members of their household) own shares of Riverside Resources and Millrock Resources, companies mentioned in this article.
Proven and Probable LLC receives financial compensation from its sponsors. The compensation is used is to fund both sponsor-specific activities and general report activities, website, and general and administrative costs. Sponsor-specific activities may include aggregating content and publishing that content on the Proven and Probable website, creating and maintaining company landing pages, interviewing key management, posting a banner/billboard, and/or issuing press releases. The fees also cover the costs for Proven and Probable to publish sector-specific information on our site, and also to create content by interviewing experts in the sector. Monthly sponsorship fees range from $1,000 to $4,000 per month. Proven and Probable LLC does accept stock for payment of sponsorship fees. Sponsor pages may be considered advertising for the purposes of 18 U.S.C. 1734.
The Information presented in Proven and Probable is provided for educational and informational purposes only, without any express or implied warranty of any kind, including warranties of accuracy, completeness, or fitness for any particular purpose. The Information contained in or provided from or through this forum is not intended to be and does not constitute financial advice, investment advice, trading advice or any other advice. The Information on this forum and provided from or through this forum is general in nature and is not specific to you the User or anyone else. You should not make any decision, financial, investments, trading or otherwise, based on any of the information presented on this forum without undertaking independent due diligence and consultation with a professional broker or competent financial advisor. You understand that you are using any and all Information available on or through this forum at your own risk.
Improving German economic expectations bullish for EURUSD
On 1-hour timeframe EURUSD: H1 is rising toward the 200-period moving average MA(200) which is falling itself. The RSI indicator has formed a bullish divergence.
We believe the bullish momentum will resume after the price breaches above the upper boundary of Donchian channel at 1.1094. A level above this can be used as an entry point for placing a pending order to buy. The stop loss can be placed below 1.1084. After placing the order, the stop loss is to be moved to the next fractal low, following Parabolic signals. Thus, we are changing the expected profit/loss ratio to the breakeven point. If the price meets the stop loss level without reaching the order, we recommend cancelling the order: the market has undergone internal changes which were not taken into account.
German economic expectations improved strongly in January and reached their highest level since 2015. Will the EURUSD start rising?
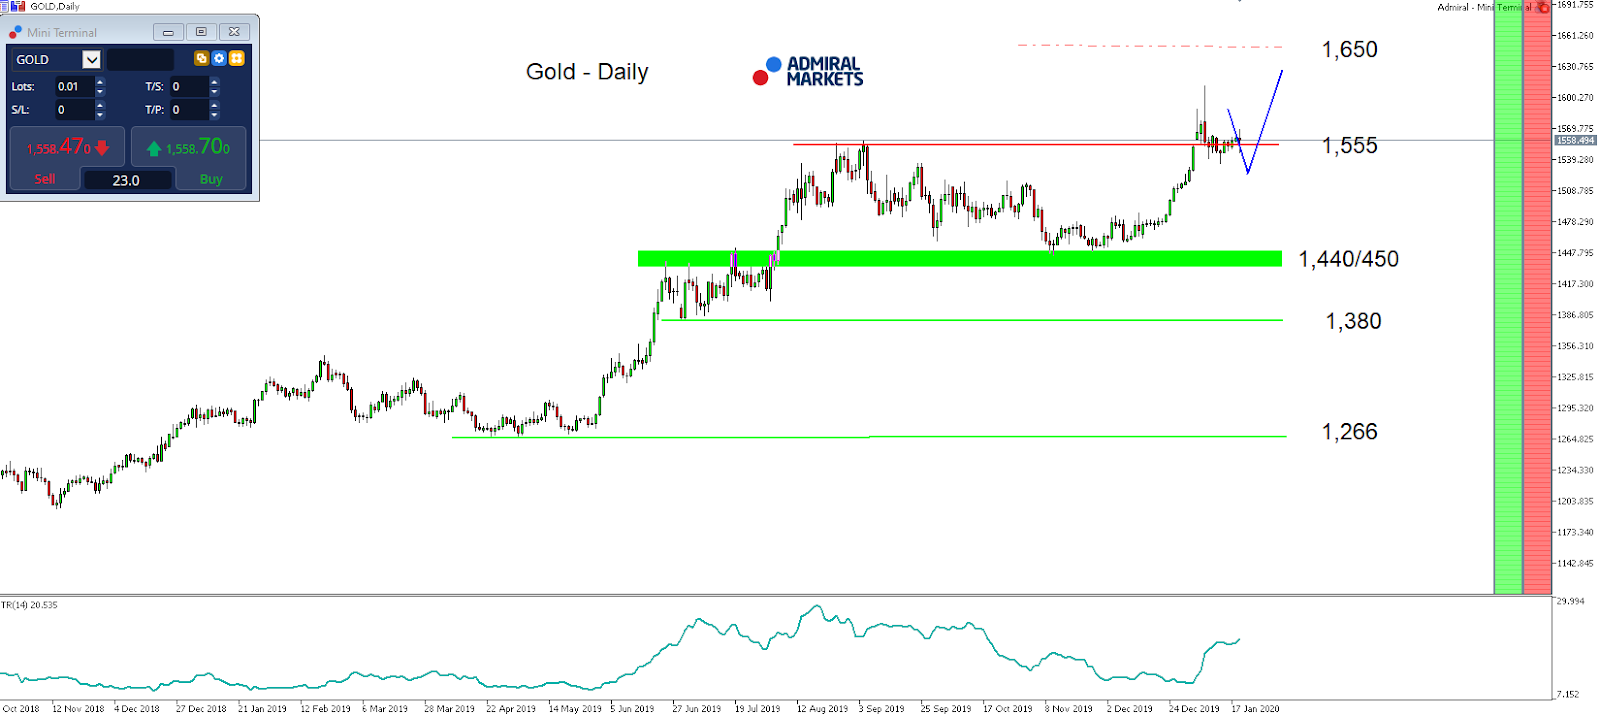
Over the past few days, Gold stabilised around the yearly highs of 1,550 USD. Chances therefore seem good that the precious metal will continue with its bullish trend in the days and weeks to come.
This is despite US inflation coming in at 2.3% year-on-year in December 2019 (its highest level since October 2018), and the latest Housing Starts numbers also coming in at their highest level since December 2006. If today’s Existing Home Sales do not follow the positive tendency of the Housing Starts, Gold could see the beginning of another push up to 1,600 USD.
This bias is also supported by Gold being about to enter another bullish seasonal window on Friday. After Silver, which is highly positive correlated to Gold, entered a bullish seasonal window last week on Monday, Gold enters one between the January 24 and February 4.
The seasonal bullish pattern developed over the last 20 years with Gold seeing an average gain of 23.50 USD for 15 of the past 20 years. In the remaining five years, it dropped on average only 11.73 USD, while the maximum loss of the pattern was 23.90 USD and the maximum drawdown being 26.05 USD.
Technically, Gold stays bullish on a daily time frame as long as we trade above 1,440/450 USD, with the potential next target on the upside being found in the region around 1,650/700 USD.
Source: Admiral Markets MT5 with MT5SE Add-on Gold Daily chart (between 19 October 2018 to 21 January 2020). Accessed: 21 January 2020 at 10:00 PM GMT
Please note: Past performance is not a reliable indicator of future results, or future performance.
In 2015, the value of Gold fell by 10.4%, in 2016 it increased by 8.1%, in 2017 it increased by 13.1%, in 2018, it fell by 1.6%, in 2019, it increased by 18.9%, meaning that after five years, it was up by 28%.
Disclaimer: The given data provides additional information regarding all analysis, estimates, prognosis, forecasts or other similar assessments or information (hereinafter “Analysis”) published on the website of Admiral Markets. Before making any investment decisions please pay close attention to the following:
This is a marketing communication. The analysis is published for informative purposes only and are in no way to be construed as investment advice or recommendation. It has not been prepared in accordance with legal requirements designed to promote the independence of investment research, and that it is not subject to any prohibition on dealing ahead of the dissemination of investment research.
Any investment decision is made by each client alone whereas Admiral Markets shall not be responsible for any loss or damage arising from any such decision, whether or not based on the Analysis.
Each of the Analysis is prepared by an independent analyst (Jens Klatt, Professional Trader and Analyst, hereinafter “Author”) based on the Author’s personal estimations.
To ensure that the interests of the clients would be protected and objectivity of the Analysis would not be damaged Admiral Markets has established relevant internal procedures for prevention and management of conflicts of interest.
Whilst every reasonable effort is taken to ensure that all sources of the Analysis are reliable and that all information is presented, as much as possible, in an understandable, timely, precise and complete manner, Admiral Markets does not guarantee the accuracy or completeness of any information contained within the Analysis. The presented figures refer that refer to any past performance is not a reliable indicator of future results.
The contents of the Analysis should not be construed as an express or implied promise, guarantee or implication by Admiral Markets that the client shall profit from the strategies therein or that losses in connection therewith may or shall be limited.
Any kind of previous or modeled performance of financial instruments indicated within the Publication should not be construed as an express or implied promise, guarantee or implication by Admiral Markets for any future performance. The value of the financial instrument may both increase and decrease and the preservation of the asset value is not guaranteed.
The projections included in the Analysis may be subject to additional fees, taxes or other charges, depending on the subject of the Publication. The price list applicable to the services provided by Admiral Markets is publicly available from the website of Admiral Markets.
Leveraged products (including contracts for difference) are speculative in nature and may result in losses or profit. Before you start trading, you should make sure that you understand all the risks.
On Tuesday, January 21, the euro was down at close. By the end of trading, the euro lost all the profits it had gained from the release of favourable European data. A sharp reversal could be caused by increased demand for defensive assets and a general decline in global stock indexes.
Indexes fell on the back of the news concerning the discovery of a new deadly virus in China, from which nine people have already died. According to the latest data from 13 Chinese provinces, 440 cases of viral infection have been detected. Cases have also been identified in South Korea, Thailand, Japan and the United States.
The current situation has made investors recall the years 2002-2003, when a pandemic killed almost 800 people. According to WHO, the number of victims of the Ebola virus amounted to more than 21,086, with several thousand people dying as a result of the infection. We do not remember markets reacting like this to viruses. There can only be one answer here, someone wants to receive a large order for the creation of a vaccine.
16:30 Canada: BoC Consumer Price Index Core (YoY) (Dec).
17:00 USA: Housing Price Index (MoM) (Nov).
18:00 Canada: BoC Interest Rate Decision, Bank of Canada Monetary Policy Report.
18:00 USA: Existing Home Sales (MoM) (Dec)
19:15 Canada: BoC Press Conference.
Current situation:
Yesterday, bulls did not reach the calculated target – the ambient background being a stronger reason than technical factors. At the time of writing, the euro is worth 1.1077. Bears have been strengthening their position since the Asian session. Today we have one scenario – a price recovery to the balance line (lB is now at 1.1092). If the price leaves the channel, then the 1.1066 level (at the 90th degree) should be kept as a target. We believe this price model to be unsuccessful for the continuation of the fall of the EURUSD pair.
Our recent research suggests the US stock market may be entering a period of volatility that may include a broad market rotation/reversion event. We believe this volatility event could begin to happen anytime over the next 10 to 30+ days. The rally in the US stock market ending 2019 and carrying into 2020 appears to be setting up a “rally to a peak” type of price pattern. Please take a minute to review the following articles we’ve posted recently about this topic and how it relates to opportunities in Metals/Miners.
The potential for a volatility spike resulting from a price peak formation (see the January 20, 2020 article above), could setup a moderately broad downside price reversion event that may prompt a 5% to 8%+ downside price correction. If that happens, as we expect, over the next 5 to 10+ trading days, then precious metals and miners should explode to the upside as a “risk-on” trade moves capital into the metals market.
We believe the Miners (both Gold and Silver) are setting up for an explosive upside price move over the next 60+ days. The reality of the global markets is that it appears to be setting up in a very similar manner to what happened in the late 1990s. The rally in Rhodium, Palladium and Platinum are similar to the rally that took place in the late 1990s – just before the real explosion in Gold and Silver began in 2003-04. The rally in Gold and Silver took place after a collapse event in 2000-2001 and setup a massive upside price event for Precious Metals and Miners. You can read more of our research below.
If we start with the shortest time frame analysis of the gold miners you can see a lot of measured moves based on technical analysis that has taken place in the last month of trading and it’s not far from over based on this chart.
Daily GDXJ Chart
The setup in GDXJ is that Junior Gold Miners should move 15% to 25% higher over the next 30+ days on a price reversion event in the US stock market. We believe the upside target for GDXJ is $46 to $51 from the current levels near $41.50. After a brief pause near $50, GDXJ should attempt another rally to levels above $65 to $70 sometime near June~August 2020.
Weekly GDXJ Chart
This Weekly GDXJ chart highlights what we believe will happen over the next 6+ months. The opportunity for skilled traders at this level is incredible. Support near $35.50 has recently been retested and held. Any entry below the $40 level is an incredible opportunity to catch this upside price move.
Concluding Thoughts:
We believe the US stock market will enter a period of volatility over the next 30~60+ days and that volatility will push metals and miners higher into this next wave of advancement. Be prepared for Silver and Silver Miners to rally more than Gold/Gold Miners (potentially). We’ve highlighted how Silver tends to rally a few months behind Gold when a Risk-On trade sets up.
As a technical analysis and trader since 1997 I have been through a few bull/bear market cycles, I have a good pulse on the market and timing key turning points for both short-term swing trading and long-term investment capital. The opportunities are massive/life-changing if handled properly.
2020 is going to be full of incredible trading opportunities for skilled traders. We’ve already set up a number of active trading triggers for our members to profit from the early moves in 2020. This Gold Miners trade is an incredible opportunity for anyone skilled enough to take advantage of it. Visit Technical Traders Ltd. to learn how we can help you find and execute better trades in 2020.
Join my Wealth Building Newsletter if you like what you read here and ride my coattails as I navigate these financial markets and build wealth while others lose nearly everything they own.