Article By RoboForex.com
GBPUSD, “Great Britain Pound vs US Dollar”
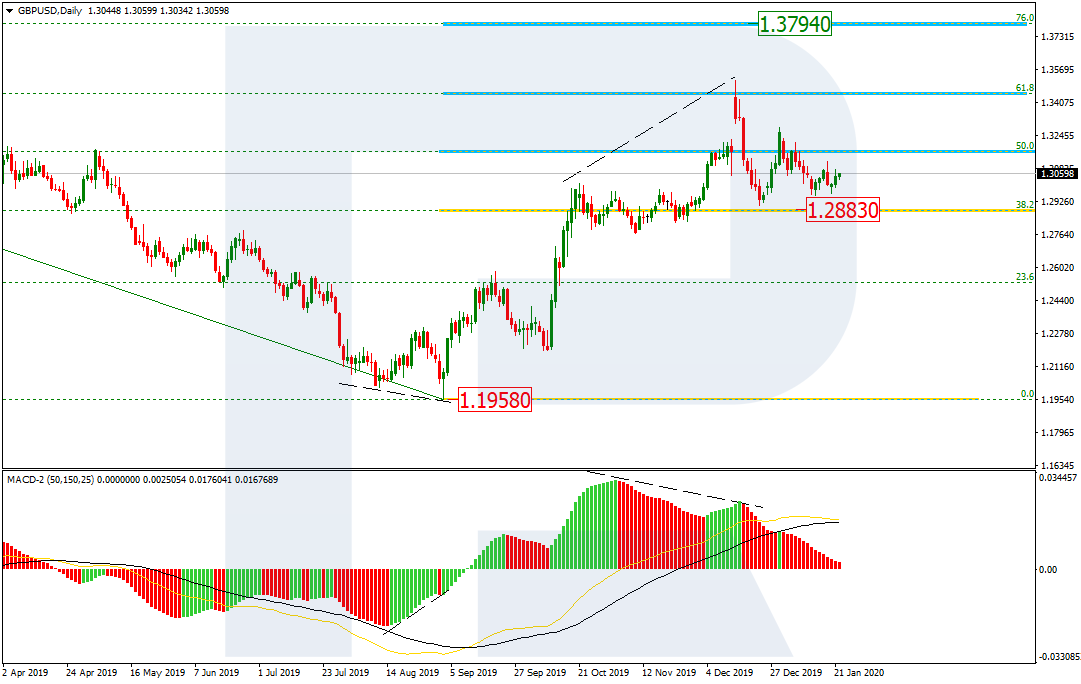
As we can see in the daily chart, GBPUSD is still correcting and forming Triangle pattern. The pair is stuck above the support at 38.2% (1.2883). If the price fails to break this level, it may start a new rising impulse to break the high at and reach mid-term 76.0% fibo at 1.3794.

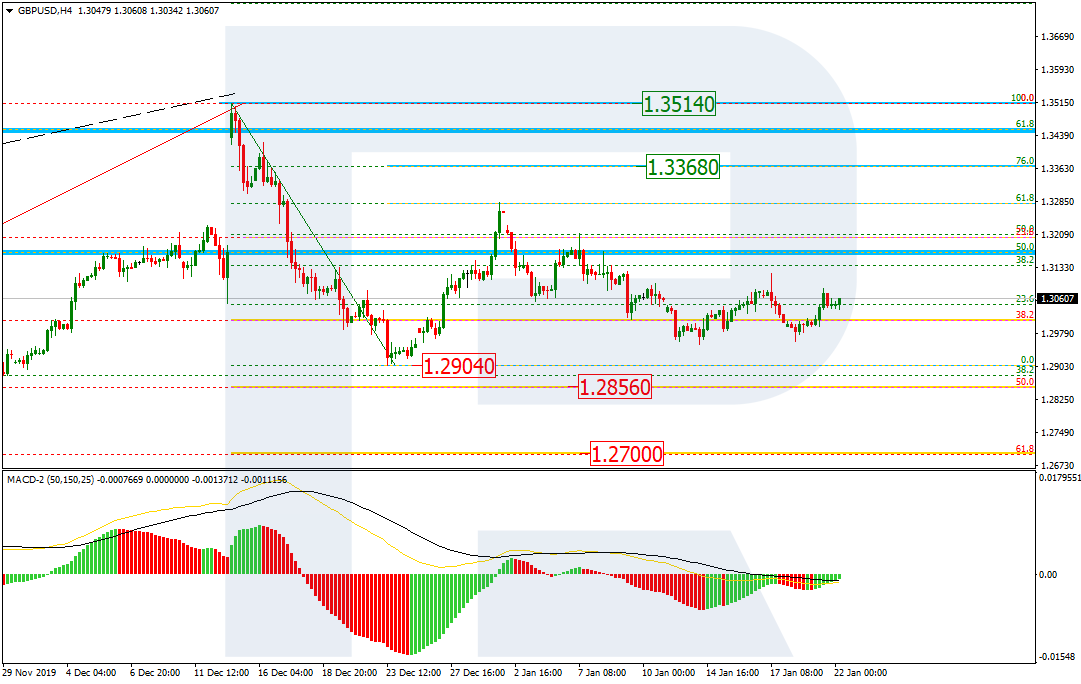
The H4 chart shows that the correction has stopped at 38.2% fibo. If the price breaks the local low at 1.2904, the pair may continue falling towards 50.0% and 61.8% fibo at 1.2856 and 1.2700 respectively.
EURJPY, “Euro vs. Japanese Yen”
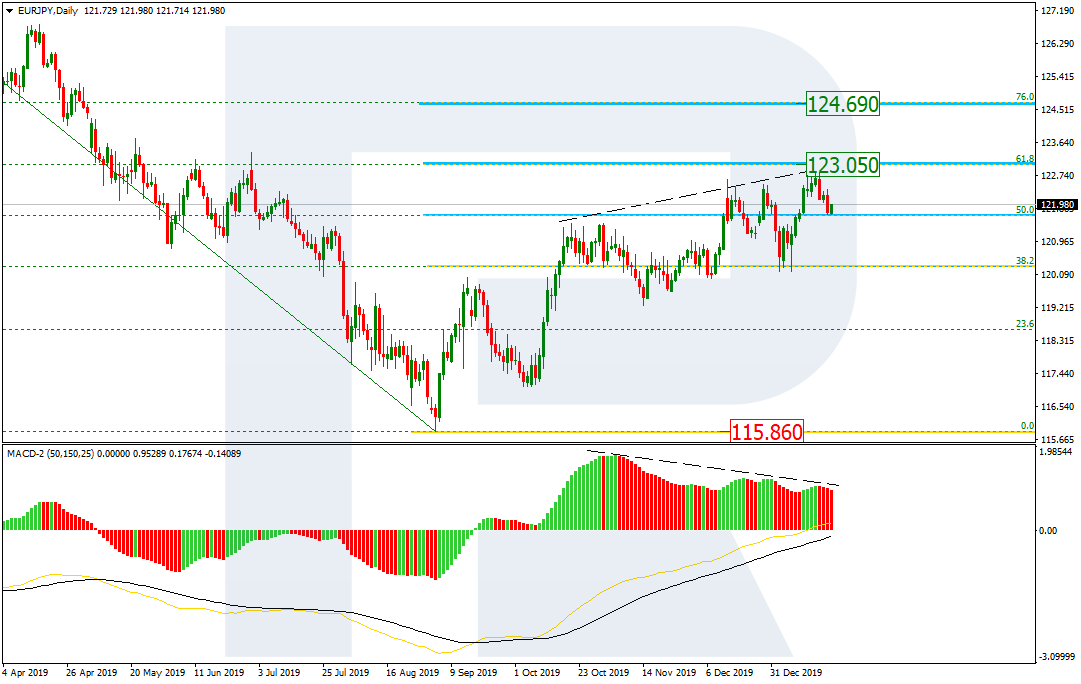
In the daily chart, after updating the previous high and failing to reach 61.8% fibo at 123.05, the pair has started a new pullback towards 50.0% fibo. Despite the divergence on MACD, it’s too early to think about the trend reverse, at least as long as EURJPY is trading above the support. It means that this decline should be considered as a new short-term correction, which may be followed by further growth towards 61.8% and 76.0% fibo at 123.05 and 124.69 respectively.
Free Reports:
 Get Our Free Metatrader 4 Indicators - Put Our Free MetaTrader 4 Custom Indicators on your charts when you join our Weekly Newsletter
 Get our Weekly Commitment of Traders Reports - See where the biggest traders (Hedge Funds and Commercial Hedgers) are positioned in the futures markets on a weekly basis.
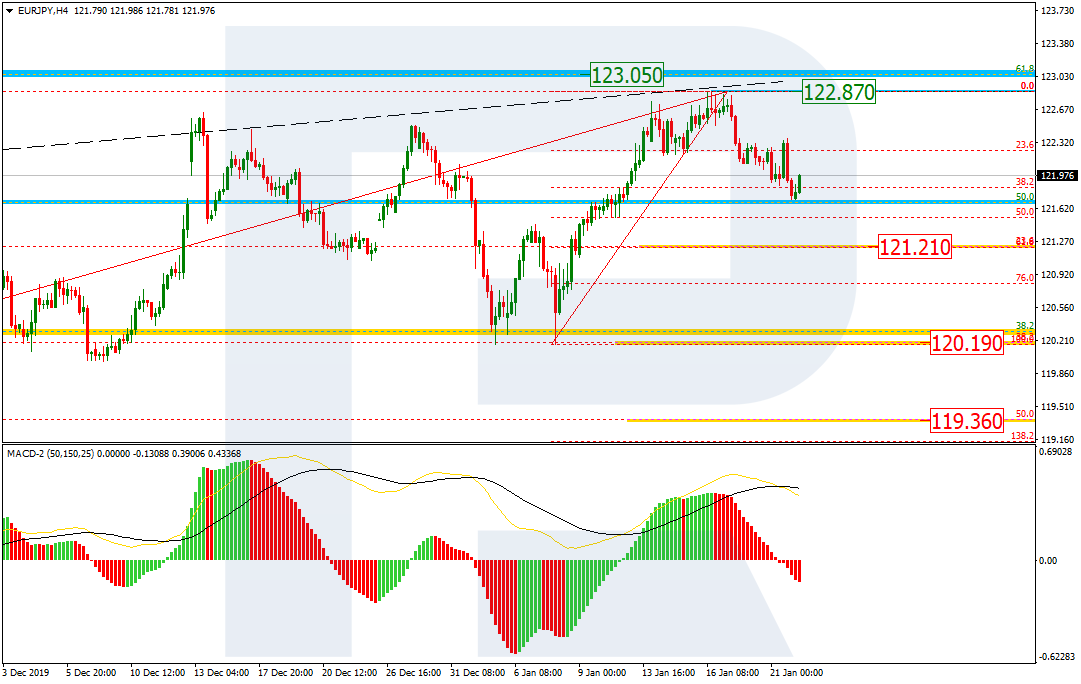
The H4 chart shows that the pair is moving downwards to reach 38.2%. However, if the price falls towards 23.6% fibo at 121.21, the decline may continue to reach 38.2% and 50.0% fibo at 120.19 and 119.36 respectively. If the price breaks the resistance at 122.87, the mid-term growth will continue.
Article By RoboForex.com
Attention!
Forecasts presented in this section only reflect the author’s private opinion and should not be considered as guidance for trading. RoboForex LP bears no responsibility for trading results based on trading recommendations described in these analytical reviews.