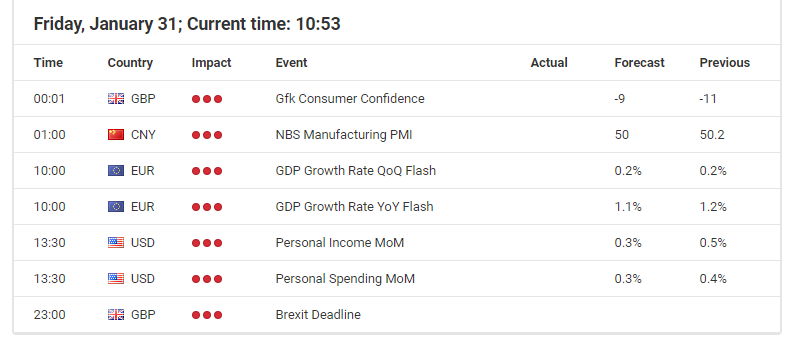
The Fed rate decision on Wednesday this week couldn’t brighten the picture for the USD/JPY after its recent significant drop back below 110.00.
While nothing new came last Wednesday, paired with the rising expectations among market participants of a dovish Fed in the future who expect, with a likelihood of over 80%, rate cuts at least once by 25 basis points, this should keep the pressure on US yields and thus fuel our expectation of USD/JPY seeing a further drop, finding a potential first target around 107.80/108.00.
That said, any disappointment in today’s data around the Personal Income and Personal Spending, resulting pressure on US yields could thus result in a bearish weekly close in the currency pair with the main focus lying on the region around 107.80/108.00.
In addition to that, USD/JPY traders should keep a close eye on any new developments on the Coronavirus which result in another wave of short-term risk-off hitting financial markets, driving US yields lower and thus USD/JPY lower, too.
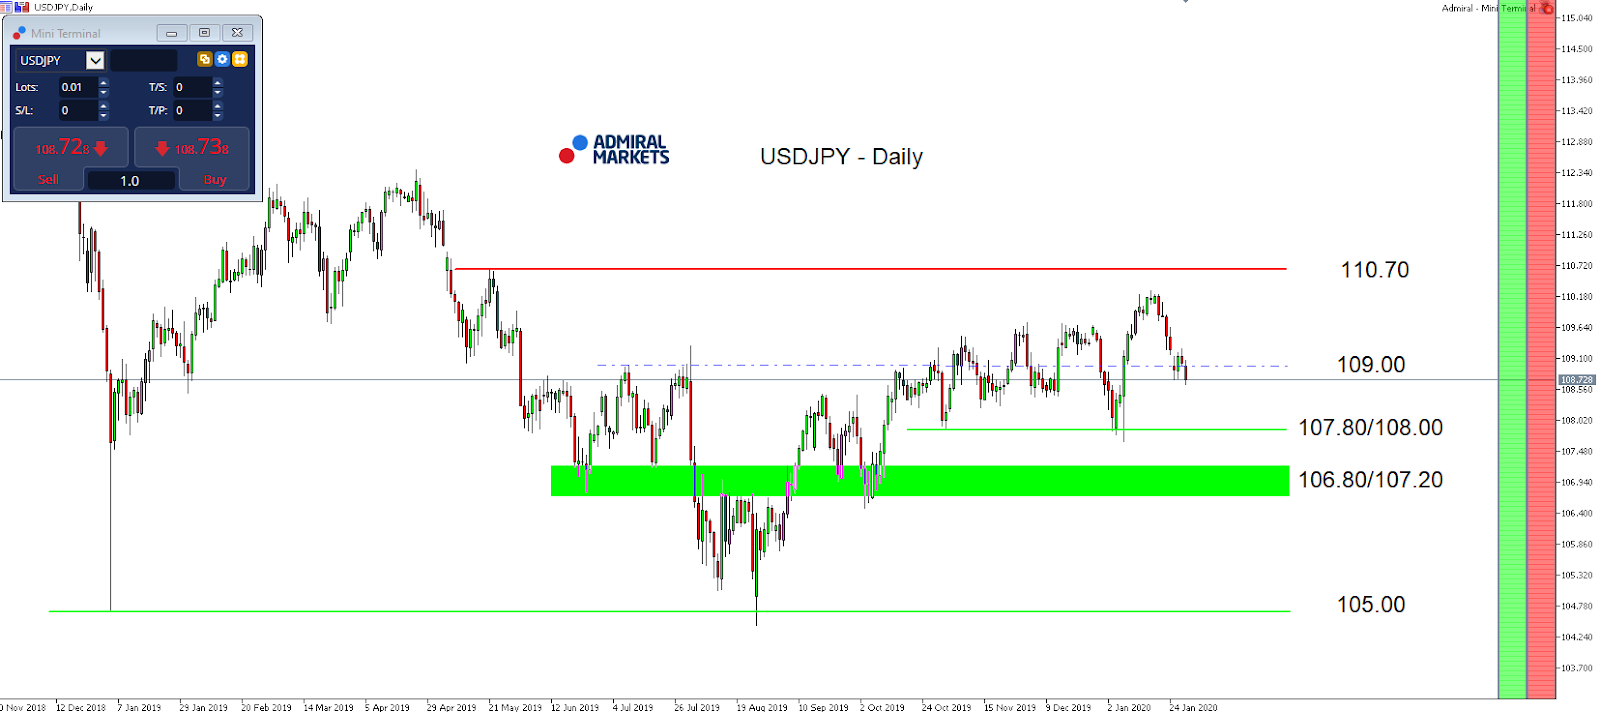
Technically the region around 107.80/108.00 is activated if we get to see a drop below 108.50 while above the mode stay choppy with a neutral tendency, leaving chances of a near-term test of the region around 110.30 on the table:
Source: Admiral Markets MT5 with MT5-SE Add-on USD/JPY Daily chart (between November 20, 2018, to January 30, 2020). Accessed: January 30, 2020, at 10:00pm GMT – Please note: Past performance is not a reliable indicator of future results, or future performance.
In 2015, the value of USD/JPY increased by 0.5%, in 2016, it fell by 2.8%, in 2017, it fell by 3.6%, in 2018, it fell by 2.7%, in 2019, it fell by 0.85%, meaning that after five years, it was down by 9.2%.
Discover the world’s #1 multi-asset platform
Admiral Markets offers professional traders the ability to trade with a custom, upgraded version of MetaTrader 5, allowing you to experience trading at a significantly higher, more rewarding level. Experience benefits such as the addition of the Market Heat Map, so you can compare various currency pairs to see which ones might be lucrative investments, access real-time trading data, and so much more. Click the banner below to start your FREE download of MT5 Supreme Edition!
Disclaimer: The given data provides additional information regarding all analysis, estimates, prognosis, forecasts or other similar assessments or information (hereinafter “Analysis”) published on the website of Admiral Markets. Before making any investment decisions please pay close attention to the following:
This is a marketing communication. The analysis is published for informative purposes only and are in no way to be construed as investment advice or recommendation. It has not been prepared in accordance with legal requirements designed to promote the independence of investment research, and that it is not subject to any prohibition on dealing ahead of the dissemination of investment research.
Any investment decision is made by each client alone whereas Admiral Markets shall not be responsible for any loss or damage arising from any such decision, whether or not based on the Analysis.
Each of the Analysis is prepared by an independent analyst (Jens Klatt, Professional Trader and Analyst, hereinafter “Author”) based on the Author’s personal estimations.
To ensure that the interests of the clients would be protected and objectivity of the Analysis would not be damaged Admiral Markets has established relevant internal procedures for prevention and management of conflicts of interest.
Whilst every reasonable effort is taken to ensure that all sources of the Analysis are reliable and that all information is presented, as much as possible, in an understandable, timely, precise and complete manner, Admiral Markets does not guarantee the accuracy or completeness of any information contained within the Analysis. The presented figures refer that refer to any past performance is not a reliable indicator of future results.
The contents of the Analysis should not be construed as an express or implied promise, guarantee or implication by Admiral Markets that the client shall profit from the strategies therein or that losses in connection therewith may or shall be limited.
Any kind of previous or modeled performance of financial instruments indicated within the Publication should not be construed as an express or implied promise, guarantee or implication by Admiral Markets for any future performance. The value of the financial instrument may both increase and decrease and the preservation of the asset value is not guaranteed.
The projections included in the Analysis may be subject to additional fees, taxes or other charges, depending on the subject of the Publication. The price list applicable to the services provided by Admiral Markets is publicly available from the website of Admiral Markets.
Leveraged products (including contracts for difference) are speculative in nature and may result in losses or profit. Before you start trading, you should make sure that you understand all the risks.
On Thursday, January 30, the euro was up at the close of trading. In the American session, the rate rose to 1.1039. This was down to the strengthening of the British pound against the US dollar, a reaction to announcements made by the Bank of England concerning interest rates.
The decided to keep the basic rate at 0.75% per annum and maintain the current duration of the government bond purchase program. It had been expected that three members of the Monetary Policy Committee would vote for the rate to be cut, in fact only two voted for a cut. Also, interest rate futures showed a probability of a 25bp decrease, which did not happen. Bank of England Governor Mark Carney said the rate cut many investors predicted would increase inflation above a key level. The regulator’s report notes that after the December parliamentary elections, there has been an acceleration in economic growth.
Q4 GDP coincided with market expectations. Investors were disappointed that the US economy showed sluggish annual growth. After the Bank of England meeting, the report had a mild impact on the foreign exchange market.
Today’s news (GMT+3):
09:30 France: Gross Domestic Product (QoQ) (Q4).
10:30 Switzerland: Real Retail Sales (YoY) (Dec).
12:30 UK: Net Lending to Individuals (MoM) (Dec), Mortgage Approvals (Dec).
16:30 USA: Core Personal Consumption Expenditure – Price Index (MoM) (Dec), Personal Spending (Dec), Personal Income (MoM) (Dec).
17:45 USA: Chicago Purchasing Managers’ Index (Jan), Michigan Consumer Sentiment Index (Jan).
21:00 USA: Baker Hughes US Oil Rig Count.
Current situation:
Expectations for yesterday’s movement were fully justified. The price technically recovered to the trend line (1.1039), from which it returned to the 1.1017 mark. The pullback amounted to 50% of the growth from 1.0992 to 1.1039. The 50-percent level was strengthened by the balance line. At the time of writing, the euro is worth 1.1023. Technically, continued growth should be considered, however today is Friday, and given the difficult situation in China, pressure on the euro may increase. According to the latest data published by the Ministry of Health of the People’s Republic of China, the number of people infected with viral pneumonia has reached 9,776 people (+25.6%). The number of deaths from the disease rose to 213 (+25.2%).
At an emergency meeting, the World Health Organization (WHO) recognized the novel coronavirus as a international emergency. Many airlines around the world decided to partially cancel flights to China.
The background news isn’t helpful for the single currency, but according to technical analysis, growth should be considered. Since the stochastic is in the oversell (buy) zone, according to the forecast, we can expect growth to the trend line, before seeing a decline back down to 1.1008 in the US session.
It is not known how market participants will react to the publication of the Eurozone Q4 GDP data and Consumer Price Index for January, which will be released at 13:00 Moscow time. Both will have a strong impact on the market.
Asian stocks are set to break a run of six consecutive days of declines, while most regional currencies are about to end the month on a positive note against the US Dollar, having been buffeted by coronavirus outbreak concerns in recent weeks. China’s better-than-expected expansion in its January non-manufacturing PMI, along with the concerted efforts by the authorities to contain the viral outbreak, could help push back against some of the fears surrounding the epidemic’s impact on the world’s second largest economy, which is likely to be short-lived.
However, considering the expected pullback in production, dampened retail activities, as well as travel restrictions, the cautionary mood over the economic outlook appears warranted for the time being. Recent gains in riskier assets could prove fleeting, and investors would do well to remain vigilant in light of this epidemic. With the World Health Organization having declared this outbreak a global health emergency, along with headlines about the rising death toll and more confirmed cases around the world, riskier assets across Asia and in the emerging-markets universe are expected to maintain their bias to the downside for the near-term.
GBPUSD surges after BOE refrains from rate cut
The Pound is now testing the 1.31 resistance level against the US Dollar, after the Bank of England chose to keep its benchmark interest rate at 0.75 percent at Mark Carney’s final rate decision as BOE Governor. Policymakers shattered expectations of a rate cut, having apparently been given enough justification to stand pat from the recovery seen in the economic data, including PMI prints and rising business sentiment.
Following the BOE’s latest decision, markets are now expecting UK interest rates to be maintained at the current level at least through the first quarter. Such expectations may serve as a steadier platform for the Pound to explore more of its upside against the US Dollar, aided by further signs of a turnaround in the UK economy and the diminished Brexit risks over the near-term.
Disclaimer: The content in this article comprises personal opinions and should not be construed as containing personal and/or other investment advice and/or an offer of and/or solicitation for any transactions in financial instruments and/or a guarantee and/or prediction of future performance. ForexTime (FXTM), its affiliates, agents, directors, officers or employees do not guarantee the accuracy, validity, timeliness or completeness, of any information or data made available and assume no liability as to any loss arising from any investment based on the same.
US stock market recovered on Thursday as positive corporate reports offset concerns over coronavirus infection in China. The S&P 500 gained 0.3% to 3283.66. The Dow Jones industrial average rose 0.4% to 28859.44. Nasdaq composite index added 0.3% to 9298.93. The dollar strengthening halted despite report US gross domestic product grew at stead 2.1% annualized pace in the fourth quarter and the number of people applying for first time jobless benefits fell by 7,000 to 216,000 last week: live dollar index data show the ICE US Dollar index, a measure of the dollar’s strength against a basket of six rival currencies, lostg 0.2% to 97.86 but is higher currently. Futures on stock indexes point to mixed openings today.
European indexes retreated in lockstep
European stocks pulled back on Thursday. Both the GBP/USD and EUR/USD reversed their sliding yesterday with euro turning lower while Pound higher currently still. The Stoxx Europe 600 index declined 1% led by energy shares. Germany’s DAX 30 fell 1.4% to 13157.12. France’s CAC 40 lost 1.4% while UK’s FTSE 100 slumped 1.4% to 7381.96 as the Bank of England kept the base rate at 0.75%.
Nikkei ahead of Asian indexes
Asian stock indices are mixed today after the World Health Organization declared the outbreak to be a global health emergency. Nikkei ended up 1% at 23205.18 with yen resuming its decline against dollar. Markets in mainland China are closed for extended Lunar New Year holidays. Hong Kong’s Hang Seng Index is 0.1% lower despite report China’s official nonmanufacturing PMI edged up. Australia’s All Ordinaries Index recovered 0.1% as Australian dollar decline against the greenback continued.
Brent futures prices are extending losses today. Prices ended lower yesterday: March Brent crude lost 2.5% to $58.29 a barrel on Thursday. Saudi Aramco shares closed 0.7% lower Thursday at 34.15 riyals in Riyadh at Tadawul exchange. Yesterday a Saudi oil official said Yemen’s Houthi rebels launched a missile attack on Saudi Aramco, but all projectiles were intercepted before they could hit their target in the southern Jazan region. No date was specified for the attack.
Gold retreats
Gold prices are retracing today. Prices rose yesterday: February gold added 0.8% to $1589.20 an ounce on Thursday.
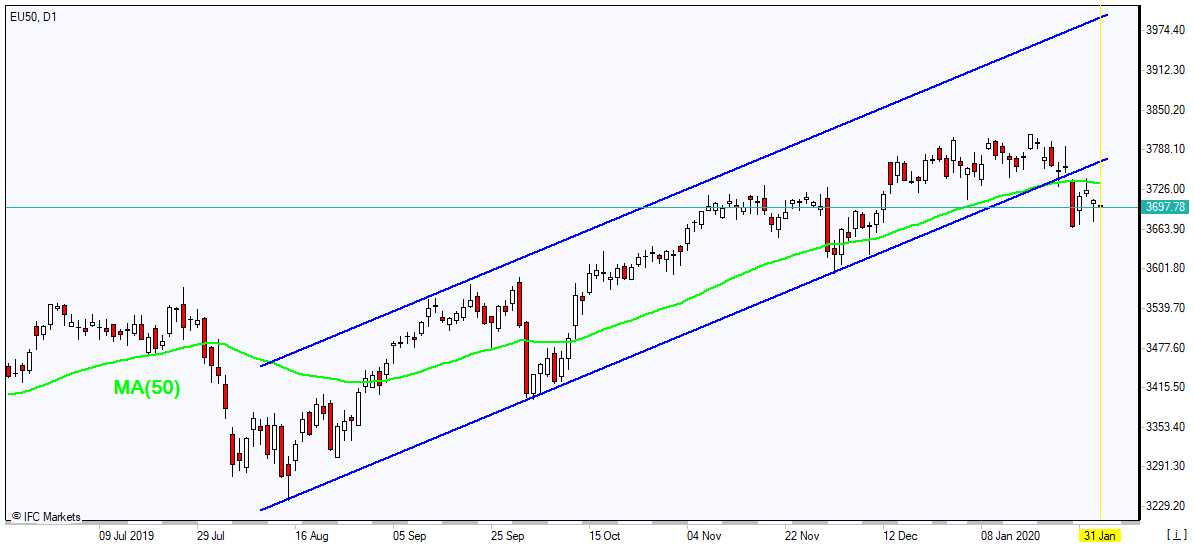
Note: This overview has an informative and tutorial character and is published for free. All the data, included in the overview, are received from public sources, recognized as more or less reliable. Moreover, there is no guarantee that the indicated information is full and precise. Overviews are not updated. The whole information in each overview, including opinion, indicators, charts and anything else, is provided only for familiarization purposes and is not financial advice or а recommendation. The whole text and its any part, as well as the charts cannot be considered as an offer to make a deal with any asset. IFC Markets and its employees under any circumstances are not liable for any action taken by someone else during or after reading the overview.
Following up on some of our recent metals research, we wanted to alert our friends and followers to the incredible opportunity that still exists in Silver. We’ve highlighted two of our more recent articles for reference and review, below. Silver continues to be one of the most incredible opportunities for 2020 and Silver Miners (SIL) could explode to the upside as the price of Silver rallies to close the gap between the Gold to Silver ratio.
Our researchers believe Silver is currently undervalued, compared to Gold, by at least 240%. Historically, the Gold to Silver ratio averages a 10+ year rotational range of between 63 to 67. This means that through both peaks and troughs, ranging from the high 80s to mid-90s to the low 30s to mid-40s, on average the middle price range level for this ratio is near 65. Currently, this Gold to Silver ratio is 88.4.
Gold is currently trading at $1590 – just below the recent peak near $1613. We believe that Gold will continue to rally higher, breaking the $1613 level, and continue higher targeting the $1750 level over the next few months. Eventually, within 2020, we believe Gold will continue to rally higher breaking the $2100 price level.
This continued upside price action in Gold, while Silver has really yet to see any massive upside price movement, continues to create a massive price disparity between Gold and Silver – which is highlighted in the Gold to Silver ratio. As Gold rallies, Silver must begin to move dramatically higher in order to close this price disparity between the value of Gold to Silver. Historically, we believe the rally in Silver will force the Gold to Silver Ratio to fall to near the 65 level. This would represent a massive 70% to 120%+ rally in the price of silver – targeting $24.50 to 32.50.
Gold and Silver Ratio Weekly Chart
If the Gold to Silver Ratio falls below the 65 level and targets lower ratios, as has happened in the past, then Silver may rally as high as $45 to $55 per ounce while Gold stays below $1800. If Gold does rally above $2000, as we expect, the true potential for Silver experiencing a major price reversion event could be as high as $60+ per ounce.
Please take a minute to read some of our previous research posts regarding the metals markets here:
This Daily Silver chart highlights what we believe will be the next move higher in Silver. The next upside price advance should target the $21 to $23 level as Silver attempts to revalue compared to the price of Gold. Near this $23 level, Silver should stall briefly before attempting to move much higher. The reality is that once this revaluation event begins to take place in Silver, we believe it will prompt an extended price rally that could last well into 2023-2024.
Price of Silver Weekly Chart
This Weekly Silver chart highlights our research team’s expectations related to Silver over the next 6+ months. At first, we believe the $21 to $23 level will become the target. Then, a short period of price rotation will find support near $21 before another upside price leg pushes silver above $24. Remember, if Gold continues to rally higher, these expectations could extend 5% to 10% in size and scale.
Silver Miners Sector ETF – Weekly Chart
Another key component of this move is the opportunity in Silver Miners. This SIL Weekly chart highlights the real potential for a 20% to 30% upside price rally related to the expected price revaluation/reversion event we have been describing for Silver. Miners are an excellent correlative component for skilled traders expecting a move like this in the metals market.
Learn how we can help you find and execute better trades and turn the extreme volatility into solid profits. Read our research and see what our research team has been predicting over the past few months. We dedicate our efforts to helping you find great trades and helping you protect your assets.
oin my ETF Trade Alert Newsletter – Wealth Building Newsletter if you like what you read here and ride my coattails as I navigate these financial markets and build wealth while others lose nearly everything they own.
NOTICE: Our free research does not constitute a trade recommendation or solicitation for our readers to take any action regarding this research. It is provided for educational purposes only. Our research team produces these research articles to share information with our followers/readers in an effort to try to keep you well informed. Visit our web site to learn how to take advantage of our members-only research and trading signals.
The week will be closing with some really interesting data. So interesting, in fact, that it’s likely to get the undivided attention of the markets for several reasons.
China is on holiday for the duration of the week, so the normal flow of market information is interrupted. So, with Chinese markets closed, the reaction to data is unconventional.
The official measure of PMI is the only bit of data that we will be getting during the Lunar New Year holiday.
Its primary effect on markets will likely be overseas, affecting the AUD, NZD, and JPY primarily.
Old news at this point?
The spread of coronavirus has thrown a wrench into the normal evaluation of data coming out of China.
The official and Caixin PMI surveys were carried out just as the virus was hitting the news. But, at the time, the scale of it was uncertain. Therefore, it’s likely that the PMIs don’t have the effect of the virus included in the results.
Despite the holidays, a lot has happened in China in the days following the completion of the PMI survey.
New travel restrictions have been put into place that are likely to impact manufacturing production. In addition, the government has announced more stimulus measures.
We also expect further cuts to the Reserve Requirements Ratio (the “triple R”) to be announced at any moment.
What We Are Looking For
The circumstances are likely to make the data even more market-moving this time around.
However, we have to understand it in the context in which it was collected: as mass media coverage of the coronavirus took off, and just before the start of the Lunar New Year.
Expectations are for manufacturing PMI to stay just barely in growth territory, expanding to 50.5 from 50.2 prior.
This would be the third consecutive month in expansion. However, it would still be somewhat lackluster given that it comes after the signing of the Phase One deal. It also shows that the manufacturing sector has little space to handle the potential effects of prolonged shutdowns to deal with the virus outbreak.
Expectations are for Services PMI to stay flat at 53.5. The domestic market in China has remained largely resilient during the trade war. Therefore, we weren’t expecting it to show much of a rebound following the trade deal.
However, with the travel restrictions being implemented in China, it’s the sector most likely to be affected by the virus. In turn, it could have an impact on New Zealand, which primarily exports consumer goods to China.
On Monday we get the release of the Caixin Manufacturing PMI. We can expect this to expand just slightly to 51.6 from 51.5 prior. It too was showing a rebound after reaching a trade deal. The broader range of smaller companies measured by Caixin had more agility to take advantage of the changing situation.
However, it also has a higher number of consumer-oriented companies. This means the virus outbreak could impact Caixin more than the NBS going forward.
It’s Still Uncertain
Many experts have said that next week will be critical to see whether authorities manage to get a handle on the virus. Companies can then make a more accurate calibration of the effects it will have on production.
From there, it will be easier to have a clearer view of how much imports from commodities exporters will be affected, and therefore the impact on their currencies.
However, the markets hate uncertainty. So, they are likely to overprice potential risks, meaning that even if there is a blow-out result in PMIs, traders might not be willing to get too enthusiastic about it.
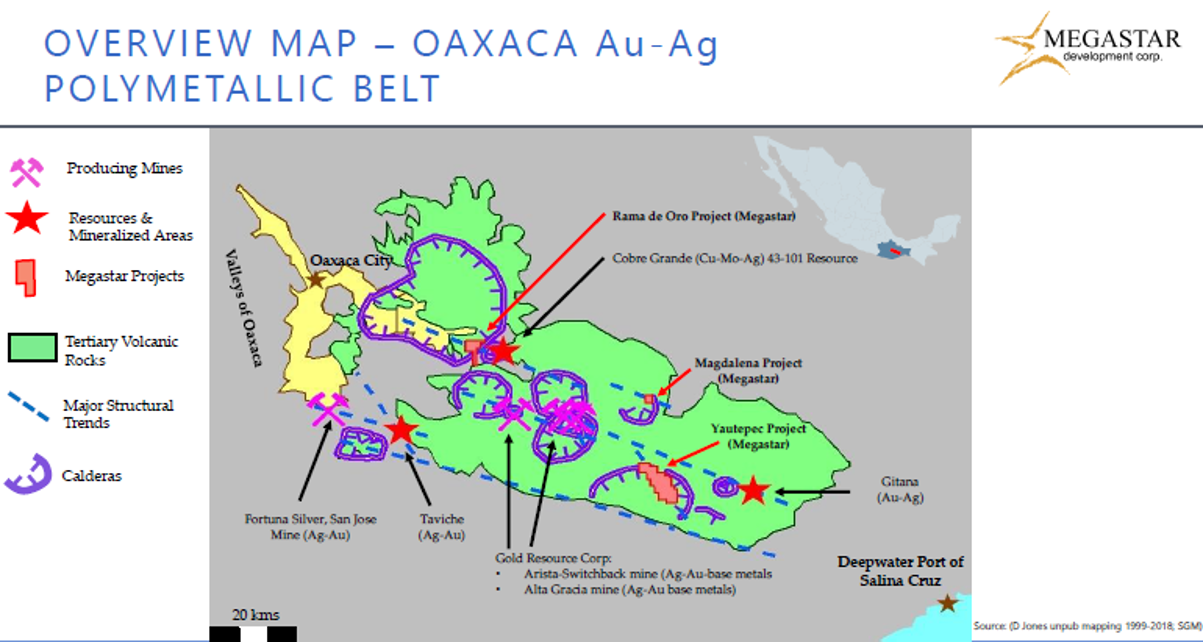
The chief geologist believes the deposits are part of a large, emerging trend.
Megastar Development Corp. (MDV:TSX.V; MSTXF:OTC; M5QN:FSE), a small-cap exploration company focused on the emerging Oaxaca Gold-Silver Belt in Mexico, has conducted fieldwork over two months that has revealed multiple targets for further exploration.
The fieldwork is being overseen by David Jones, chief geologist and a director of Megastar, who over his 40-year career has had a number of high-profile discoveries and expansions under his belt. Those in Mexico include the 1995 discovery of the Los Filos deposit in what is now known as the Guerrero Gold Belt (GGB), leading the successful Teck bid for the Morelos Reserve in the GGB (now Torex Gold), principal geological consultant in the fundraising and start-up of Torex Gold, the targeting of Gold Resource Corporation’s recent Switchback mine discovery, and participation as a director in the successful sale of Cayden Resources to Agnico Eagle. Jones was one of the early geologists to recognize the larger potential of the Guerrero Gold Belt, which over the past 25 years of his involvement has grown from less than 2 million ounces of gold to more than 30 million ounces.
“The reason I tend to have more success than failure is that I focus on thinking about why mineralization is where it is and where I might find more, especially if there are no obvious indicators in the area. Los Filos was a blind discovery; there was nothing at the surface, and it was based on a geologic idea that paid off,” Jones told Streetwise Reports. He says that similar thinking may be applied to the state of Oaxaca, Mexico.
Jones has become interested in the regional structures that cross through southern Mexico. “In Oaxaca, there are super volcanoescalderasand every mineralized district that I know of along the central volcanic belt in the state, including Fortuna Silver’s San Jose Mine and Gold Resource Corp.’s Arista-Switchback and Alta Gracia mines, is associated with Tertiary calderas and their related structures. The liquid magma that comes up fills the cracks and associated hydrothermal fluids make the ore body,” Jones explained.
Epithermal gold-silver deposits are known for their bonanza grades, “fabulous high grades, gold, silver, copper, lead, zinc, with gold upwards of 5 grams per tonne, silver in the kilo range and base metals in the multi-percentage range, all in the same vein,” Jones said.
Jones views the emerging Oaxaca Gold-Silver Belt as an “opportunity parallel to that of the early Guerrero Gold Belt” with the potential for significant discoveries. Fortuna Silver’s San Jose Mine has produced 767,000 gold-equivalent ounces (gold and silver) since 2013; Gold Resource’s Arista-Switchback and Alta Gracia mines have produced 465,000 ounces of gold since 2011.
Acting on his working theory is what allowed him to target what became the Switchback mine discovery. Applying his knowledge on a more regional scale led Jones to secure three highly prospective properties in Oaxaca, “the perfect number for a junior company,” and joined with Brian Ostroff of Windermere Capital to get Megastar going. Today, David Jones is the largest shareholder, believing strongly in the opportunity.
Megastar’s three Oaxaca projectsYautepec, Magdalena and Rama de Orohave no history of systematic exploration work, and thus the opportunity to find something of significance is considered wide open, Jones stressed.
At Yautepec and Magdalena, “we are seeing things that are textbook examples of mineralized epithermal systems even before we get to the first stage of drill testing. We have identified multiple centers of strong quartz veining, fossil hot springs, rhyolite domes and dikes, all with associated abundant sulfides, which is nothing short of remarkable for the small amount of work completed to date. We have an abundance of mineralized samples from Yautepec from a quartz vein system of over 500 meters strike length with estimated widths of 2 to 9 meters; this flanks a 700-meter-long mineralized fossil hot springs (sinter) deposit that demonstrates we are at the very top of the epithermal system, with the full potential preserved at depth,” Jones explained. “Another target consists of multiple dikes we have identified along a canyon bottom that are similar to those associated with the nearby producing mines of Gold Resource Corp. In total, we have identified four principal targets so far at Yautepec over a 3-kilometer trend, and that’s just a small part of the 20-kilometer caldera-related structural trend that defines the larger project.”
With positive results coming out of the initial work, Megastar in October announced the signing of an option agreement to acquire the mineral rights to Cerro Minas, an extension of the trend at Yautepec. “Completely surrounded by our current land holdings, Cerro Minas displays similar epithermal characteristics to targets that we had already identified and, given our early-stage success, adding this land is a natural as we look to enlarge our footprint in, what we believe, is a very prospective area,” Jones stated.
The Cerro Minas property covers “5 kilometers strike length of highly prospective ground containing polymetallic (Ag-Au-Cu-Pb-Zn) skarn-style mineralization along a northwest trending caldera structural margin,” the company stated. “With this agreement, Megastar has consolidated over 7 kilometers strike length of high potential epithermal and skarn mineralization targets for drill testing proposed in 2020.”
At another Megastar property, the Magdalena project, fieldwork has recently identified a 1.7-km structural trend “within a well-defined volcanic caldera.” In December Megastar announced that its preliminary work identified “characteristics of a significant epithermal system including gold mineralization locally exceeding 3.00 grams per tonne.” Jones stated, “We have mapped a principal 300 by 285 meter area of surface gold mineralization defined by 58 samples, including a couple of samples of over 3.00 g/t gold. This main zone, along with other prominent outliers, constitute easy-to-access and drill-ready targets.”
“The first-round Magdalena results are remarkable sampling numbers for anyone, anywhere,” Jones stressed, “58 samples above 0.20 grams with two over 3 grams, a dozen over a gram.”
Megastar geologists have been finding fossilized stromatolite mounds at Magdalena. “They form at the margins of previously active surface hot springs, which means that they are at the very top of the epithermal system,” Jones explained. “That’s important because it means that the entire vertical potential of that bonanza system is conserved; if it is there at all, you’ve got the full down dip extent of potential bonanza grade mineralization.”
“Megastar has a busy exploration program planned as it looks to follow up on its early success,” Jones said. As well, the company is currently in the process of applying for drill permits and expects to begin drilling this year. “This work should create a steady news flow for the company in coming months.”
Megastar boasts a tight share structure, with 44 million shares outstanding and 14 million warrants and options, which when exercised would generate just under $1.4 million. Management and insiders control approximately 16% of the company and other significant shareholders control an additional 23%.
Megastar closed a non-brokered private placement last spring that raised $672,600, which is being used to advance exploration on the properties and, to date, has generated results that have confirmed and heightened Jones’ early and persistent optimism.
Industry veteran Robert Archer, cofounder of Great Panther Mining and CEO of Newrange Gold, sits on Megastar’s board of directors. He told Streetwise Reports, “The Megastar projects in Mexico represent the best in fundamental gold exploration. We have the prolific Sierra Madre trend, the Oaxaca gold belt with producing mines, a highly respected and knowledgeable geologist responsible for some of those discoveries, and early stage prospects that are demonstrating all the right characteristics of epithermal gold deposits. We are excited about the potential for new discoveries and 2020 should be a pivotal year for the advancement of the projects.”
“People ask me why I’ve invested in Megastar,” Jones stated, “and I tell them that when you understand what you are looking at, it’s easy to become excited because I can clearly see the unrealized opportunity.”
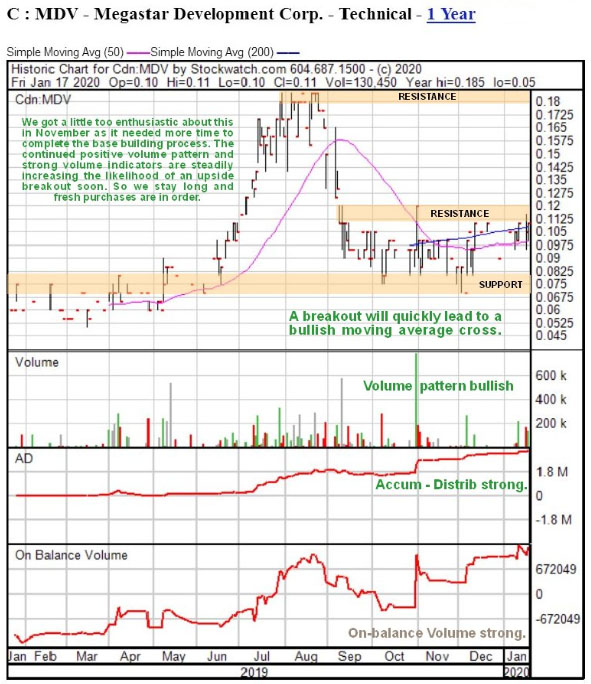
Technical analyst Clive Maund wrote on CliveMaund.com on January 18, that the company is nearing an upside breakout. “Megaster is an explorer/developer that in addition to gold and silver properties has a copper-zinc project. . .we stay long and Megastar continues to be rated a buy here.”
Disclosure: 1) Patrice Fusillo compiled this article for Streetwise Reports LLC and provides services to Streetwise Reports as an employee. She or members of her household own securities of the following companies mentioned in the article: None. She or members of her household are paid by the following companies mentioned in this article: None. 2) The following companies mentioned in this article are billboard sponsors of Streetwise Reports: None. Click here for important disclosures about sponsor fees. As of the date of this article, an affiliate of Streetwise Reports has a consulting relationship with Megastar Development. Please click here for more information. 3) Comments and opinions expressed are those of the specific experts and not of Streetwise Reports or its officers. The information provided above is for informational purposes only and is not a recommendation to buy or sell any security. 4) The article does not constitute investment advice. Each reader is encouraged to consult with his or her individual financial professional and any action a reader takes as a result of information presented here is his or her own responsibility. By opening this page, each reader accepts and agrees to Streetwise Reports’ terms of use and full legal disclaimer. This article is not a solicitation for investment. Streetwise Reports does not render general or specific investment advice and the information on Streetwise Reports should not be considered a recommendation to buy or sell any security. Streetwise Reports does not endorse or recommend the business, products, services or securities of any company mentioned on Streetwise Reports. 5) From time to time, Streetwise Reports LLC and its directors, officers, employees or members of their families, as well as persons interviewed for articles and interviews on the site, may have a long or short position in securities mentioned. Directors, officers, employees or members of their immediate families are prohibited from making purchases and/or sales of those securities in the open market or otherwise from the time of the interview or the decision to write an article until three business days after the publication of the interview or article. The foregoing prohibition does not apply to articles that in substance only restate previously published company releases. As of the date of this article, officers and/or employees of Streetwise Reports LLC (including members of their household) own securities of Megastar Development Corp., a company mentioned in this article.
Additional disclosures Clive Maund does not own shares of Megastar Development and neither he nor his company has a financial relationship with the company.
Better than expected New Zealand trade balance bullish for NZDUSD
On 1-hour timeframe NZDUSD: H1 is in downtrend after retracing higher following a fall to 17-month low. The price is below the 200-period moving average MA(200) which is falling itself.
We believe the bearish momentum will continue after the price breaches below the lower bound of the Donchian channel at 0.6480. A level below this can be used as an entry point for placing a pending order to sell. The stop loss can be placed above 0.6510. After placing the order, the stop loss is to be moved to the next fractal high, following Parabolic signals. Thus, we are changing the expected profit/loss ratio to the breakeven point. If the price meets the stop loss level without reaching the order, we recommend cancelling the order: the market has undergone internal changes which were not taken into account.
New Zealand trade surplus was bigger than expected for December. Will the NZDUSD start rising?
Higher Brazil crop forecast bearish for coffee price
On the daily timeframe #C-COFFEE: D1 has breached below the 200-day moving average MA(200), which is declining. This is bearish.
We believe the bearish momentum will continue as the price breaches below the lower Donchian boundary at 103.4. A pending order to sell can be placed below that level. The stop loss can be placed above 107.4. After placing the order, the stop loss is to be moved every day to the next fractal high, following Parabolic signals. Thus, we are changing the expected profit/loss ratio to the breakeven point. If the price meets the stop loss level (107.4) without reaching the order (103.4), we recommend cancelling the order: the market has undergone internal changes which were not taken into account.
Coffee production in Brazil is forecast to reach new record this year. Will the coffee prices continue falling?
Coffee exporter Comexim reported Brazilian farmers are expected to produce a record coffee crop in 2020. Brazil is the world’s largest producer of coffee. Comexim estimates Brazil will produce 67.7 million 60-kg bags of coffee this year. The previous record crop was 64.5 million bags produced in 2018. Brazil’s harvest of new coffee crop starts around April or May. The company expects a global surplus in the 2020-21 crop of 3.5 million bags. Expectations of higher output by world’s top coffee producer is bearish for coffee.
Crude prices have been back under pressure this week. The latest report from the Energy Information Administration reflected an unexpected build in US crude stores last week. The EIA reported that US crude stores rose by 3.5 million barrels in the week ending January 24th. This was far above the 1.4 million barrels projected by analysts. It was also contrary to the 4 million barrel increase reported by the API just a day earlier.
Gasoline Inventories Rise
The report also showed that gasoline inventories were higher last by 1.2 million barrels. Although, this was a little lower than the 1.7 million barrel increase forecast by the market. Distillate stockpiles were actually seen lower over the week by 1.3 million barrels. However, this was not as deep as the 1.6 million barrel decline forecast ahead of the release.
Wuhan Virus Fears Still Weighing On Sentiment
Crude prices have been under heavy selling pressure all week as demand fears linked to the Wuhan virus continue to weigh on sentiment. During the SARS outbreak of 2003, crude demand was knocked sharply lower. Traders are speculating that a similar dynamic will play out this time. Indeed, this latest report from the EIA adds weight to that view and keeps the near term outlook tilted to the downside for crude.
However, looking further out, there are some encouraging factors for crude. The signing of the US/China trade deal means that talks will now move onto the second phase of negotiations, aimed at delivering a phase two deal. Such a deal would likely put a final end to the two-year trade war and would offer a considerable boost for crude-demand expectations.
EIA Forecasts Slowing Of US Crude Production
In its Short Term Energy Outlook for January, the EIA forecasts that US crude production will average 13.3 million barrels per day in 2020. This is up 9% from 2019 levels while 2021 production will average 13.7 million barrels per day, up 3% on this year. The key thing here is that the EIA is forecasting US crude production growth to slow into next year. This should offer some support to crude prices, especially if demand can rebound.
Technical Perspective
The sell-off in crude this week has seen price breaking down beneath the rising trend line from 2018 lows as well as the 55 level. While price has so far found support at the 52.17 level, beneath the broken trend line, focus is on further downside with a move down to 50.65 the next target.