2020 started with some good moves in some of the major cryptocurrencies. As a bi-directional market which allows you to profit from long trades as well as short trades, these cryptocurrencies could hold great potential for you.
But why should you focus on these cryptocurrencies?
a.) Good volatility with high trading volume
In any financial market, you are basically trading against the dealer or other traders. Without volume and volatility, you are left with a dead cryptocurrency which only ties down your money while good things happen elsewhere…without you. You should be able to buy and sell at will with instant order executions, and your preferred cryptocurrency should have good range of movement to help you profit from its movements.
b.) Easy to buy or sell
The cryptocurrencies to focus on should be the ones that are easy to buy or sell on popular cryptocurrency trading platforms like Binance, Etoro, ROinvesting or IG, as a result of their general acceptability to the entire market. There is no gain in trading cryptos that no one has ever heard of or one that no one wants. If you check for example ROinvesting review, you will easily see which cryptocurrency pairs are commonly traded and which ones are sparsely traded. The candles in the latter will look more like stacked matchboxes than real candles.
Now that we know the character of the crypto assets we should look out for, here are some of the cryptocurrencies to focus on in 2020.
Bitcoin
Bitcoin will continue to command number 1 position because it is the cryptocurrency which best fulfils the conditions listed above. It commands the most market volume, is easy to buy or sell, will always have demand and will have supply willing to meet that demand. It commands great range of movements that can potentially turn the right move into good profits.
Litecoin
Litecoin was created as an analogue of Bitcoin, and so it tends to track the movements of Bitcoin in the market. If Bitcoin is too expensive to trade or commands too much volatility for your account to handle, then Litecoin is a good alternative. Most of the time, you will find that the same price patterns on Bitcoin tend to form on Litecoin, and at lower prices too. So if you have a small account, Litecoin is a good trading alternative for 2020.
Ripple
Ripple may just be the sleeping giant that could awaken in 2020. This is because the project has a working product that is very likely to be the future of global remittance and bank wire transfer systems. More than 75 banks from all over the world have signed up to the Ripple network. How the price of Ripple continues to trade at such cheap levels is still a wonder to many discerning crypto investors. Imagine a company with a product that has the potential to be used by billions of people in the not-too-distant future, and you have Ripple Labs. The Ripple token could be the one to surprise many this year and it is still at cheap level. As at the time of writing, it is not even up to 25 cents per token. What you would use to buy 1 BTC can fetch you nearly 8,600 XRP tokens. Lest I forget, I need to mention that the company was able to secure $200m additional investment in December 2019. Keep an eye on Ripple for 2020.
EOS
EOS is surely but quietly making giant strides in the decentralized apps (dApps) market. While Ethereum and TRON have traditionally been the two names in this space for real-life dApps and gambling-related dApps respectively, EOS is quietly taking over that market. The 260 dApps that have been created on EOS commanded a trade volume of $5bn in the last year, which represented 50% of the total spend on dApps in the market. This also surpassed the total amounts spent on Ethereum and TRON in the dApps market. EOS is also commanding more activity in this space than Ethereum or TRON. The EIDOS launch on the EOS platform has increased the number of transactions on that platform by a factor of X4. EIDOS has conferred on EOS a status of the dApp network which has lower users that command the largest activity volumes. EOS should be on your watchlist for 2020 and the cost of the token is still below $4.
These are the top 4 cryptocurrencies you need to watch out for in 2020, a year that we believe will see greater value for cryptos that are adding value to the ecosystem as well as churning out real-life use case products.
About the Author:
Michael is an experienced financial trader using Forex, Commodities and Cryptocurrencies. In addition to trading, he runs businesses, trains traders and develops trading technology products. His other passions are boxing and traveling.
The yellow metal has ended the week in the green as risk-off flows relating to the ongoing coronavirus outbreak were seen fuelling safe-haven demand for metals. Gold prices gapped higher at the open this week as news of the intensification of the viruses spread over the week saw equities prices sharply lower. Over the week, news of an increase in the number and geographical distribution of confirmed cases, as well as the number of deaths, has seen safe-haven flows continue as equities remain on the back foot.
While an upside in gold was initially limited this week by strength in the US dollar, the FOMC meeting this week saw USD gains reverse. The Fed’s statement was little changed from last time around, with the central bank noting that while it deems the current monetary policy approach as appropriate, it will continue to monitor data and developments. Powell specifically mentioned the Chinese flu issue as a serious threat to the domestic and global economy and in light of this, the meeting was deemed to be more on the dovish side, leading USD lower.
Gold prices found support above the broken 2019 highs around the 1554.69 level and are continuing to push higher. The recent rejection from the 1608.54 level has failed to follow through, at least for the time being.
Technical Perspective
While price holds above the 1554.69 level, a further push higher within the bullish channel looks likely and an eventual break above the 1608.54 level. The only real downside risk at the moment is any breakthrough in containing the Chinese flu outbreak. Such an announcement could fuel a sharp reversal in gold. To the downside, any break of the 2019 highs would bring the 1522.75 level back into focus. 1571 is the weekly open.
Silver
Silver prices have been lower over the week, breaking correlation with gold. The drop in equities prices as well as the expectations of reduced industrial demand in the wake of the coronavirus outbreak, has weighed on silver here. Looking ahead, the downside threat from coronavirus should keep silver weighed to the downside. However, further weakness in USD should help offset some of this downside.
Technical Perspective
Silver prices continue to range between the 17.3408–18.6397 level, caught between the two bearish trend lines. The downside action in silver this week found strong support into the 17.3408 level as the consolidation continues. While price is still holding above the 17.3408 level, a further test of the 18.6397 level is still viable. To the downside, a break of 17.3408 would pave the way for a test of the 16.52 level next.
Note: This overview has an informative and tutorial character and is published for free. All the data, included in the overview, are received from public sources, recognized as more or less reliable. Moreover, there is no guarantee that the indicated information is full and precise. Overviews are not updated. The whole information in each overview, including opinion, indicators, charts and anything else, is provided only for familiarization purposes and is not financial advice or а recommendation. The whole text and its any part, as well as the charts cannot be considered as an offer to make a deal with any asset. IFC Markets and its employees under any circumstances are not liable for any action taken by someone else during or after reading the overview.
On the daily timeframe #C- BRENT: D1 has breached below the 200-day moving average MA(200), which is declining. It failed to breach Fibonacci 61.8 resistance level.
We believe the bearish momentum will continue after the price breaches below the lower boundary of Donchian channel at 56.73. A level below this can be used as an entry point for placing a pending order to sell. The stop loss can be placed above 59.84. After placing the order, the stop loss is to be moved every day to the next fractal high, following Parabolic signals. Thus, we are changing the expected profit/loss ratio to the breakeven point. If the price meets the stop loss level (56.73) without reaching the order (59.84), we recommend cancelling the order: the market has undergone internal changes which were not taken into account.
US domestic crude oil stock rose last week. Will the BRENT decline?
On Wednesday the Energy Information Administration reported that US crude supplies rose by 3.5 million barrels. SP Global Platts analysts had forecast a smaller rise of 1.4 million barrels, while the American Petroleum Institute trade group’s Tuesday report estimated a decline of 4.3 million barrels. Rising US crude oil inventories are bearish for Brent. At the same time there have been reports OPEC considers extending output cuts until June, and even a deeper cut from current levels. A rise in geopolitical tensions in Middle East is also an upside risk for oil.
The latest advanced GDP report from the United States showed that the economy grew by 2.1% on the quarter ending December 2019. This enabled the US to grow at a pace of 2.3% annually on the year.
The data comes amid investor concerns of a sharp slowdown. Consumers remain the primary driving force in the GDP figures for the fourth quarter.
Economic Sentiment in Eurozone Rises to a 7-month High
The European economic confidence report shot to a seven month high in January. The index rose to 102.8 during the month, beating estimates of 102.0.
This was also higher from 101.3 in December. In a separate report, the unemployment rate in the eurozone fell to a decade low in December.
EURUSD Maintains a Steady Rebound
As expected, the common currency is holding up after rebounding from the support level of the 1.1000 region. We could expect a modest pullback with the Stochastics moving into overbought levels.
Still, a formation of a higher low will confirm the upside. In such a scenario, the EURUSD will be targeting the resistance level of 1.1072 in the near term.
BoE Keeps Rates on Hold
The Bank of England held its monetary policy meeting on Thursday. The central bank’s MPC voted to keep interest rates unchanged, amid speculation of a rate cut.
There were two dissenting votes in favor of a quarter-point cut to interest rates. The central bank also issued downbeat forecasts as it now expects growth to rise just 0.8% this year.
GBPUSD Jumps on Strong Rebound
The currency pair made strong gains on Thursday, rising sharply in the closing hours. The gains saw price action testing the resistance level of 1.3100. If price action fails to breakout higher, then watch for a possible right shoulder formation of a head and shoulders pattern forming.
The downside support near 1.3000 will come into focus.
Gold Prices Hold Steady on Global Cues
Gold prices are relatively stable, although the precious metal is not making any new highs. Amid concerns of the impact of the coronavirus, the precious metal remains well in favor.
The latest advance GDP reports from the US put a slight damper on gold prices. The precious metal did not react much to the Fed or the BoE meeting over the week.
XAUUSD is Struggling Near Previous Highs
Gold is struggling to breakout higher as it approaches the previous highs made earlier this month. A breakout above this level is required to confirm further continuation to the uptrend.
The resistance level of 1594 will also prove to be a strong one to break in the near term. This keeps the bias somewhat mixed in the near term.
The US Dollar has had a muted start to the final trading day of the week. Following a more cautious tone from the Fed on Wednesday, the dollar has softened a little though the USD index is still above the broken bearish trend line for now at 97.73 last. The meeting itself was muted with the Fed reiterating its message that it will continue to monitor data and developments.
EUR Higher on USD Weakness
EURUSD has been a little firmer today, benefiting from the weakness in USD. The 1.10 level was able to hold as support this week, keeping EUR bid. However, the near term outlook remains tilted to the downside and a break of the level seems likely. The Eurozone CPI estimate this moring printed in line with expectations at 1.4%.
BOE Sounds more Optimistic
GBPUSD has softened a little today though ends the week higher on the back of the BOE meeting this week which saw the bank taking a much more constructive stance on the economy. Despite dovish comments recently, the BOE sounded much more upbeat on the economy and held off from a rate cut.
Volatile Week For the SPX500
Risk assets have been lower again today though over a volatile week have been able to claw back losses, to end the week higher than the open. The ongoing corona-virus situation is keeping the outlook obscured for now with SPX500 trading 3279.43 last, still lower than last week following the gap down at the open this week.
JPY & Gold End Strong
Safe havens have both been firmer again today, ending the week in the green as traders look to move into safer assets ahead of the weekend. Both JPY and gold have been higher against USD. XAUUSD trades 1580 last while USDJPY trades 108.96.
Crude Testing Support
Oil prices have been lower again today and are ending the week firmly lower. Reduced demand expectations in light of the corona-virus outbreak, as well as the EIA reporting a large inventories build, has kept crude sentiment skewed lower this week. Crude trades 52.18 last, fighting to stay above the 52.17 level for now.
Loonie Lift-Off Continues
USDCAD continues to rally today with price pushing further above the broken 1.3207 level to trade 1.3241 last. The slide in crude has weighed heavily on CAD, keeping the loonie well bid. Looking ahead today, Canadian GDP is the main data reading to watch.
Aussie Near 2019 Lows
AUDUSD has been sharply lower again today, extending losses across the week, and is now close to testing the 2019 lows around .6671. Traders are widely expecting the RBA to ease next week, in line with recent commentary, keeping AUD sentiment tilted to the downside.
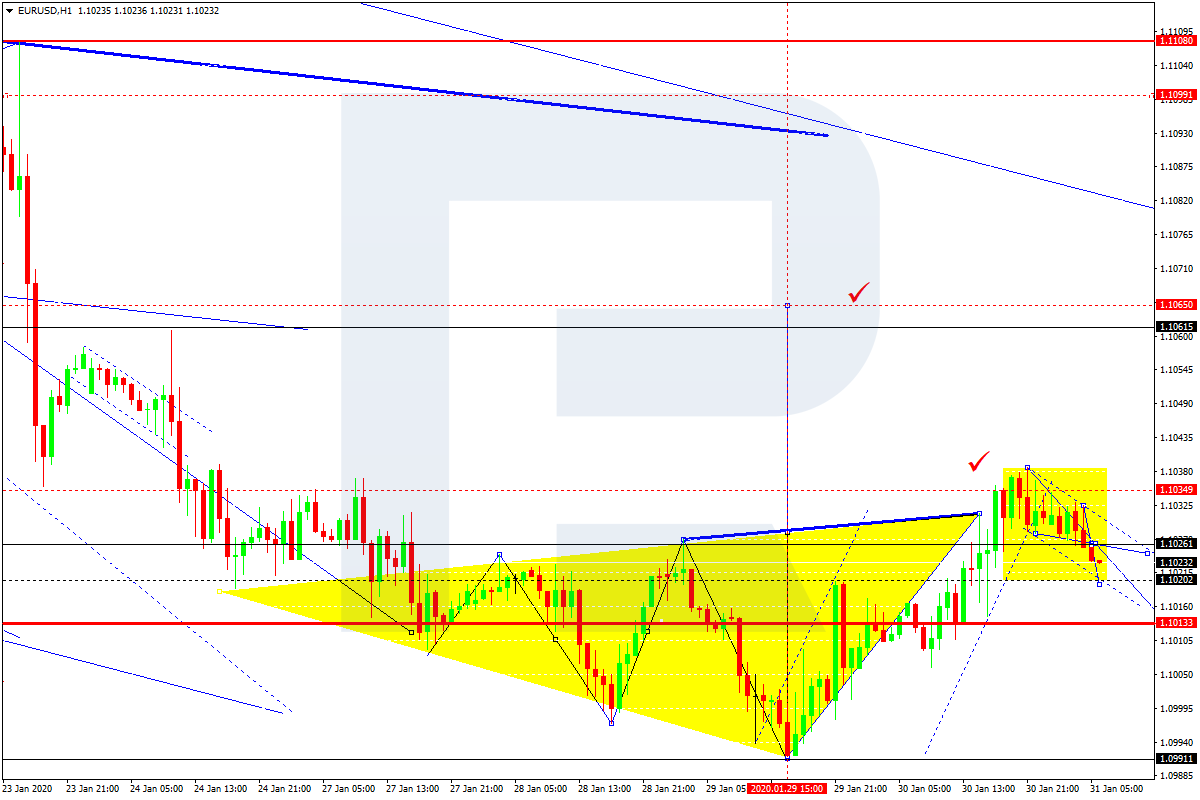
EURUSD has completed another ascending impulse towards 1.1038; right now, it is correcting towards 1.1013. After that, the instrument may form one more ascending structure to break 1.1038 and then continue growing with the target at 1.1060.
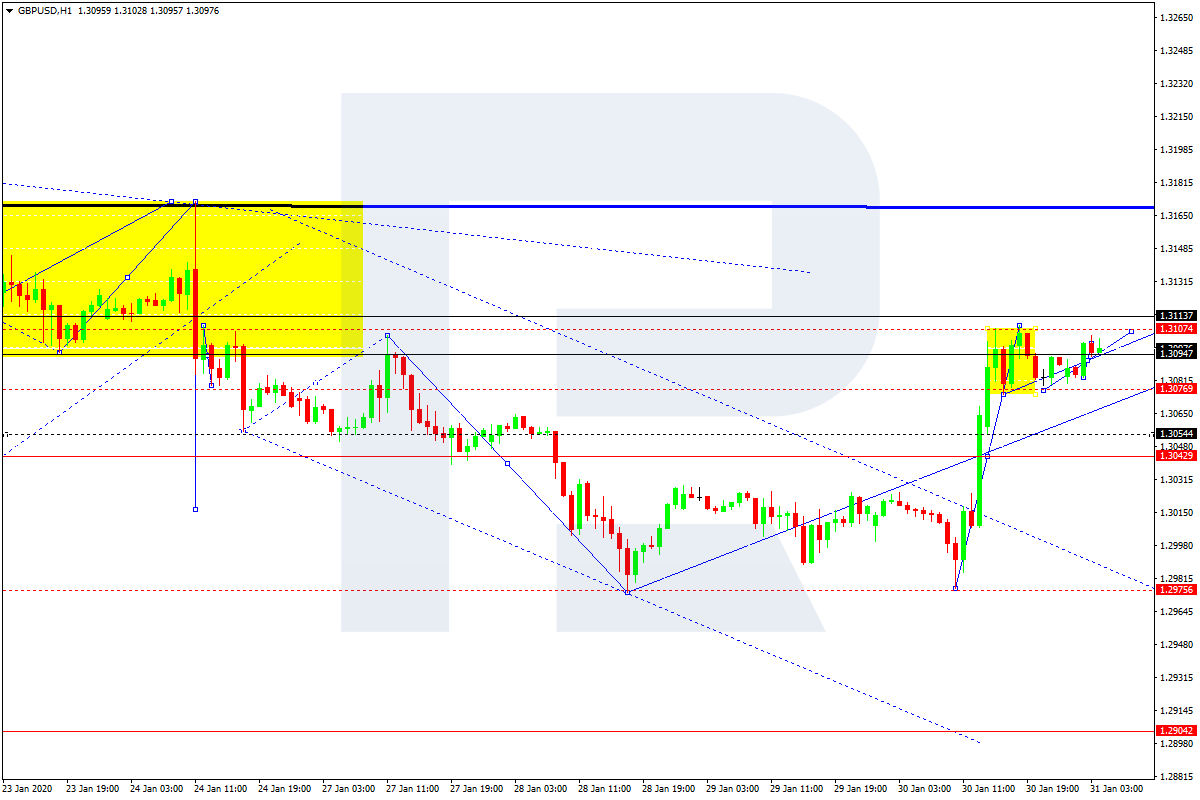
GBPUSD, “Great Britain Pound vs US Dollar”
GBPUSD has returned to 1.3085; right now, it is consolidating near the highs. Possibly, the pair may form a new descending structure towards 1.3040 and then start another growth with the target at 1.3090.
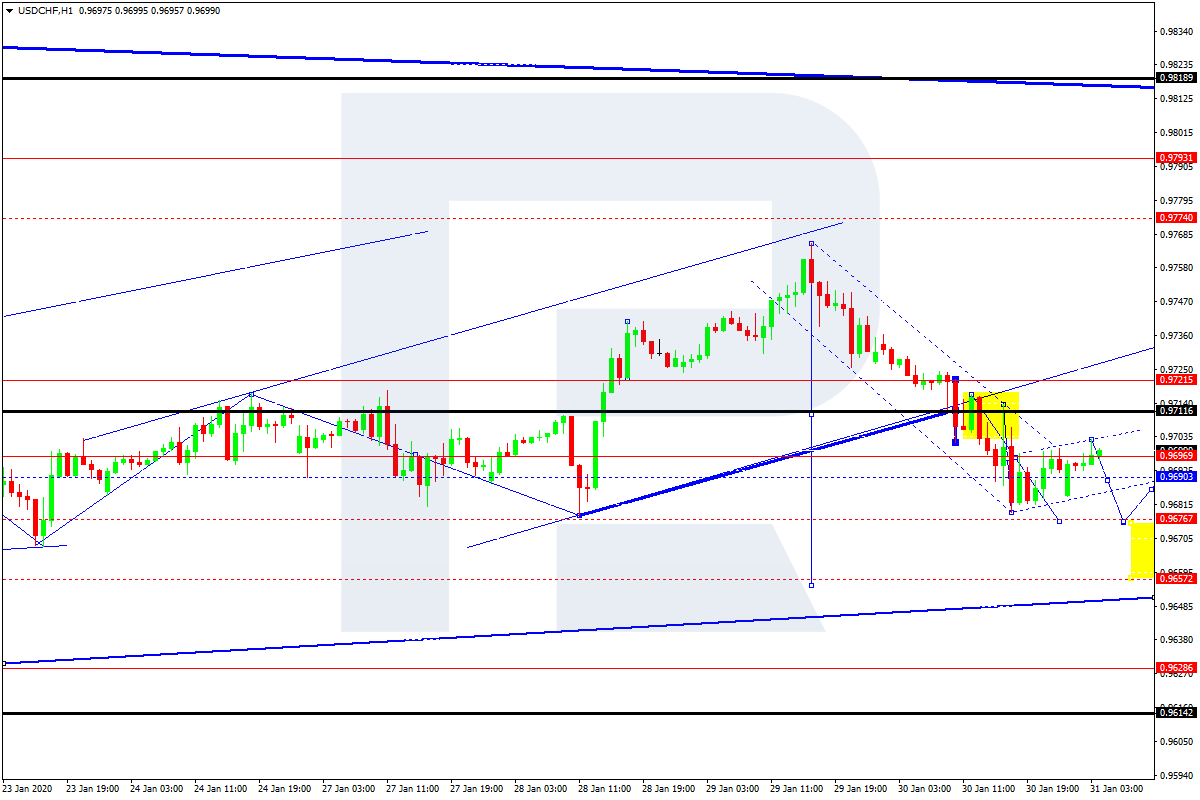
USDCHF, “US Dollar vs Swiss Franc”
After finishing the descending structure towards 0.9680, USDCHF has completed the correction at 0.9700. Later, the market may start a new decline with the target at 0.9661.
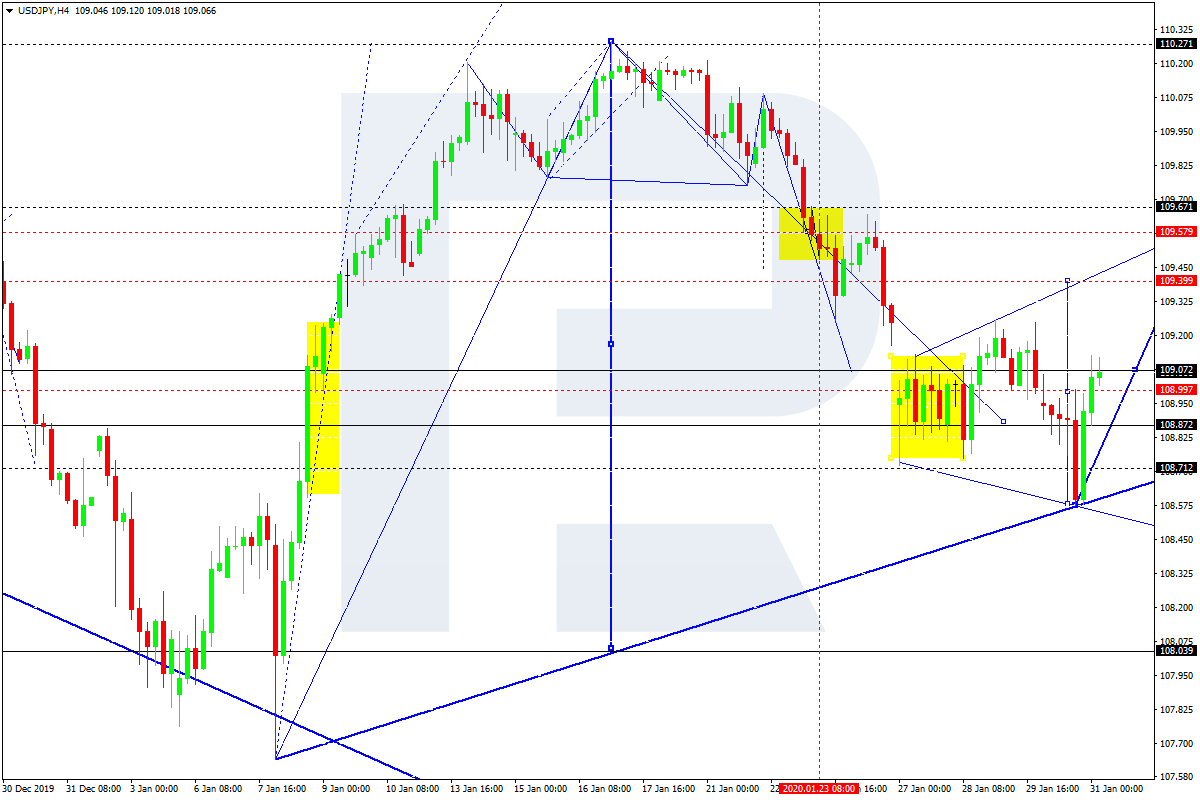
USDJPY, “US Dollar vs Japanese Yen”
USDJPY is still consolidating around 108.99. Possibly, today the pair may expand the range up to 109.39 or even 109.57 to test it from below. Later, the market may resume falling inside the downtrend with the target at 108.03.
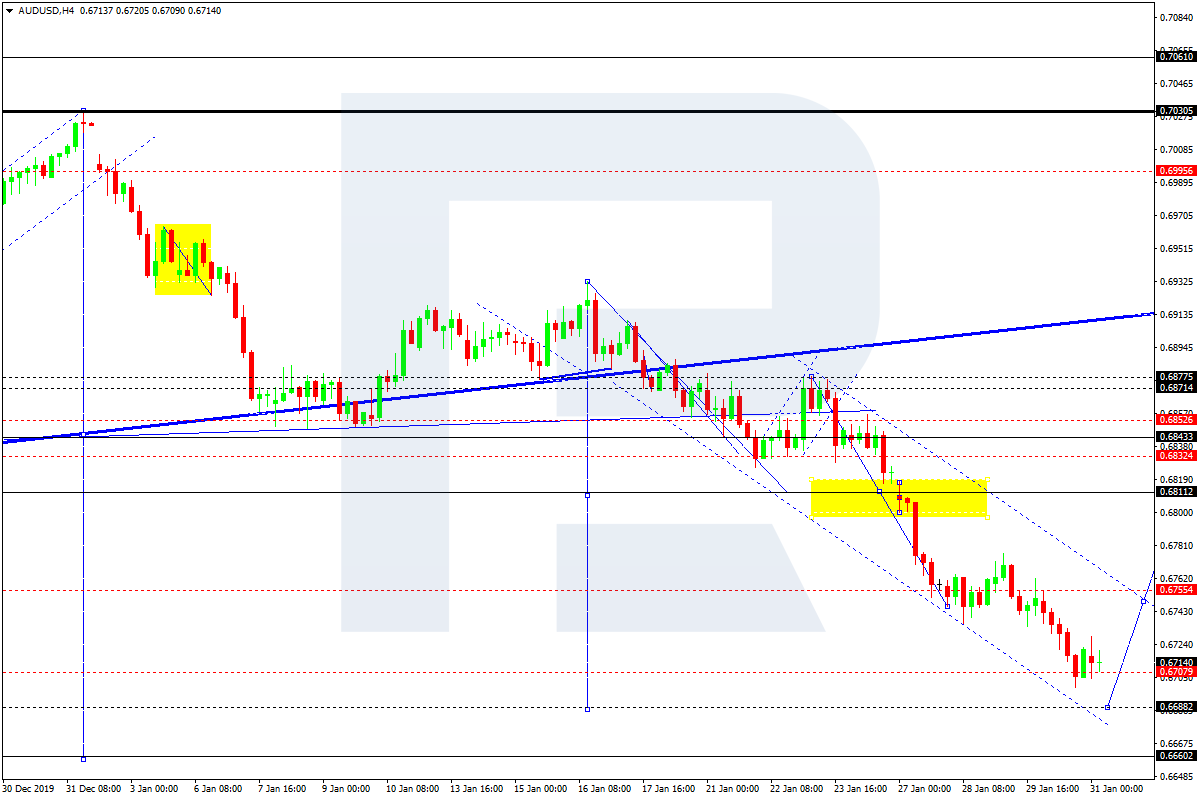
AUDUSD, “Australian Dollar vs US Dollar”
After breaking 0.6733, AUDUSD has completed the descending structure towards 0.6707. Today, the pair may grow to test 0.6733 from below and then resume trading downwards with the target at 0.6688.
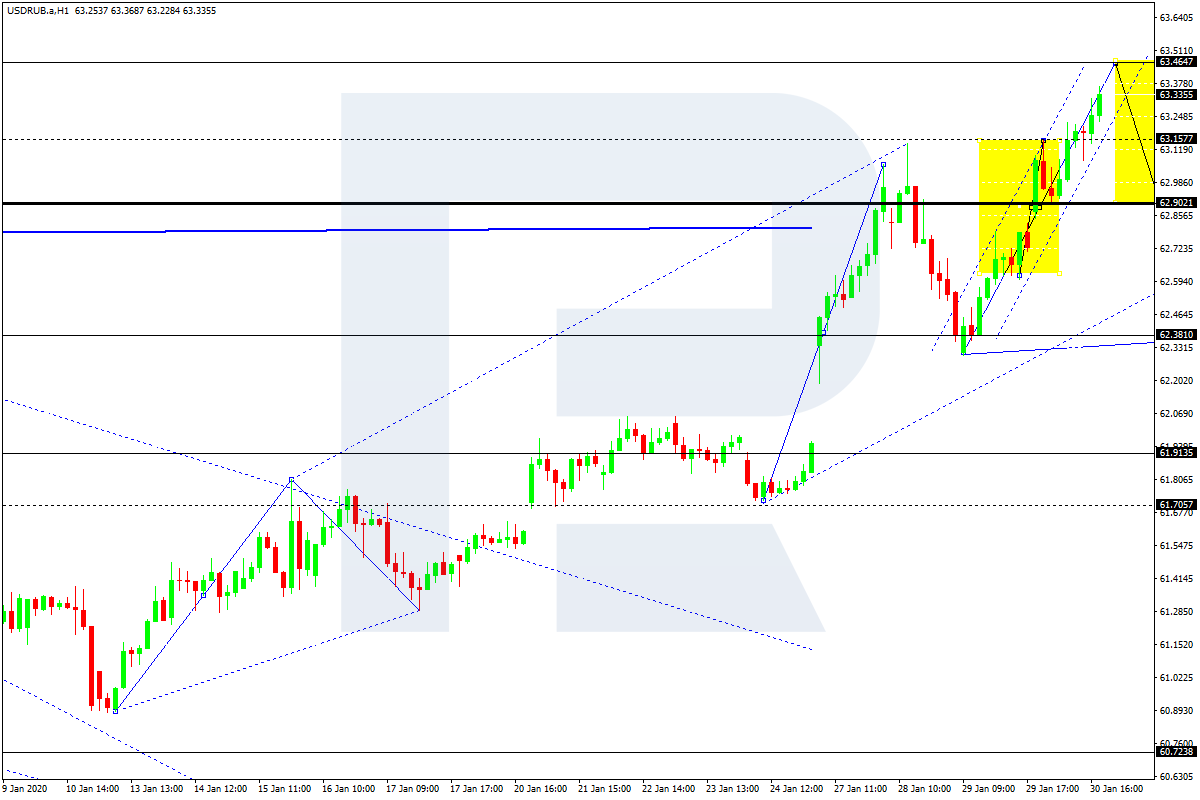
USDRUB, “US Dollar vs Russian Ruble”
USDRUB is moving upwards. Possibly, the pair may reach 63.50 and then form a new descending structure to break 62.90. Later, the market may resume trading downwards with the first target at 62.38.
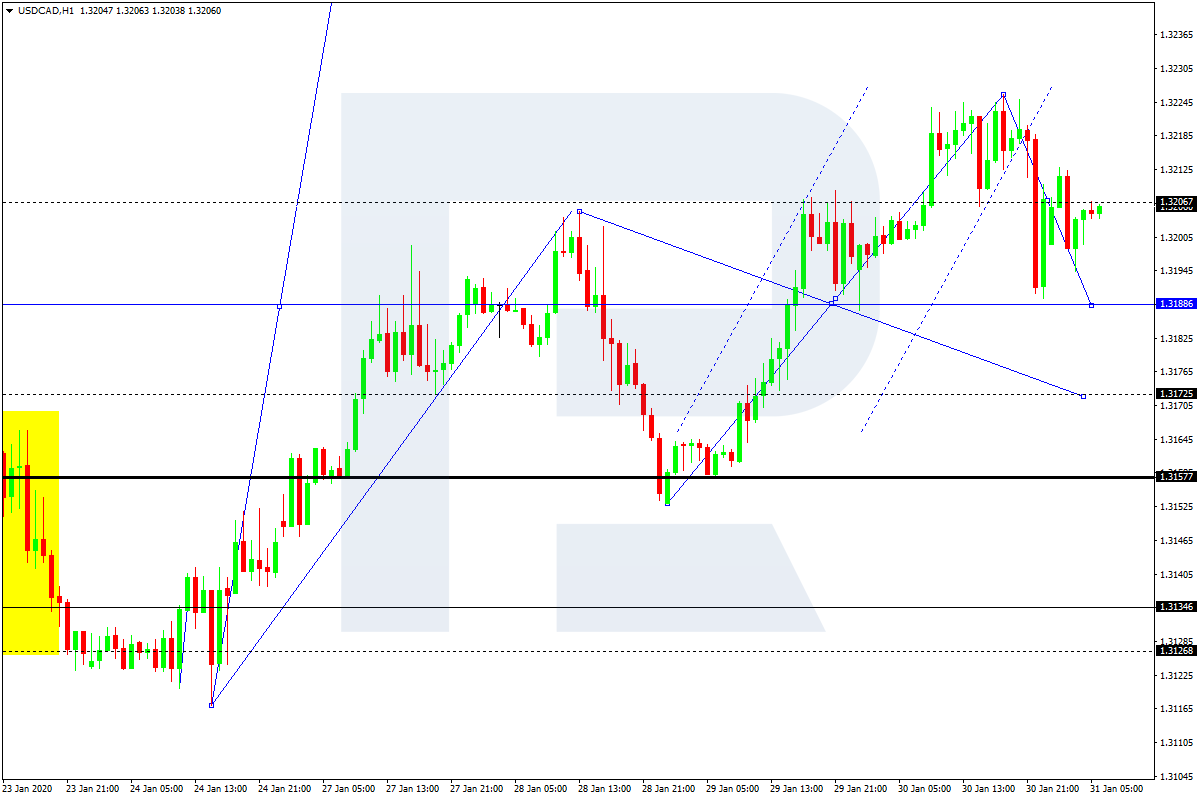
USDCAD, “US Dollar vs Canadian Dollar”
USDCAD is falling towards 1.3188 and may later start a new correction to reach 1.3206, thus forming a new consolidation range. If the price breaks this range to the downside, the market may form a new descending structure to reach 1.3170; if to the upside – resume growing with the target at 1.3250.
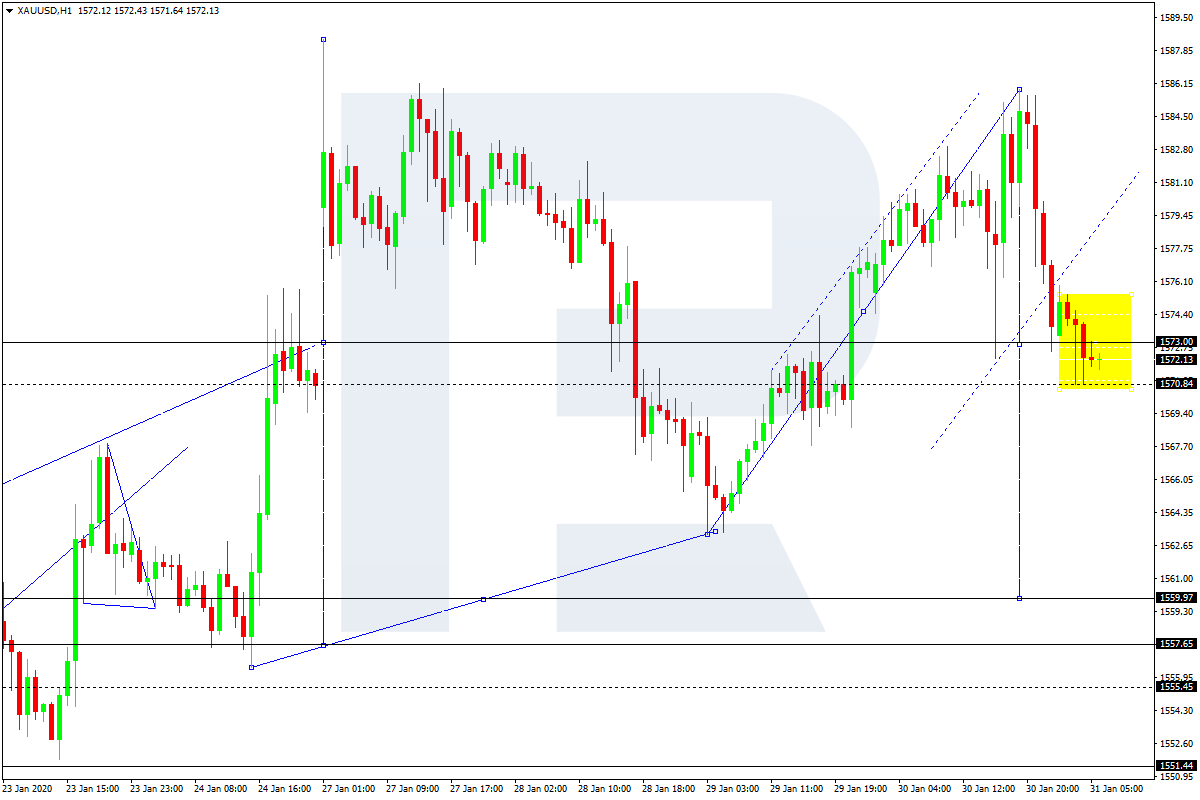
XAUUSD, “Gold vs US Dollar”
Gold is moving downwards. Possibly, the pair may break 1570.84. The downside target is at 1560.00.
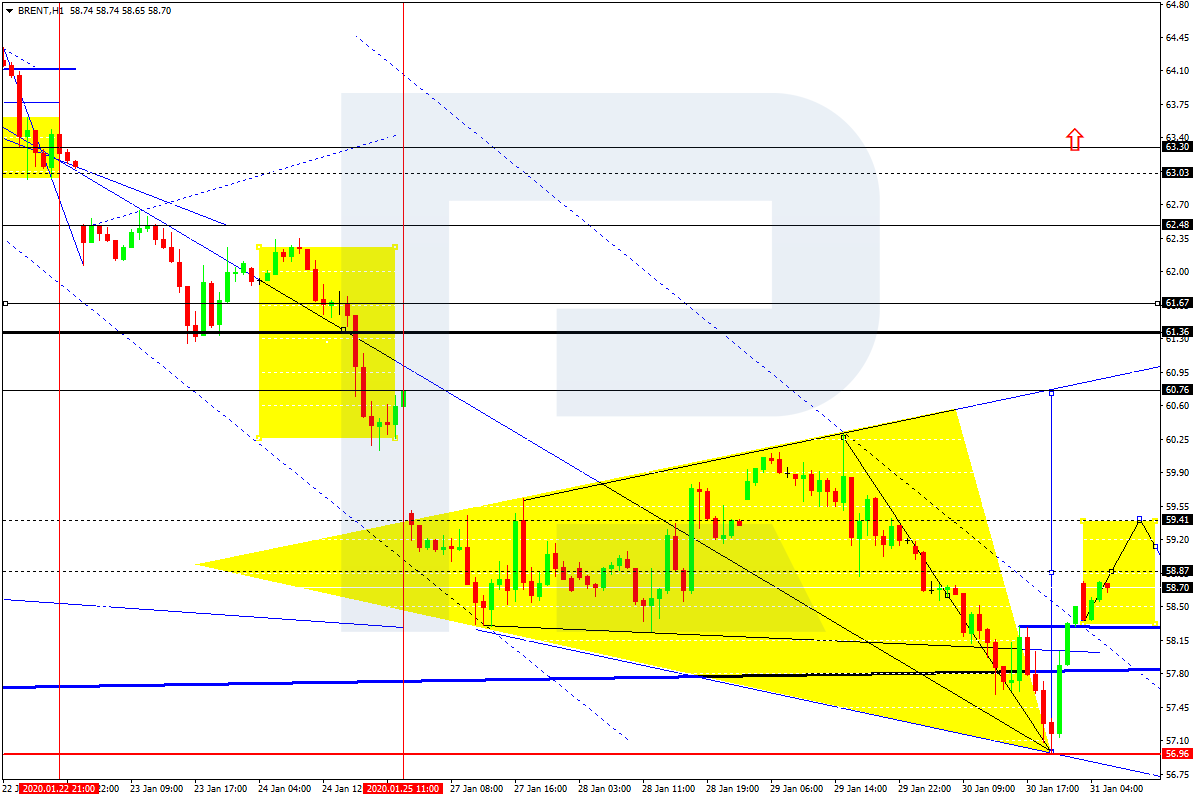
BRENT
Brent is growing towards 58.87. Today, the pair is expected to form a new consolidation around this level. If later the price breaks this range to the upside, the market may continue trading upwards with the target at 60.75.
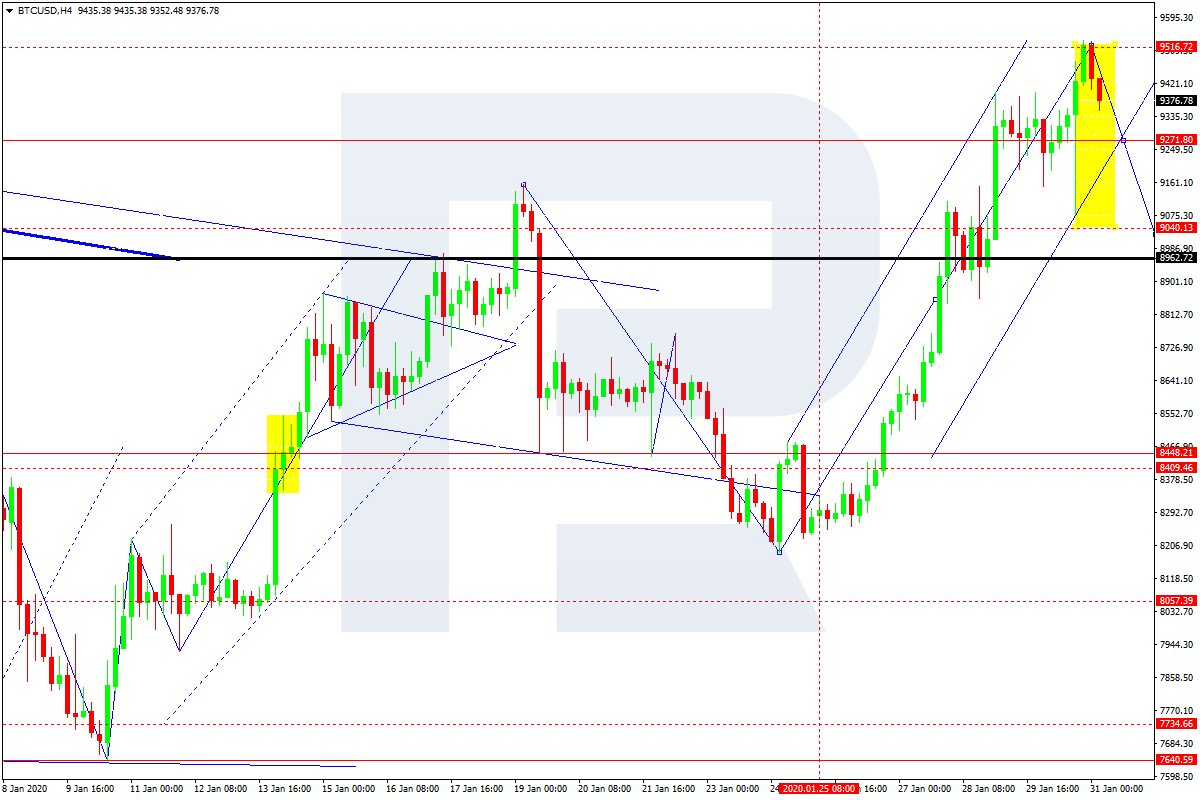
BTCUSD, “Bitcoin vs US Dollar”
BTCUSD has reached 9500.00; right now, it is moving downwards. The main scenario implies that the pair may fall to reach 9050.00 and then start a new correction towards 9250.00. After that, the instrument may continue falling with the target at 8500.00.
Attention! Forecasts presented in this section only reflect the author’s private opinion and should not be considered as guidance for trading. RoboForex LP bears no responsibility for trading results based on trading recommendations described in these analytical reviews.
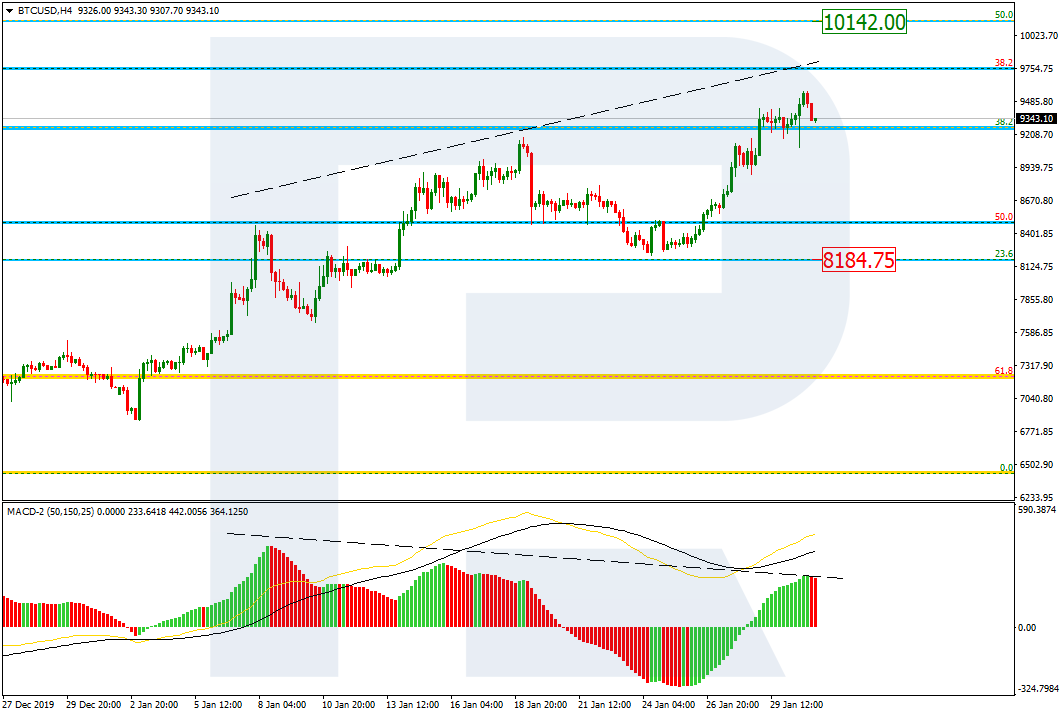
As we can see in the H4 chart, after reaching 38.2% fibo, BTCUSD is trying to get to 50.0% fibo. At the same time, there is a divergence on MACD, which may indicate a possible pullback soon. The support is at 23.6% fibo (8184.75).
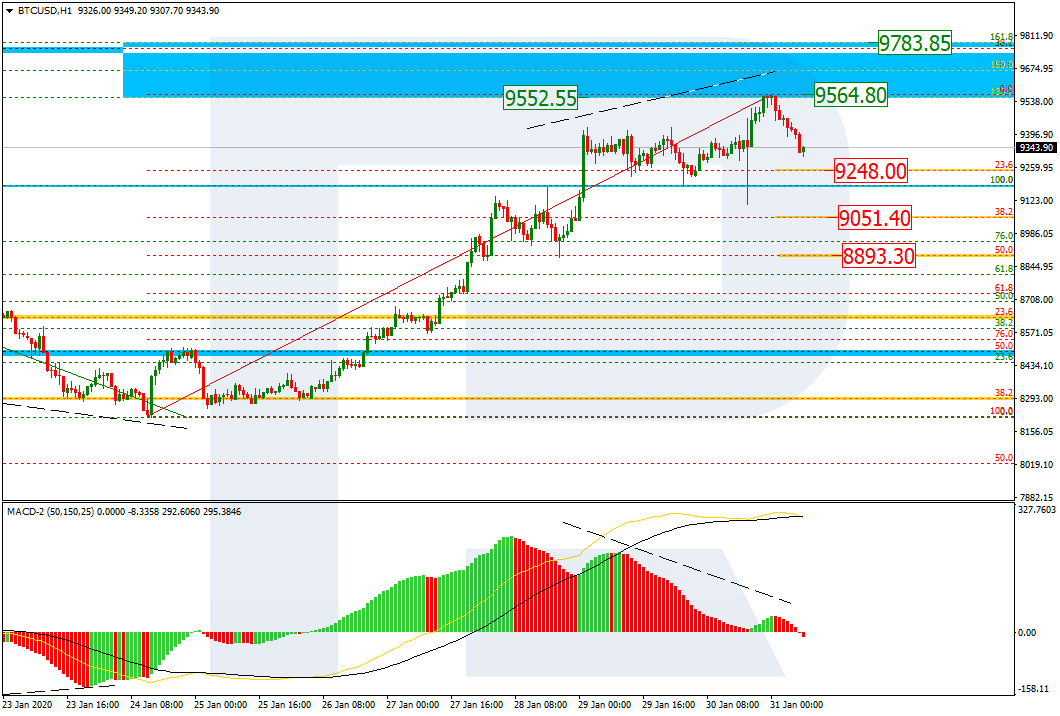
In the H1 chart, after the pair had reached the upside post-correctional extension area between 138.2 and 161.8% fibo at 9552.55 and 9783.85 respectively, there was a divergence on MACD, which made it start a new pullback. The targets of this pullback may be 23.6%, 38.2%, and 50.0% fibo at 9248.00, 9051.40, 8893.30 respectively. The resistance is the local high at 9564.80.
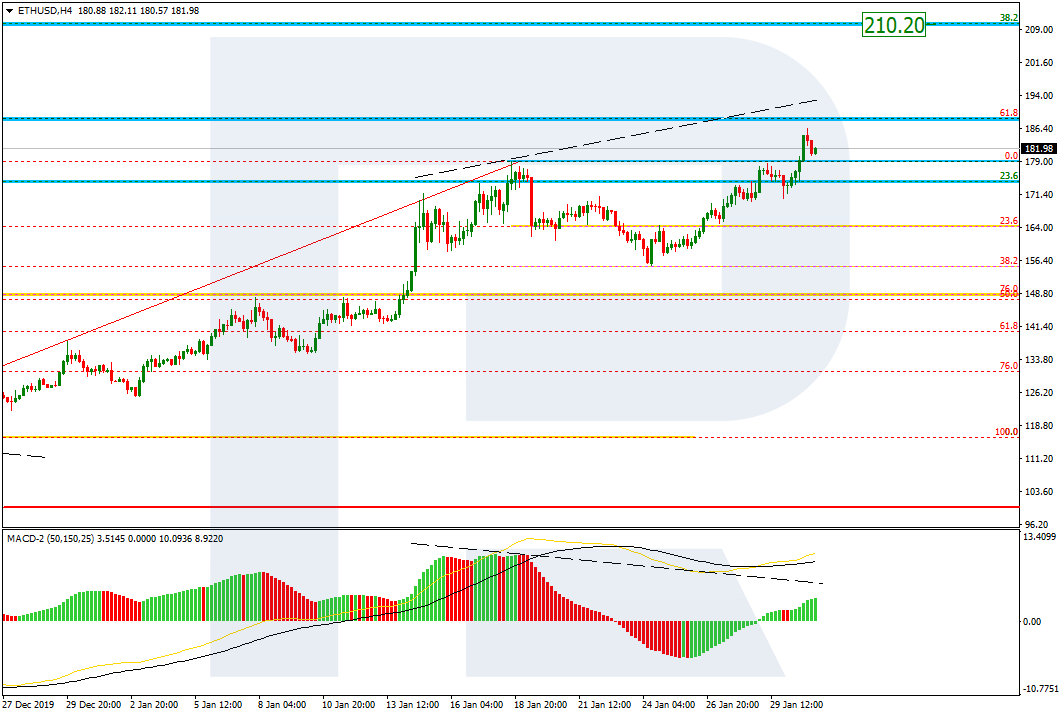
ETHUSD, “Ethereum vs. US Dollar”
As we can see in the H4 chart, after updating the high, ETHUSD is trying to fix above 23.6%. the next upside target is 38.2% fibo at 210.20. At the same time, there is a divergence on MACD.
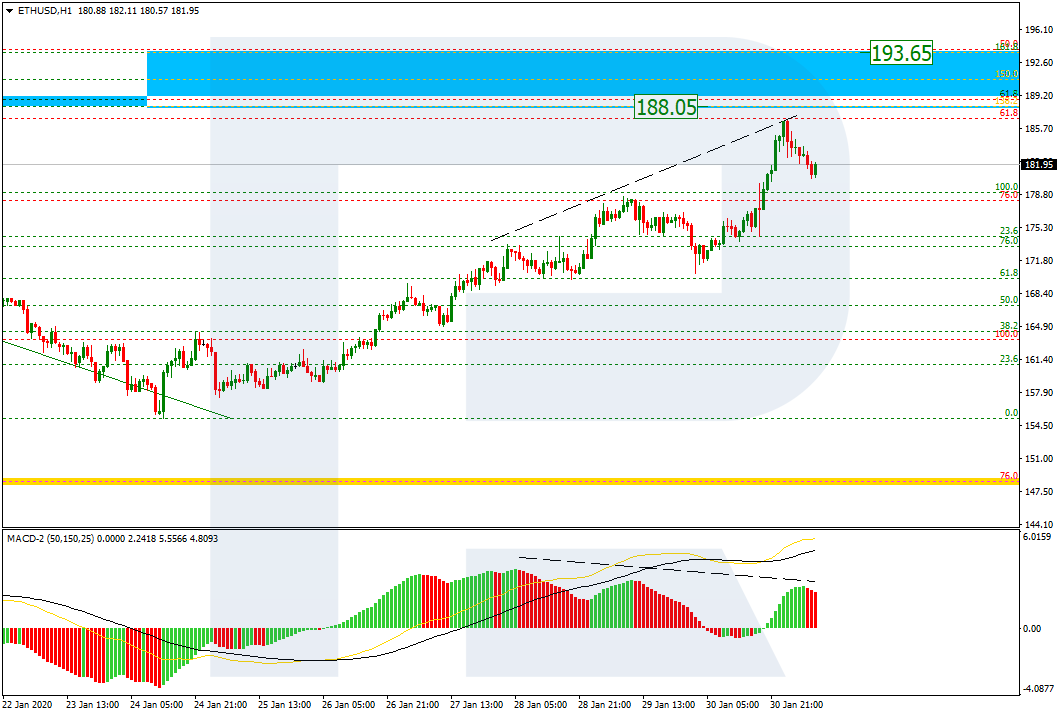
In the H1 chart, the pair is growing towards the local post-correctional extension area between 138.2 and 161.8% fibo at 188.05 and 193.65 respectively.
Attention! Forecasts presented in this section only reflect the author’s private opinion and should not be considered as guidance for trading. RoboForex LP bears no responsibility for trading results based on trading recommendations described in these analytical reviews.
Peter Epstein of Epstein Research discusses recent developments at the company.
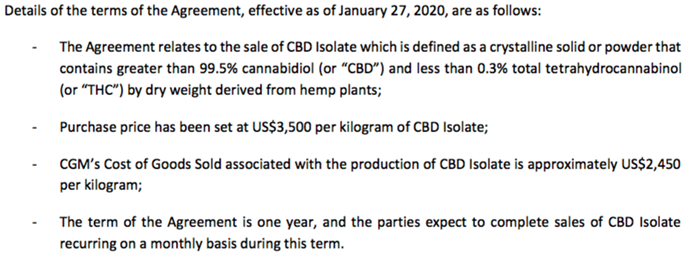
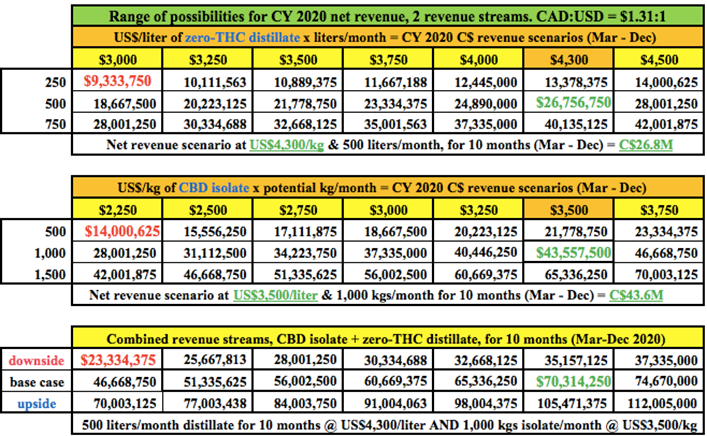
On January 29th, California Gold Mining Inc. (CGM:CSE; CFGMF:OTCQB) announced an agreement with a North Carolina-based hemp-CBD extraction company for the sale of CBD isolate produced by running CGM’s 100%-owned, high-CBD hemp biomass through the private company’s state-of-the-art extraction facility. CBD isolate is a crystalline solid or powder containing >99.5% CBD and <0.3% total THC.
The fixed purchase price is US$3,500/kg of CBD isolate, and CGM’s Cost of Goods Sold (COGS) is expected to be US$2,450/kg, which would be a margin of US$1,050/kg. Up to 1,000 kg of isolate is expected to be sold in March. The company plans to make recurring sales for an initial one-year term.
California Gold’s President & CEO, Mr. Vishal Gupta stated,
“The execution of a second sale agreement soon after executing the first is a testament to the high quality of CGM’s refined products, and management’s commitment to achieving positive cash flow in Q1 2020. CGM’s board recognizes that diversification of the Company’s revenue stream is critical to long-term sustainability of positive cash flow in the nascent hemp-CBD sector. With this in mind, management continues to explore additional avenues for revenue generation from the Company’s hemp business segment.”
If January and February operating activities are successful, CGM would likely acquire additional hemp biomass in North Carolina and/or neighboring Virginia to produce and offer for sale specialty refined products in partnership with the family-owned NC-based extraction company.
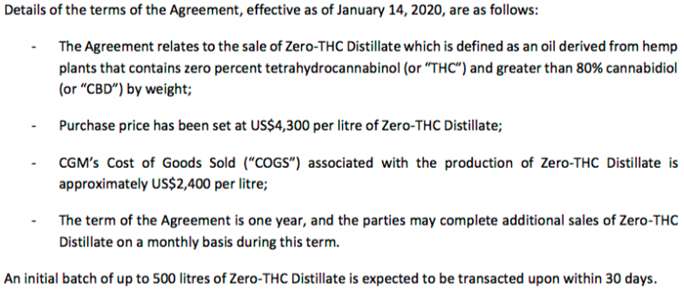
Readers may recall that on January 15th, California Gold announced an agreement with a California-based hemp-CBD brokerage firm for the sale of a specialty, high-end product, zero-THC distillate (zTd), produced from the company’s wholly owned, high-CBD hemp biomass. zTd is an oil derived from hemp plants that contains 0% THC and >80% CBD by weight. The purchase is US$4,300 per liter of zTd. The initial term of the agreement is one year.
According to the press release, CGM’s COGS associated with the production of zTd is expected to be US$2,400/liter, resulting in a margin of US$1,900/liter. After an initial batch of up to 500 liters is delivered next month, CGM hopes to execute additional sales of zTd over the remainder of the year.
CEO Gupta added,
“We are delighted to be in a position to deliver on our promise of realizing CGM’s first revenues and achieving a healthy operating profit in Q1 2020. We are currently negotiating additional sales agreements with interested parties for our bulk, refined, hemp-CBD products. These products were generated from the initial batch of hemp biomass purchased from farmers in Virginia & North Carolina, along with hemp biomass harvested from our wholly owned Grove Road farm in Illinois.”
Management believes there’s higher operating margins and stronger demand for specialty, refined products such as zTd, than for commodity-like crude oil products. CGM’s board is contemplating the purchase of additional high CBD-content hemp biomass to get converted into high-end refined products once the current inventory is sold.
In the chart below are some CY 2020 net revenue (net of a 5% sales commission) scenarios (in CAD$ FX: 1.31:1). These are indicative figures only, based on press released data. Both the range of monthly production quantities (CBD isolate & zero-THC distillate), as well as the pricing for each product, could end up outside the ranges depicted in the chart.
The range of total net annual revenue from both products could approach or exceed C$100 million. To be more conservative, C$40-C$60 million might be a reasonable expectation, IF EVERYTHING GOES REASONABLY AS PLANNED. That was a big IF for most companies last year. Make no mistake, execution will be a major challenge again in 2020. Even if CGM’s revenue comes in at the low end of the chart, around C$23 million, that would still be a great outcome.
The company’s enterprise value (EV) [market cap + debt cash] is C$20 million. California Gold is trading at under 1x 2020 (expected) net revenue. Readers should note that revenue could absolutely come in below the C$23 million mentioned above.
Two of the primary risks are 1) operating logisticsunexpected downtime, delays in permits, approvals or supplies, longer extraction runtimes, etc., and 2) lower pricing. Pricing has fallen >50% in the past nine months, but it seems to have leveled out.
If CGM is trading at under 1x 2020e net revenue, (a very low market valuation) it would be in the top 6% for that metric of the 302 names I’m tracking. Among the 18 trading under 1x revenue, some have share prices below $0.05, some are down >90% from last year’s highs (CGM is down 59%), some are in cut-throat, low-margin competitive segments like cannabis delivery, beverages or the selling of supplies/equipment. By contrast, CGM expects strong margins.
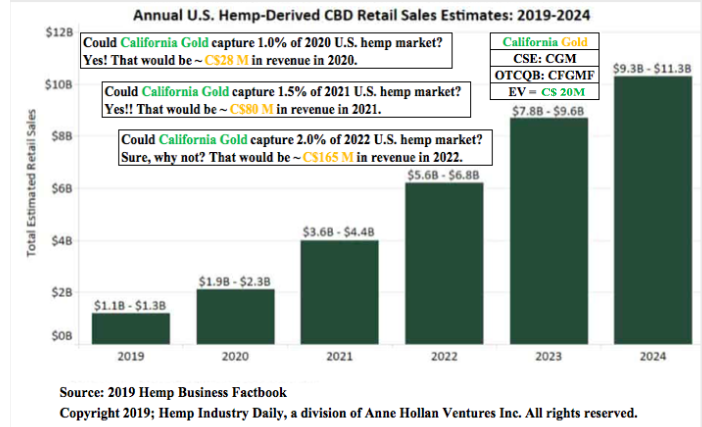
California Gold would be trading at under a 1x 2020e EV/EBITDA multiple if it were to generate $70.3 million in net revenue (see chart above). Now that CGM is on the cusp of revenue and positive cash flow, one can start to wonder about acquisitions, M&A. Readers should glance at the Annual U.S. Hemp-Derived CBD Retail Sales Estimates: 2019-2024 chart below. Could CGM capture just 1.0% of the 2020 hemp-CBD market? YES.
Will CGM be an acquirer or be the one taken out? I believe a takeout of CGM will not come before 2021. The company has too much going for it, they will soon be cashed up in an epic buyer’s market of distressed assets.
On the other hand, once CGM has ramped up revenue and cash flow well into the tens of millions, it will become a prime takeover target itself. Management runs a tight ship, there are just five employees and minimal options / warrants or overhead. I expect that net revenue divided by employee will be 10x to 25x higher than that of the major MSOs and LPs. For example, Canopy Growth has over 2,700 employees, Aurora Cannabis over 1,600.
This is a very exciting time for California Gold and any company with ample cash liquidity. A lot of companies, large and small, blew up in 2019 or are in the process of blowing up this year. For instance, roughly 20% of the names I’m tracking have over 300 million shares outstanding, some over 500 million. CGM has 60 million shares outstanding.
Surprisingly, about 25% have negative working capital balances (more short-term liabilities than assets). Slightly over 100 companies (34%) have less than or equal to $500,000 in trailing 12-month revenue. Of course, some of these names will see revenue soar in 2020, but the vast majority won’t achieve >$10 or $20 million this year. CGM could end 2020 with trailing 12-month revenue in the top 70 or 80, but it’s currently ranked about #180 on my list.
Even more exciting, if the company can deliver strong margins, they could be in the top 50 or 60 in terms of annual EBITDA. Companies ranked #50 to #80 range in EVs from ~$75 million to ~$155 million, vs. CGM at $20 million. So, there’s substantial upside potential (and still very significant risk) in the shares of California Gold Mining Inc. [CGM] (CSE: CGM) / (OTCQB: CFGMF).
Investors should know by mid-year how management is executing, if they run into any problems and if pricing holds up. This is all in the U.S., 100% hemp, no cannabis. There should be lots of news on existing operations and possibly acquisitions/joint ventures.
Peter Epstein is the founder of Epstein Research. His background is in company and financial analysis. He holds an MBA degree in financial analysis from New York University’s Stern School of Business.
Streetwise Reports Disclosure: 1) Peter Epstein’s disclosures are listed below. 2) The following companies mentioned in the article are billboard sponsors of Streetwise Reports: None. Click here for important disclosures about sponsor fees. The information provided above is for informational purposes only and is not a recommendation to buy or sell any security. 3) Statements and opinions expressed are the opinions of the author and not of Streetwise Reports or its officers. The author is wholly responsible for the validity of the statements. The author was not paid by Streetwise Reports for this article. Streetwise Reports was not paid by the author to publish or syndicate this article. Streetwise Reports requires contributing authors to disclose any shareholdings in, or economic relationships with, companies that they write about. Streetwise Reports relies upon the authors to accurately provide this information and Streetwise Reports has no means of verifying its accuracy.
4) The article does not constitute investment advice. Each reader is encouraged to consult with his or her individual financial professional and any action a reader takes as a result of information presented here is his or her own responsibility. By opening this page, each reader accepts and agrees to Streetwise Reports’ terms of use and full legal disclaimer. This article is not a solicitation for investment. Streetwise Reports does not render general or specific investment advice and the information on Streetwise Reports should not be considered a recommendation to buy or sell any security. Streetwise Reports does not endorse or recommend the business, products, services or securities of any company mentioned on Streetwise Reports. 5) From time to time, Streetwise Reports LLC and its directors, officers, employees or members of their families, as well as persons interviewed for articles and interviews on the site, may have a long or short position in securities mentioned. Directors, officers, employees or members of their immediate families are prohibited from making purchases and/or sales of those securities in the open market or otherwise from the time of the interview or the decision to write an article until three business days after the publication of the interview or article. The foregoing prohibition does not apply to articles that in substance only restate previously published company releases.
Disclosures: The content of this article is for information only. Readers fully understand and agree that nothing contained herein, written by Peter Epstein of Epstein Research [ER], (together, [ER]) about California Gold Mining, including but not limited to, commentary, opinions, views, assumptions, reported facts, calculations, etc. is not to be considered implicit or explicit investment advice. Nothing contained herein is a recommendation or solicitation to buy or sell any security. [ER] is not responsible under any circumstances for investment actions taken by the reader. [ER] has never been, and is not currently, a registered or licensed financial advisor or broker/dealer, investment advisor, stockbroker, trader, money manager, compliance or legal officer, and does not perform market making activities. [ER] is not directly employed by any company, group, organization, party or person. The shares of California Gold Mining are highly speculative, not suitable for all investors. It is assumed and agreed upon by readers that they will consult with their own licensed or registered financial advisors before making any investment decisions.
At the time this article was posted, Peter Epstein owned shares of California Gold Mining Inc. and the Company was an advertiser on [ER].
Readers understand and agree that they must conduct their own due diligence above and beyond reading this article. While the author believes he’s diligent in screening out companies that, for any reasons, are unattractive investment opportunities, he cannot guarantee that his efforts will (or have been) successful. [ER] is not responsible for any perceived, or actual, errors including, but not limited to, commentary, opinions, views, assumptions, reported facts, financial calculations, etc., or for the completeness of this interview or future content. [ER] is not expected or required to subsequently follow or cover events & news, or write about any particular company. [ER] is not an expert in any company, industry sector or investment topic.
The EUR/USD currency pair has moved up after a prolonged decline. The trading instrument has updated its local highs. At the moment EUR/USD quotes are consolidated in the range of 1.10100-1.10400. The technical picture signals a further correction of the single currency against the USD. Investors continue to assess the risks of further coronavirus spreading. We expect the release of important statistical data. We recommend opening positions from key levels.
The Economic News Feed for 31.01.2020:
– Consumer Price Index (EU) – 12:00 (GMT+2:00);
– GDP Report (EU) – 12:00 (GMT+2:00);
– Personal Spending (US) – 15:30 (GMT+2:00);
Indicators do not give accurate signals: the price has fixed between 50 MA and 100 MA.
The MACD histogram is in the positive zone, but below the signal line, which gives a weak signal to buy EUR/USD.
The Stochastic Oscillator is in the neutral zone, the %K line is above the %D line, which indicates a bullish mood.
Trading recommendations
Support levels: 1.10100, 1.09900
Resistance levels: 1.10400, 1.10600, 1.10800
If the price fixes above 1.10400, expect the quotes to correct toward 1.10600-1.10800.
Alternatively, the quotes could descend toward 1.09900-1.09700.
The GBP/USD currency pair
Technical indicators of the currency pair:
Prev Open: 1.30186
Open: 1.30856
% chg. over the last day: +0.50
Day’s range: 1.30814 – 1.31407
52 wk range: 1.1959 – 1.3516
GBP/USD quotes are showing positive dynamics. During yesterday and today’s trading the sterling strengthened against the US dollar by more than 100 points. The Bank of England, as expected, kept the main parameters of monetary policy at the same level. Today the UK will officially withdraw from the EU. At the moment, the trading instrument is consolidated in the range of 1.31000-1.31400. You should open positions from these marks.
Publication of important economic reports from the UK is not planned.
The indicators signal the strength of buyers: the price has fixed above 50 MA and 100 MA.
Histogram of MACD is in the positive zone, which indicates a bullish sentiment.
The Stochastic Oscillator is located in the overbought zone, the %K line crossed the %D line. No signals at the moment.
Trading recommendations
Support levels: 1.31000, 1.30750, 1.30300
Resistance levels: 1.31400, 1.31700
If the price fixes above 1.31400, expect the quotes to rise toward 1.31700-1.32000.
Alternatively, the quotes could descend toward 1.30700-1.30500.
The USD/CAD currency pair
Technical indicators of the currency pair:
Prev Open: 1.31974
Open: 1.32042
% chg. over the last day: +0.08
Day’s range: 1.31952 – 1.32339
52 wk range: 1.2949 – 1.3566
The USD/CAD currency pair is still dominated by bullish sentiments. The trading instrument has updated local highs again. At the moment USD/CAD quotes are testing resistance level 1.32350. The mark 1.31900 is a key support. Technical correction is not ruled out in the nearest future. Today participants of financial markets will evaluate important economic releases from Canada. Positions should be opened from key levels.
At 15:30 (GMT+2:00) a report on Canadian GDP will be published.
The indicators signal the strength of buyers: the price has fixed above 50 MA and 100 MA.
MACD histogram is in the positive zone, which indicates a bullish sentiment.
The Stochastic Oscillator is located in the overbought zone, the %K line crossed the %D line. No signals at the moment.
Trading recommendations
Support levels: 1.31900, 1.31700, 1.31500
Resistance levels: 1.32350, 1.32600
If the price fixes above 1.32350, expect further growth toward 1.32600-1.32800.
Alternatively, the quotes could correct toward 1.31600-1.31400.
The USD/JPY currency pair
Technical indicators of the currency pair:
Prev Open: 108.983
Open: 108.977
% chg. over the last day: -0.01
Day’s range: 108.878 – 109.136
52 wk range: 104.45 – 113.53
USD/JPY currency pair continues to trade in a long flat. There is no defined trend. The trading instrument tests the local supply and demand areas: 108.600-108.750 and 109.100-109.250, respectively. USD/JPY quotes have potential for recovery. We recommend you to pay attention to the dynamics of US government securities yield. Positions should be opened from key levels.
The news background on Japanese economy is rather calm.
Indicators do not give accurate signals: the price has crossed 50 MA.
Histogram of MACD is in positive zone, which indicates bullish moods.
The Stochastic Oscillator is in the neutral zone, the %K line is below the %D line, which gives a sell signal for USD/JPY.
Trading recommendations
Support levels: 108.750, 108.600
Resistance levels: 109.100, 109.250, 109.650
If the price fixes above 109.100, USD/JPY quotes are expected to rise. Potential movement towards 109.400-109.600.
Alternatively, the USD/JPY pair may decline to 108.500-108.300.
 Michael is an experienced financial trader using Forex, Commodities and Cryptocurrencies. In addition to trading, he runs businesses, trains traders and develops trading technology products. His other passions are boxing and traveling.