The Analytical Overview of the Main Currency Pairs on 2020.02.13

by JustForex

The EUR/USD currency pair

Technical indicators of the currency pair:
  • Prev Open: 1.09152
  • Open: 1.08738
  • % chg. over the last day: -0.37
  • Day’s range: 1.08653 – 1.08765
  • 52 wk range: 1.0879 – 1.1572

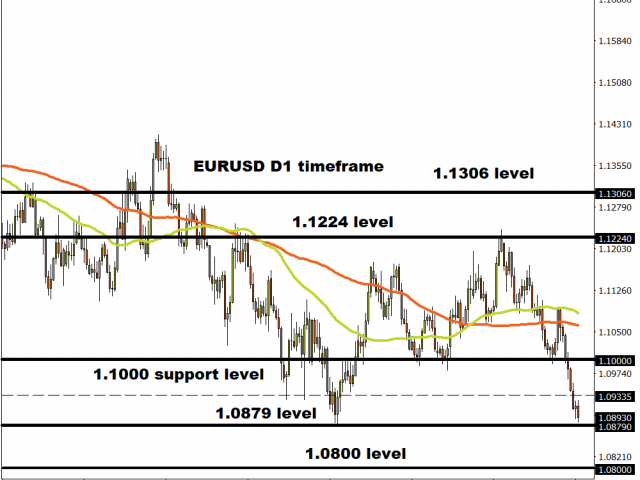
The single currency keeps losing positions against USD. Yesterday the drop in quotations exceeded 40 points. At the moment the trading instrument is consolidating near the local support at 1.08650. The round level 1.09000 is already a mirror resistance. In the nearest future the technical correction after the prolonged fall is not ruled out. Today investors will evaluate economic reports from the USA. We recommend opening positions from key levels.

The Economic News Feed for 13.02.2020:

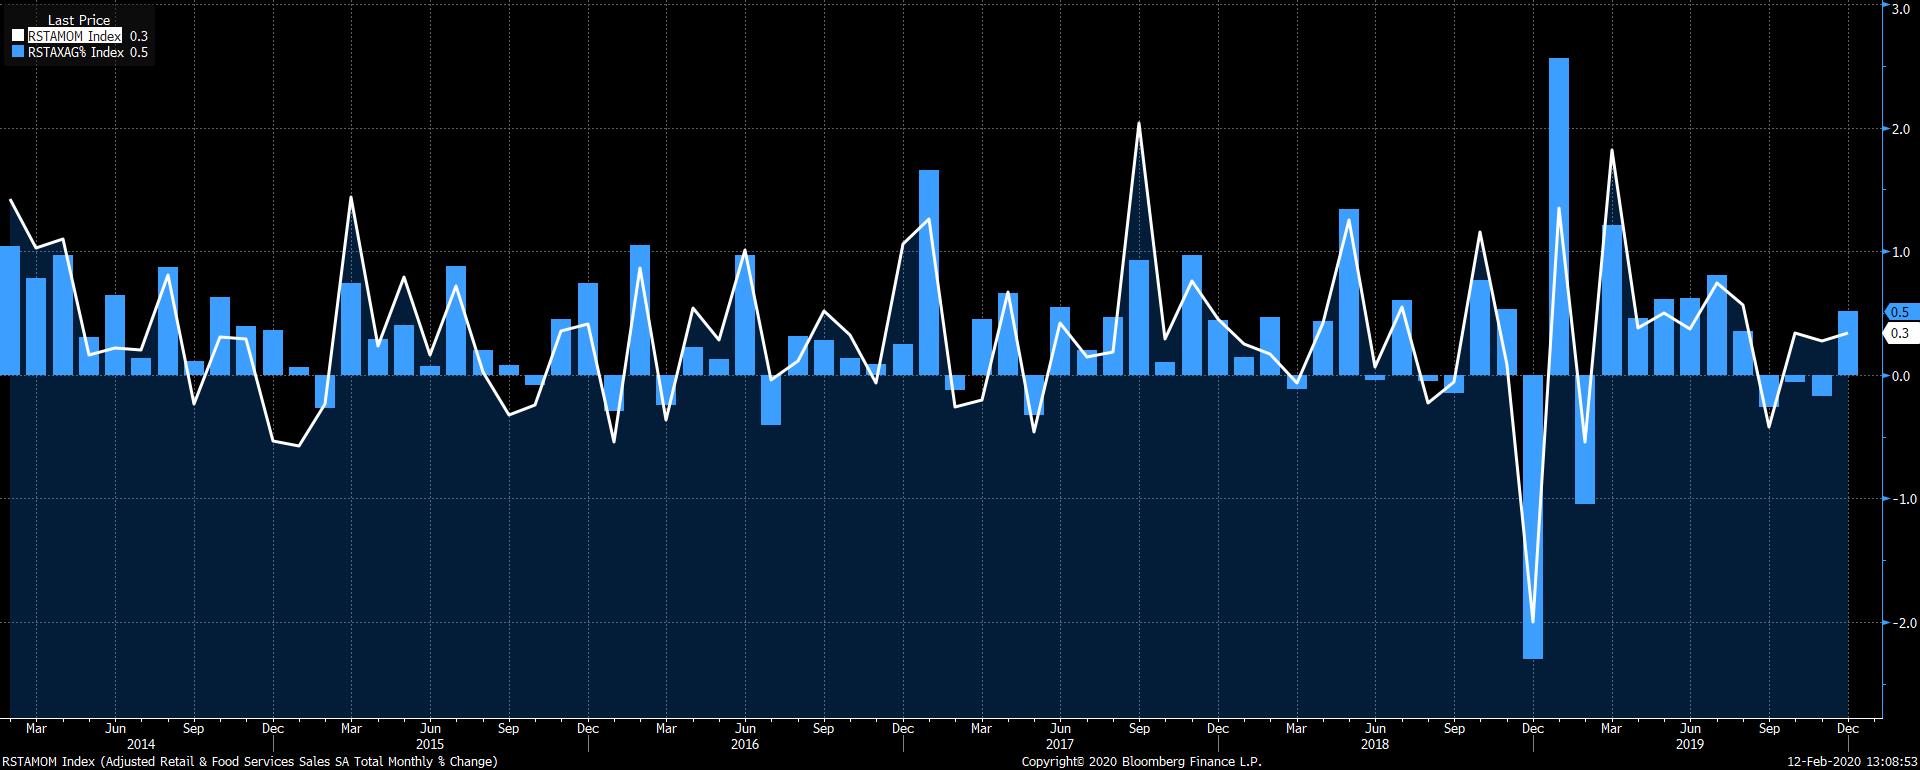
  • – US inflation data (US) – 15:30 (GMT+2:00);
  • – Initial Jobless Claims (US) – 15:30 (GMT+2:00);
EUR/USD

The indicators signal the sellers’ strength: the price has fixed below 50 MA and 100 MA.

The MACD histogram is in the negative zone, which indicates a bearish sentiment.

The Stochastic Oscillator is in the neutral zone, the %K line is above the %D line, which gives a signal to buy EUR/USD.

Trading recommendations
  • Support levels: 1.08650, 1.08300
  • Resistance levels: 1.09000, 1.09400, 1.09700

If the price fixes below 1.08650, expect the quotes to descend toward 1.08300-1.08100.

Alternatively, the quotes could grow toward 1.09300-1.09500.

The GBP/USD currency pair

Technical indicators of the currency pair:
  • Prev Open: 1.29518
  • Open: 1.29597
  • % chg. over the last day: +0.04
  • Day’s range: 1.29441 – 1.29647
  • 52 wk range: 1.1959 – 1.3516

The technical picture on the GBP/USD currency pair is ambiguous. At the moment the sterling is consolidating. Financial markets participants are waiting for additional drivers. The local support and resistance levels are 1.29400 and 1.29800, respectively. The trading instrument has potential for recovery. We recommend to pay attention to the US economic news background. Positions should be opened from key levels.

Publication of important economic reports from the UK is not planned.

GBP/USD

Indicators do not give accurate signals: 50 MA crossed 100 MA.

MACD histogram is near the 0 mark.

The Stochastic Oscillator is located in the neutral zone, the %K line is above the %D line, which indicates a bullish mood. .

Trading recommendations
  • Support levels: 1.29400, 1.28750
  • Resistance levels: 1.29800, 1.30100, 1.30450

If the price fixes above 1.29800, expect the quotes to rise toward 1.30200-1.30500.

Alternatively, the quotes could descend toward 1.29000-1.28800.

The USD/CAD currency pair

Technical indicators of the currency pair:
  • Prev Open: 1.32870
  • Open: 1.32516
  • % chg. over the last day: -0.23
  • Day’s range: 1.32406 – 1.32646
  • 52 wk range: 1.2949 – 1.3566

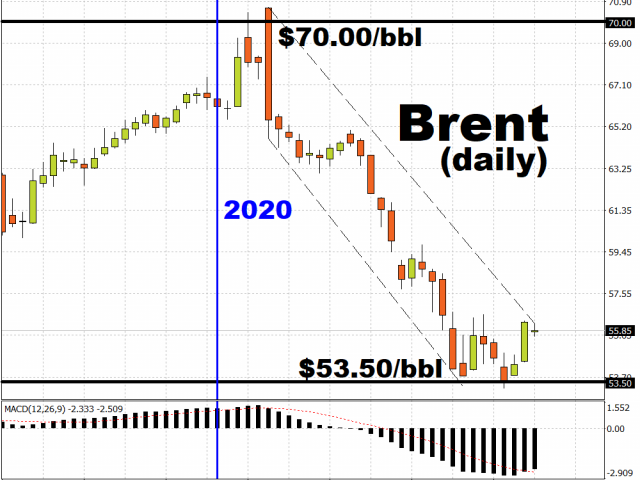
Bearish sentiment prevails on the USD/CAD currency pair. The trading instrument has set new local lows. At the moment the CAD is consolidating. The key range is 1.32400-1.32700. The technical pattern signals further correction of USD/CAD quotes. Additional support for the Canadian dollar is provided by the oil price recovery. Positions should be opened from key levels.

The Economic News Feed for 13.02.2020:

USD/CAD

Indicators point to the strength of sellers: the price has fixed below 50 MA and 100 MA.

Histogram of MACD is in the negative zone, which indicates a bearish sentiment.

The Stochastic Oscillator is in the neutral zone, the %K line is above the %D line, which gives a signal to buy USD/CAD.

Trading recommendations
  • Support levels: 1.32400, 1.32200, 1.31900
  • Resistance levels: 1.32700, 1.33000, 1.33250

If the price fixes below 1.32400, expect further movement toward 1.32000.

Alternatively, the quotes could grow toward 1.32900-1.33100.

The USD/JPY currency pair

Technical indicators of the currency pair:
  • Prev Open: 109.783
  • Open: 110.071
  • % chg. over the last day: +0.13
  • Day’s range: 109.748 – 110.090
  • 52 wk range: 104.45 – 113.53

The USD/JPY currency pair is consolidating near the two-month highs. The technical picture is ambiguous. At the moment local support and resistance levels are at 109.700 and 110.150, respectively. Technical correction is not ruled out in the nearest future. Today we recommend to pay attention to the economic releases, as well as the dynamics of the US government securities yield. Positions should be opened from key levels.

The news background on Japanese economy is calm.

USD/JPY

Indicators do not give an accurate signal: 50 MA crossed 100 MA.

MACD histogram is near the 0 mark. No signals at the moment.

The Stochastic Oscillator is located in the oversold area, the %K line has crossed the %D line. There are no signals at the moment.

Trading recommendations
  • Support levels: 109.700, 109.550, 109.300
  • Resistance levels: 110.150, 110.400

If the price fixes above 110.150, consider buying USD/JPY. The movement will tend toward 110.400-110.600.

Alternatively, the quotes could correct toward 109.400-109.200.

by JustForex

The Dollar Index Has Become Stable. Coronavirus Is Still in the Spotlight

by JustForex

The US dollar has become stable against a basket of major currencies. The dollar index (#DX) is consolidating near local highs. Yesterday, Fed Chairman Powell gave a speech for Congress again. The official said that the Fed had little reason to cut rates, as the country’s economy was in good condition despite the spread of coronavirus.

Today, markets are under pressure after China’s Hubei province reported nearly 15,000 new cases of the disease, as the method of counting infected people has changed. At the same time, the number of deaths in the province increased by a record 242 to 1.310. These events support the “safe haven” currencies. The single currency has reached two-year lows.

The “black gold” prices are moving in different directions. Currently, futures for the WTI crude oil are testing the $50.85 mark per barrel.

Market Indicators

Yesterday, there was the bullish sentiment in the US stock market: #SPY (+0.64%), #DIA (+0.95%), #QQQ (+0.97%).

The 10-year US government bonds declined. At the moment, the indicator is at the level of 1.58-1.59%.

The Economic News Feed for 13.02.2020:
  • – Data on inflation in the US at 15:30 (GMT+2:00);
  • – Initial jobless claims in the US at 15:30 (GMT+2:00).

by JustForex

US Jan 2020 Retail Sales Preview

By Orbex

The monthly retail sales report will be coming out tomorrow. The retail sales report will indicate the level of spending by US consumers at retail outlets during the first month of the year. The overall consensus for January is somewhat conservative.

The data, which will be released by the US Department of Commerce, is forecast to show that excluding autos, retail sales will rise at a slower pace of 0.4%. This marks a slower pace of increase comparing to the 0.7% increase earlier.

The retail sales control group in January is expected to rise 0.4%, down from 0.5% previously. The headline retail sales for January is tipped to rise 0.3%, marking the same pace of increase as the month before.

Other measures of consumer data for January points to a strong month. Both the Conference Board and the University of Michigan’s report on consumer sentiment were higher. It could translate to a possible increase in retail spending during the month.

The consumer confidence report underlines the easing of trade tensions between the United States and China. Both economies agreed to a Phase one trade deal with China promising to increase its imports from the United States. The trade tension was a major concern. Recent economic data shows a modest pick-up in activity in the manufacturing sector.

After five months of contraction, the US manufacturing sector rebounded, rising above the 50-level of the index, suggesting expansion. Based on the broader improvement across various measures of the economy, it is possible that the retail sales report could come out slightly better, comparing to the previous month.

Modest Pick-Up in Auto Sales in January

Auto sales in the United States contracted at a modest pace of 0.2% on a year over year basis, non-seasonally adjusted. On a seasonally adjusted basis, auto sales rose 0.9% on the month with an annualized rate of 16.85 million units.

Despite the monthly pickup, the data shows that the underlying trend has been one that is declining since the fourth quarter of 2019. One of the reasons behind this is due to the General Motor’s workers strike.

This brought about considerable volatility in the monthly sales data. The sales from General Motors accounts for nearly 20% of the sales in January. The company alone recorded a 13.8% increase on the year after falling 14% on the year in October during the strike period.

With the modest pick up in auto sales for January, it is quite likely that we could see a pickup in the retail sales activity for the month. However, the pace of increase could be sluggish.

In December 2019, the retail sales data rose for the third consecutive month. This came despite a cut back in motor vehicle sales. The overall data underlined the view that the US economy was maintaining a moderate pace of growth into the close of the year.

Now, with the uptick in the auto sales report, we could expect to see a slightly higher print than forecast. There is also the possibility that there could be an upside revision to the figures for December 2019.

Impact of the US Retail Sales Report

The impact from today’s retail sales report will be small comparing to other big-ticket items. The US economy has been on an upward swing over the past few reports. The outcome of the retail sales will of course be felt on the Q1 2020 GDP data.

As of last week, the forward-looking indicators point to a 2.9% increase in growth in the first quarter period to date. Thus, a strong retail sales data will certainly keep this growth rate steady.

By Orbex


HK50 Analysis: Improving data bullish for HK50

By IFCMarkets

Improving data bullish for HK50

Hong Kong’s economic data in the last week were better than expected: private sector contraction was slower than expected in January, and foreign reserves rose more than expected. While the January reading of purchasing managers index was below 50 again, indicating contraction in the private sector, it was higher than expected: 46.8 instead of 45.2. Though indicating contraction again, the positive factor was the reading was higher than the value of 42.1 registered for the previous month, meaning a slowing of contraction in private sector activities. Another positive development was increase in foreign reserves to $445.9 billion from $441.3 billion. Improving data are bullish for HK50. The positive readings are welcome change after GDP advance report indicating economy contraction speeded up in the fourth quarter of 2019. And following the disappointing GDP report was the December retail sales report, indicating sales continued to fall albeit at slightly slower rate: 21% over year after 25.5% in November. Further deterioration of Hong Kong economic performance is a downside risk.

IndicatorVALUESignal
RSINeutral
MACDBuy
Donchian ChannelNeutral
MA(200)Buy
FractalsNeutral
Parabolic SARBuy


Summary of technical analysis

OrderBuy
Buy stopAbove 27915.8
Stop lossBelow 27075.5

Market Analysis provided by IFCMarkets

Asian markets mixed amid conflicting signals on Covid-19 outbreak

By Han Tan, Market Analyst, ForexTime

Asian stocks and currencies are mixed, as markets were given seemingly conflicting signals on the spread of Covid-19. Investors were initially fed with news that the rate of infection was slowing, only for such optimism to be dashed by subsequent reports that China’s Hubei province saw 14,840 new confirmed cases and 242 deaths on that same day, after the authorities revised their diagnosis methods.

This latest development shows that investors cannot afford to be complacent over this downside risk, especially considering the potential threat it poses to the global economy. With such considerations in mind, Asian stocks were reluctant to full-heartedly join in Wall Street’s advance, after the Dow Jones Index closed above the 29,500 psychological level for the first time in its history.


Gold buoyed by persistent concerns over coronavirus

Such stubborn uncertainties are keeping Gold prices supported in the mid- to upper-$1500 range, as demand for safe haven assets remain resolute. Until the outbreak can show material signs that it is stabilizing, Gold should be kept within that $1545 to $1590 range. The $1600 psychological level is still within reach, especially if Gold bulls are jolted into action by signs that the situation has taken a sudden turn for the worse, and if investors get confirmation in the hard data that the outbreak is making a larger-than-expected dent in major economies.


Oil markets pin hopes on more OPEC+ supply cuts

Major Oil producers are also contending with the uncertainties stemming from the Covid-19 outbreak, which is prompting calls for supply-side intervention in the markets once again. Although technical experts within OPEC+ have recommended an additional supply cut of 600,000 barrels per day, there has yet to be an official decision by the alliance.

Market expectations for deeper production cuts are arresting Brent’s 14.5 percent year-to-date decline, keeping Brent crude above $53.50/bbl for the time being. Should OPEC+ decide against raising its supply cuts at its next meeting in March, while the Coronavirus outbreak continues dampening global demand for Oil, that could send Brent into sub-$50/bbl regions.


Disclaimer: The content in this article comprises personal opinions and should not be construed as containing personal and/or other investment advice and/or an offer of and/or solicitation for any transactions in financial instruments and/or a guarantee and/or prediction of future performance. ForexTime (FXTM), its affiliates, agents, directors, officers or employees do not guarantee the accuracy, validity, timeliness or completeness, of any information or data made available and assume no liability as to any loss arising from any investment based on the same.


Forex-Time-LogoArticle by ForexTime

ForexTime Ltd (FXTM) is an award winning international online forex broker regulated by CySEC 185/12 www.forextime.com

Main US indexes notch record closes again

By IFCMarkets

Dollar strengthening stalls

US stock market closed at record highs again on Wednesday as new cases of coronavirus infection in China reported over the last 24 hours declined for a second day. The S&P 500 advanced 0.7% to fresh record 3379.45. The Dow Jones industrial average rose 0.9% to 29551.42. Nasdaq gained 0.9% to new record 9725.96. The dollar strengthening accelerated despite report US budget deficit rose more than expected in January. The live dollar index data show the ICE US Dollar index, a measure of the dollar’s strength against a basket of six rival currencies, rose 0.3% to 99.0 but is lower currently. Futures on stock indexes point to lower openings today.

DAX 30 led European indexes recovery

European stocks ended at record highs on Wednesday despite weak data. EUR/USD declined yesterday while GBP/USD continued climbing with dynamics reversed for both pairs currently. The Stoxx Europe 600 ended up 0.6% led by auto shares despite report euro zone manufacturing output fell more than expected in December. Germany’s DAX 30 rose 0.9% to 13749.78. France’s CAC 40 advanced 0.8% while UK’s FTSE 100 added 0.5% to 7594.37.

DE30 rallies above MA(50) 2/13/2020 Market Overview IFC Markets chart

Shanghai Composite leads Asian indexes retreat

Asian stock indices are mostly lower today as China’s Hubei province reported sharply higher number of new coronavirus outbreak cases. Nikkei declined 0.1% to 23827.73 as yen resumed advancing against the dollar. Markets in China are down: Shanghai Composite Index is 0.7% lower while Hong Kong’s Hang Seng Index is losing 0.4% higher. Australia’s All Ordinaries Index however recovered 0.2% despite resumed Australian dollar decline against the greenback.

Brent edges down

Brent futures prices are lower today. Prices rebounded on Wednesday despite EIA report US crude oil inventories rose by bigger than expected 7.5 million barrels last week: April Brent added 3.3% to $55.79 on Wednesday.

Gold rises as Dollar weakens

Gold prices are extending gains while dollar inches down. The price of an ounce of gold for April delivery gained 0.1% to $1,571.60 Wednesday.

Market Analysis provided by IFCMarkets

Note:
This overview has an informative and tutorial character and is published for free. All the data, included in the overview, are received from public sources, recognized as more or less reliable. Moreover, there is no guarantee that the indicated information is full and precise. Overviews are not updated. The whole information in each overview, including opinion, indicators, charts and anything else, is provided only for familiarization purposes and is not financial advice or а recommendation. The whole text and its any part, as well as the charts cannot be considered as an offer to make a deal with any asset. IFC Markets and its employees under any circumstances are not liable for any action taken by someone else during or after reading the overview.

The Virus Outbreak Is Testing Philippine Preparedness

By Dan Steinbock

The Philippines is well-positioned to cope with the economic impact of the virus outbreak, but is not immune to its human costs.

Since the Philippines is exceptionally prone to both extreme climate and geological events, Senator “Bong” Go’s bill for the creation of a Department of Disaster Resilience should be taken seriously. As the outbreak has shown, new calamities are just a matter of time. Proactive preparation matters.  

The human costs of the virus have so far been negligible in the Philippines. While the number of patients under investigation has climbed to almost 320, of which two-thirds are Filipinos and a third Chinese nationals. As of yet, there remain only three positive cases in the Philippines and all are linked with Wuhan, the epicenter of the crisis.

But even if human costs can be kept to the minimum, economic impact will be tangible.

Expected economic impact

In 2020, Philippine growth prospects were initially seen as more favorable, In particular, the ramped-up government spending related to the “Build, Build, Build” program was seen to buttress growth. To degree, structural growth potential and Duterte government’s economic policies can offset some of the adverse forces associated with the trade wars, the Taal eruption, even the virus outbreak. Yet, new political policy mistakes, such as the 2019 budget debacle, could change the picture.

After the set of rate cuts to support growth, lower borrowing costs and liquidity from reserve-rate-requirement (RRR) reductions can still support domestic demand. As elsewhere in Southeast Asia, the outbreak has already affected travel and tourism.

Since China is the second-largest source of tourists in the country, the travel ban from the Chinese mainland coupled with the expected 10% reduction in visitors from other countries will penalize economic output. The decline is estimated at $215 million within a month, by the National Economic and Development Authority.

If the outbreak persists with its current impact level until June, the GDP reduction is anticipated to climb to 0.3%, according to NEDA’s chief Ernesto Pernia. If it will prevail until December, the reduction would more than double to 0.7% ($2.6 billion).

Growth scenarios

In view of the current outbreak data, the estimate based on shorter duration still seems more likely. Yet, its economic impact could prove more significant than anticipated. If, however, the outbreak persists until the end of summer, its adverse impact would prove greater than anticipated (on the basic scenarios, see my previous TMT column of Feb 3, 2020).

Before the outbreak, the International Monetary Fund (IMF) projected Philippine GDP growth to rise to 6.3% in 2020, underpinned by government spending acceleration and recent monetary policy easing. Meanwhile, above-consensus forecasts hovered at 6.7%. S

ince the domestic drivers of the Philippine growth remain solid, a benign virus impact scenario might not undermine such horizons.

Yet, the critical caveat remains. These scenarios depend on the duration and severity of the outbreak – and how smoothly it can be managed in the Philippines.

About the Author:

Dr. Dan Steinbock is an internationally recognized strategist of the multipolar world and the founder of Difference Group. He has served at the India, China and America Institute (USA), Shanghai Institutes for International Studies (China) and the EU Center (Singapore). For more, see https://www.differencegroup.net

The original commentary was released by The Manila News on Feb. 10, 2020. The data has been updated (Feb 11, 2020)


Shipping Rates Plunge, Commodities and Stocks May Follow

By TheTechnicalTraders – An almost immediate reaction to the Coronavirus outbreak in China and throughout most of the world has sent shock-wave through the global markets – particularly seen in Shipping and Oil.  The actions within China to attempt to contain the virus spread include shutting down entire cities and setting up mass quarantine events.  It is estimated that as many as 8+ million people were quarantined within cities in China throughout the Chinese New Year.

Chinese President, Xi Jinping, warned recently that the Coronavirus, and the efforts to stop it, may greatly reduce the Chinese economy over the next few months.  The Chinese President urged top officials to refrain from “more restrictive measures” to contain the virus.  It is our opinion that more restrictive measures are essential to efforts to contain the spread of this virus and that further contraction in the Chinese economy, as well as other economies, are almost set in stone at this point.

Information we’ve received from some friends living in China and Hong Kong suggest travel is very restricted, face masks are very scarce, people are staying inside their homes and surviving as family units within very close contact with one another.  They are scared, trapped and unable to do anything other than try to wait this out.  Imagine what this is doing to the local economies, shops, offices, and businesses?

Reflectively, global shipping rates have collapsed over the past 30+ days as one of the first signs of the contraction in the global markets.  As of December 31, 2019, both Tanker and Dry-Bulk rates were hovering near $14,000 per day.  Now, this rate is near $2500 per day – a -82% decrease.  As you consider the broader aspects of this massive decrease in shipping rates, consider the global contagion event that may setup if the Belt-Road region is adversely hit with the Corona Virus.

Source: Bloomberg.com

SEA Shipping Sector ETF – Daily Chart

Shipping stocks are taking a beating. Factories are shut down, the product is not being shipped, and even product ready to be shipped many don’t want to take delivery for the time being.

From a short term standpoint, this sector is looking oversold, but depending on how much the virus spreads we could see another 20% from the current price.

China’s Belt-Road Infrastructure Projects

China’s Belt-Road Initiative consists of massive infrastructure, port, and other projects throughout Europe, Asia, India, Pakistan, Iran, Turkey, Russia, Africa, and other nations.  These projects have been initiated over the past 5+ years and are well underway.  We believe the spread of the Coronavirus may follow a path along with the Belt and Road projects and potentially infect a larger number of individuals over the next 30+ days than originally expected.  If this virus moves into the Middle East or Africa, containment may become very difficult.

The reality is that Shipping and Commodities could see a dramatic price decline as this virus outbreak continues over the next 60+ days.  Reports are already starting to hit the news wires that Autos and manufacturing supplies are starting to pile up and ports in China.  Without a functioning manufacturing sector and workers to keep everything running, China’s economy will grind to a halt very quickly.

This translates into lower Oil prices, lower raw material prices and higher metals prices.  A capital shift will continue to take place throughout the world where capital will move away from risky environments and towards more secure investment environments.  Thus, capital will move away from Asia, India, the Middle East and potentially Europe and towards the USA, Canada and possibly Mexico.  Everything depends on what happens over the next 60 to 90+ days with regards to this virus outbreak.

Monthly Crude Oil chart

This Monthly Crude Oil chart shows how quickly Oil rotated lower in January 2020.  Currently, Oil is trading near $50 per barrel and may break lower towards the $44 to $46 price level before finding any real support.  Overall, our research team believes Oil may reach as low as $35 to $36 ppb before reaching a bottom.  You can read our earlier research here: https://www.thetechnicaltraders.com/oil-begins-to-move-lower-will-our-predictions-come-true.  Within that research post, dated November 19, 2019, we highlighted our earlier predictive modeling research from July 2019 suggesting Oil would break substantially lower in November 2019 and again in February 2020.  We predicted this downside move in Oil nearly 8+ before it happened.

Transportation Index Monthly Chart

This Transportation Index Monthly chart highlights the sideways FLAG formation setting up in the US Transportation sector.  If the US market breaks lower as a result of lower global economic activity, we believe we will see the Transportation Index fall very quickly to levels below $9,500.  A breakdown in the Transportation Index would be an early warning sign that the US economy is headed towards a recession or contraction event.  Global shipping has already confirmed this event is taking place – yet the US Transportation sector has not shown much weakness.

Traders need to be very aware of the risks in the markets and the continued Capital Shift that is taking place throughout the planet.  Capital is running away from risk and pouring into more stable markets.  The ultimate risks to the global economy are for those nations where debt/economy levels are fragile, to begin with – which is why we highlighted the Belt Road project.  If China enters a protective mode where the Chinese Central Bank attempts to bail out Chinese companies/initiatives, we believe the Belt Road project could become a great risk.  And we believe this could happen very quickly given the current market environment.

The dynamics of global markets are changing very quickly.  It is time for traders to prepare for bigger volatility and large range sector rotation.  Follow our research, learn how we can help you stay ahead of these bigger moves in the markets.  2020 is going to be a fantastic year for skilled traders – you just have to stay ahead of the risks and be prepared to take advantage of the opportunities as they are presented.

Join my Swing Trading ETF Wealth Building Newsletter if you like what you read here and ride my coattails as I navigate these financial markets and build wealth while others lose nearly everything they own.

Chris Vermeulen
TheTechnicalTraders.com

NOTICE: Our free research does not constitute a trade recommendation or solicitation for our readers to take any action regarding this research.  It is provided for educational purposes only.  Our research team produces these research articles to share information with our followers/readers in an effort to try to keep you well informed.  Visit our web site (www.thetechnicaltraders.com) to learn how to take advantage of our members-only research and trading signals.


Belarus cuts rate another 25 bps to keep neutral stance

By CentralBankNews.info
The central bank of Belarus continued its 4-year easing cycle and lowered its key rate further to maintain a neutral monetary policy stance and keep inflation near its 5.0 percent target in 2020.
The National Bank of the Republic of Belarus cut its benchmark refinancing rate by another 25 basis points to 8.75 percent, its first cut this year.
Since April 2016, when it embarked on the current easing cycle, the rate has now been cut by 16.25 percentage points from 25.0 percent.
Future policy decisions will continue to rest on achieving the inflation target, the bank added.
The central bank said its vision of inflation in 2020 had not changed since November and it still expects inflation to fall within its 5.0 percent target, taking into account the planned rise in regulated prices and tariffs, low inflation in Russia and Europe, and a largely neutral impact on prices from domestic economic activity.
The decision to lower the rate takes into account any risks and uncertainties that could create inflationary pressures, the central bank said, pointing to the volatility of international financial markets and events in China, a reference to the current outbreak of the coronavirus that is adding uncertainty to the global economic outlook.
Headline inflation in Belarus was steady at 4.7 percent in January and December, slightly lower than the central bank had expected, but close to its target.
The Belarus ruble is also expected to be near equilibrium, the central bank said.
The government and central bank in January adopted a major strategy to improve trust in the Belarusian ruble by pursuing a coordinated policy to reduce the reliance of foreign currency in the country and ensure the Belarusian ruble occupies a leading role in the domestic economy.
Government debt commitments are around 97 percent denominated in foreign currency.
Among the features of this strategy is for the central bank to fully transition to inflation targeting by 2021, a reduced footprint by the central bank in the foreign exchange market, reduced monopolies in the economy over the next few years, a reduction in state debt, regular issues of government debt in Belarusian rubles starting this year with various periods of maturity, the creation of alternative forms of savings to procure long-term sources of funding in the ruble, and ensure that all taxes, rents, tariffs and prices by state-run organizations are set in Belarusian rubles.
After rising from February 2019 to July 2019, the Belarusian ruble has eased since November and fell further to 2.19 to the U.S. dollar today, down 4.1 percent this year.

www.CentralBankNews.info


Gold shaky as virus concerns ease; Euro slips

By Lukman Otunuga, Research Analyst, ForexTime

Gold struggled to shine on Wednesday as demand for safe-haven assets dropped on signs the spread of the coronavirus outbreak in China may be slowing.

A sense of optimism and hope that the worst of the virus outbreak may have passed is boosting global sentiment, with the pendulum swinging in favour of risk. The improving market mood should dim Gold’s allure with $1555 acting as the next key level of interest.

If bears can conquer $1555, the precious metal is likely to test $1535. Alternatively, should $1555 prove to be reliable support, Gold could stage a rebound back towards $1579.

Sterling struggles to clear 1.3000

Sterling took a shot at clearing the 1.3000 level on Wednesday with pricing peaking around 1.2990 before quickly retreating down.

In the absence of any negative Brexit-related headlines, Sterling will be driven by the Dollar’s valuation, UK fundamentals and price action. The GBPUSD remains bearish on the daily charts with strong resistance at 1.3000. Sustained weakness below this level should trigger a decline back towards 1.2900 and 1.2830.

If bulls can conquer 1.3000, the GBPUSD could rally towards 1.3150.

EURUSD sinks towards 1.0879

The Euro has weakened against every single G10 currency today thanks to disappointing economic from Europe.

Investors who were looking for a clean opportunity to attack the Euro were handed the opportunity on a golden platter after Industrial production in the Euro Area plunged 4.1 percent from a year earlier in December 2019. The Euro has weakened over 0.3% against the Dollar today with prices trading around 1.0885 as of writing. A breakdown below the 1.0879 support level should signal a steeper decline with 1.0800 acting as the next key support level.

Disclaimer: The content in this article comprises personal opinions and should not be construed as containing personal and/or other investment advice and/or an offer of and/or solicitation for any transactions in financial instruments and/or a guarantee and/or prediction of future performance. ForexTime (FXTM), its affiliates, agents, directors, officers or employees do not guarantee the accuracy, validity, timeliness or completeness, of any information or data made available and assume no liability as to any loss arising from any investment based on the same.


Forex-Time-LogoArticle by ForexTime

ForexTime Ltd (FXTM) is an award winning international online forex broker regulated by CySEC 185/12 www.forextime.com