By Orbex – The Keltner channel is an indicator used in the technical analysis. It was designed by Chester W. Keltner and was published in his book in the 1960’s.
Despite being quite old, the Keltner channel is a respectable and one of the popular indicators in the forex markets, among others. Typically, the Keltner channel falls into the category of bands. Bands in technical analysis are a set of indicators which have an upper and a lower range.
Some of the common examples of bands in technical analysis include the Bollinger bands, Envelopes, Donchian channels to name a few. The Keltner channel is unique from most of the other band indicators.
Traders use bands, both as a breakout indicator as well as to outline the trends in prices. At times, bands can also indicate potential overbought and oversold levels.
How is the Keltner Channel Constructed?
It always helps to understand how an indicator works even though many are automatic and there is no need to do the calculations manually. The Keltner channel takes into account volatility based on the average true range indicator.
Keltner Channel Indicator
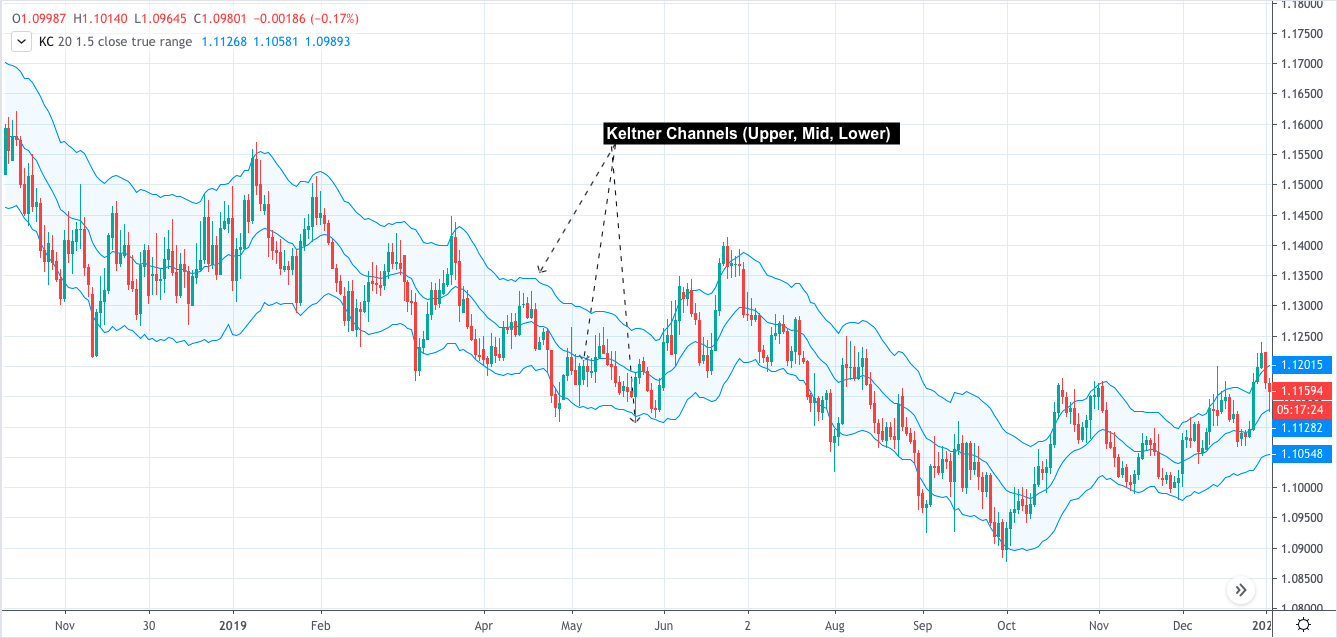
The Keltner channel has three lines. These are the upper and lower channel lines and the midline.
The Keltner Channel uses a 10-period or a 20-period setting, of an exponential moving average. The exponential moving average forms the basis from the typical price (H+L+C/3).
The upper line is formulated by taking the mid-line value and multiplying by 1.5. The result is then added to the midline’s value to form the upper line.
Likewise, when you subtract the same number from the mid-line, you get the lower Keltner channel.
In total, the Keltner channel has a setting of 10 or 20 period with a multiple of 1.5. Traders can experiment with these values to make it more or less sensitive to price and volatility.
The Keltner channels, because of using volatility, tend to slightly expand or contract. This depicts the volatility in the price action of the security.
Catching Trends Using the Keltner Channel
During a strong trend, price tends to trade consistently above or below the lower Keltner channel. However, due to the reversion to the mean theory, prices often snap back to the mid-line of the Keltner channel.
Buy and sell signals are forming, thus indicating a strong breakout from either of the outer bands.
When price stays within the band but reaches one of the outer bands, it can signal oversold or overbought levels by just looking at the Keltner channel.
Trading Forex Using Keltner Channels
Over the years, traders have come up with different ways of using the Keltner channel in their trading systems. But quite often, traders make the mistake of using redundant indicators. For example, using a Keltner channel alongside an additional moving average.
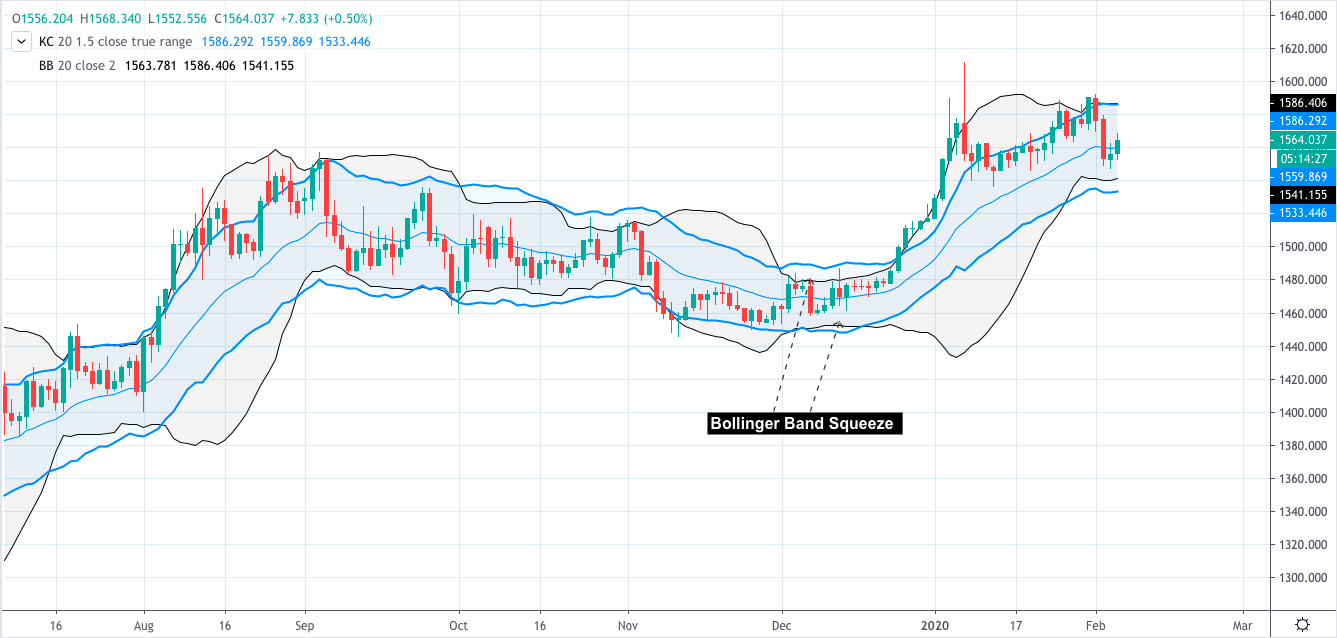
Yet, some methods are quite interesting. For example, the Bollinger band squeeze and the Keltner channel is a popular way of trading. The basis of this method is that when volatility contracts, the Bollinger bands also contract.
Keltner Channel Indicator
In turn, at times, the bands tend to squeeze within the Keltner channel. This period represents extremely low volatility. But it also portends a possible breakout or higher volatility. When the Bollinger band squeezes into the Keltner channel, traders may prepare for a breakout trade.
Depending on the slope of the Bollinger bands and the Keltner channels, traders can take long or short positions.
The chart above gives one such example of a Bollinger band squeeze within the Keltner channel.
In conclusion, the Keltner channel is a fairly reliable technical indicator that has stood the test of time. Traders can use this indicator as one of many when trading with bands. The indicator is useful if the trader wants to rely on trends and volatility as the main determinants of their trading strategy.
Mexico no longer has the highest interest rates in the world. But, that doesn’t mean their central bank isn’t still looking to ease further.
Inflation hasn’t picked up significantly since the Banxico embarked on its latest easing cycle. However, neither has the economy.
There were reasons to suggest that Mexico would be a beneficiary of the US-China trade tensions. And the USMCA finally removed that bit of uncertainty. However, that hasn’t shown in the data.
The consensus among polled economists shows a strong inclination towards a fifth consecutive rate cut. That puts the rate at 7.25%.
This would imply that the interest rate spread with the US closed by 50 basis points, cutting the interest premium for Mexican assets to a similar level to mid-2017. In that period, the USDMXN drifted from the 17.70 handle to a little over 18.70.
New Rules?
In the lead-up to the decision, the Banxico has issued new guidelines to members and analysts about improving their communication. Most are of a technical nature, but regulators are making an effort to curb speculation about the rate ahead of the official announcement.
New rules include a seven day blackout period ahead of the rate announcement. They also include a promise to use less complicated language in press releases.
Neither should affect the underlying fundamentals of the decisions that the Banxico makes, of course. However, the market might react differently to a new format.
An important part of the market reaction to a central bank statement is the language used. So, there could be some extra volatility this time around as traders adjust to the new format and compare it with prior announcements.
Going Forward
The other matter is what to expect from the central bank going forward. The Banxico does not issue a dot matrix like the Fed does. But, we can have a look at the trajectory plotted by expectations from economists.
There is currently an expectation of three interest rate cuts this year, after the one projected for tomorrow.
This would mean that the interest rate would close out the year at 6.5%. For 2021, an additional two rate cuts are expected and appear to be priced in by the bond market.
The Situation
All of that supposes that inflation stays below 4.0% and the economy doesn’t take off.
Last month’s inflation was ahead of expectations, while industrial production continued to shrink.
Some analysts point to Mexico potentially having benefitted from the economic turmoil caused by the coronavirus in the Far East. This is because US importers are looking for other sources of supply with many Chinese firms shut. And we would normally expect this to provide some strength to the peso.
The USDMXN has remained largely stable during the easing cycle, helped, in part, by a drop in credit default swaps during the same period.
Mexico remains one of the few high-yield carry plays in a world racing to lower rates. With little expectation of rates to rise in other countries, the peso could stay strong. This is true even if the Banxico continues along the expected easing track.
The US dollar has had a slow start to the day on Wednesday as the drift lower from recent highs continues. The USD index trades 98.62 last. It’s been a slow week for data, though key retail sales and inflation data are due tomorrow and Friday. Looking ahead to today, comments from Fed’s Powell will be the main domestic focus.
EUR Outlook Still Bearish
EURUSD is posting a minor recovery today, benefiting from the drift lower in USD. However, the outlook remains tilted towards the downside for the EUR. The Irish election results this week have added further downside pressure for EUR. The currency was already under strain over recent weeks as a result of the coronavirus outbreak and concerns over EU/UK trade talks. EURUSD trades 1.0917 last.
GBP Boosted By BOE Comments
GBPUSD has been higher again today, extending the rally seen across the week so far. Recent data upside has helped lift sentiment which was further boosted yesterday. BOE Governor Carney told the Economic Affairs Committee in the UK that the financial impact from coronavirus looks manageable. GBPUSD trades 1.2978 last.
Risk Assets Trade Higher
Risk assets have been in better shape again today with the SPX500 rallying back above the 3358.86 level to trade 3369.43 last. The market continues to shrug off the risks from the coronavirus to remain near recent highs. Despite the continued spread of the virus the death toll so far looks to be mainly contained to China which is limiting some of the damage to risk appetite for now.
JPY & Gold Lower
Safe havens have been lower today with both JPY and gold lower in light of the better tone to risk sentiment. XAUUSD trades 1565.16 last, with price continuing to hold above the 1555.38 level for now. USDJPY trades 109.99 last, with price settling back having earlier popped above the recent 100 highs to trade fresh highs on the month.
Crude Recovery Continues
Oil prices have been a little higher today, supported by a better tone to risk appetite. Yesterday, the API reported a 6 million barrel increase in US oil inventories. However, the market seems to be ignoring the data, waiting instead for the headline EIA report due later today. Crude trades 50.94 last.
Loonie Lower Again
USDCAD continues to pull away lower beneath the 1.33 level. The recovery rally in crude, as well as some softening in the US dollar, is weighing on price here. 1.3207 support is the level to watch. Looking ahead to tomorrow, BOC Governor Poloz will be making comments which could cause some price impact for CAD.
Aussie Rallying
AUDUSD is trading on a better footing today with price rallying up to .6742 last as the general improvement in risk appetite keeps Aussie supported. While equities and commodities prices continue to trade higher, AUD looks set to enjoy further upside, putting focus on a move back to the bearish trend line next.
Development of the coronavirus infection in China has significantly slowed down
Such a movement means the weakening of the yen and strengthening of the oil. The dynamics of this PCI may depend on the situation with the coronavirus infection in China. Currently, an increase in the number of infected and dead people has significantly slowed down. So far, the peak of the infection was on February 5, when a little less than 4 thousand new cases of coronavirus have been recorded. On February 10, it decreased to 3 thousand. Chinese authorities believe that the daily number of infected people stabilizes and by the beginning of March, it will start declining. The Japanese yen was considered as a safe haven asset by investors. A decrease in global risks may reduce demand for it. For the same reason, world oil demand may increase. The OPEC + Technical Committee recommended to extend the current reduction in oil production by the cartel countries and independent producers in the amount of 1.7 million barrels per day and increase it by 600 thousand to 2.3 million barrels per day. However, a final decision has not been made yet.
The outbreak of coronavirus (officially named Covid-19 this week) is still very much a high-level threat globally. As of yesterday, over 43,000 people in China are confirmed to have the virus. The death toll there has also risen over 1000. On Monday, China noted its largest one-day spike in new cases, which soared by just under 2,500 cases. Along with the spike in cases, the death toll also saw its biggest increase with 108 new death reported.
The dramatic increase reflects that the virus is still developing in line with the WHO saying that China is still in the midst of an “intense outbreak” of the virus. The outbreak continues to develop around the world. The UK has confirmed fresh cases of the virus. The island of Majorca, a more remote place also has a confirmed case.
Cruise Ships in Quarantine
Cases of the virus have also been confirmed on cruise ships which is causing severe disruption to many cruise liners. The Diamond Princess has been quarantine in Japan since the start of February. 135 people were confirmed to have the virus. Many other cruise liners are now suspected to have the virus on board.
The Westerdam cruise ship (carrying 2000+ people) has been denied access to ports in Japan over fears that passengers are carrying the virus. Other cruise ships have also been quarantined. This includes the World Dream, carrying 3,600+ passengers – though no cases of the virus were confirmed.
The virus is now entering its second month and with the death toll already well above that of the SARS outbreak, which lasted for four months, there are grave concerns about how many more people could die.
Markets Remain Resilient
Despite the ongoing risks from the virus, markets are displaying a great deal of resilience with the SPX500 breaking out to fresh all-time highs this week. Despite the growing number of cases around the world, the death toll outside of China has been limited to just 2 victims so far. Unless that global death toll starts to rise, the recent improvement in many global economic indicators is likely to continue to offset the negative impact of the virus.
Technical Perspective
The move higher in the SPX500 this week has seen some selling kick in near highs. With the RSI indicator showing bearish divergence, there is the risk of a reversal lower here. If price breaks down below the 3358.56 level, we could see a deeper pull back with focus turning to the completion of the symmetry swing into the 3313.93 support.
A day after equity markets turned cautious, investor appetite was slightly bullish.
A lack of economic fundamentals has kept the markets flat. The coronavirus, however, is keeping investors on the edge with some fund managers claiming that market fears are overdone.
Fed Chair Powell gave his testimony to the US Congress, but it was broadly neutral.
French Economy to Expand 0.3% in Q1
The Bank of France forecast that the French economy will rise by 0.3% in the first three months of 2020. This comes after the GDP fell 0.1% in the fourth quarter of last year.
The report came following a monthly survey from the bank suggesting that the manufacturing confidence index was unchanged in January at 96.0.
EURUSD Rebounds Off Lower Support
The euro currency is on track to close bullish after a long spell of declines. Price action bounced off the support area near 1.0897. This comes despite the Stochastics oscillator staying well within the oversold levels.
However, divergence on the intraday charts could indicate a rebound to 1.0952.
UK Fourth-Quarter GDP Stays Flat
The latest quarterly GDP report from the UK showed that the economy logged a flat growth rate. For the three months ending December 2019, the gross domestic product was unchanged on the quarter.
This follows a 0.5% increase in the third quarter of 2019. The increase in the services and construction sector was offset by the declines in the manufacturing and auto industry.
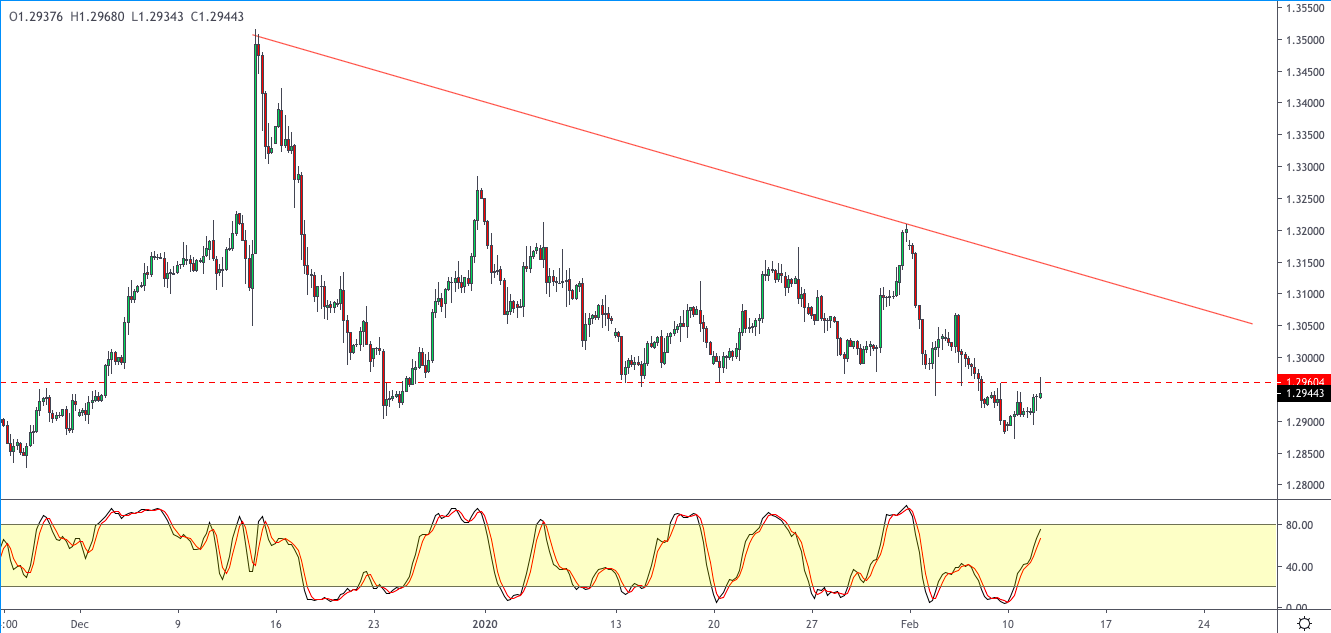
GBPUSD Fails to Capitalize on Gains
The cable initially jumped on the GDP report, but later into the day, prices failed to build upon the momentum. As a result, GBPUSD briefly tested the price of 1.2960 before pulling back.
If this momentum continues, we expect a continuation to the downside. Alternatively, price action could remain steady just below the resistance area for a while.
Gold Turns Weaker After Powell’s Speech
Gold prices did not react much to Fed Powell’s speech. Giving his testimony to Congress, the Fed Chair said that the bank is closely monitoring the impact of coronavirus.
Elsewhere, on monetary policy, Powell struck a neutral chord. However, the precious metal started to dip closer into the late European trading session.
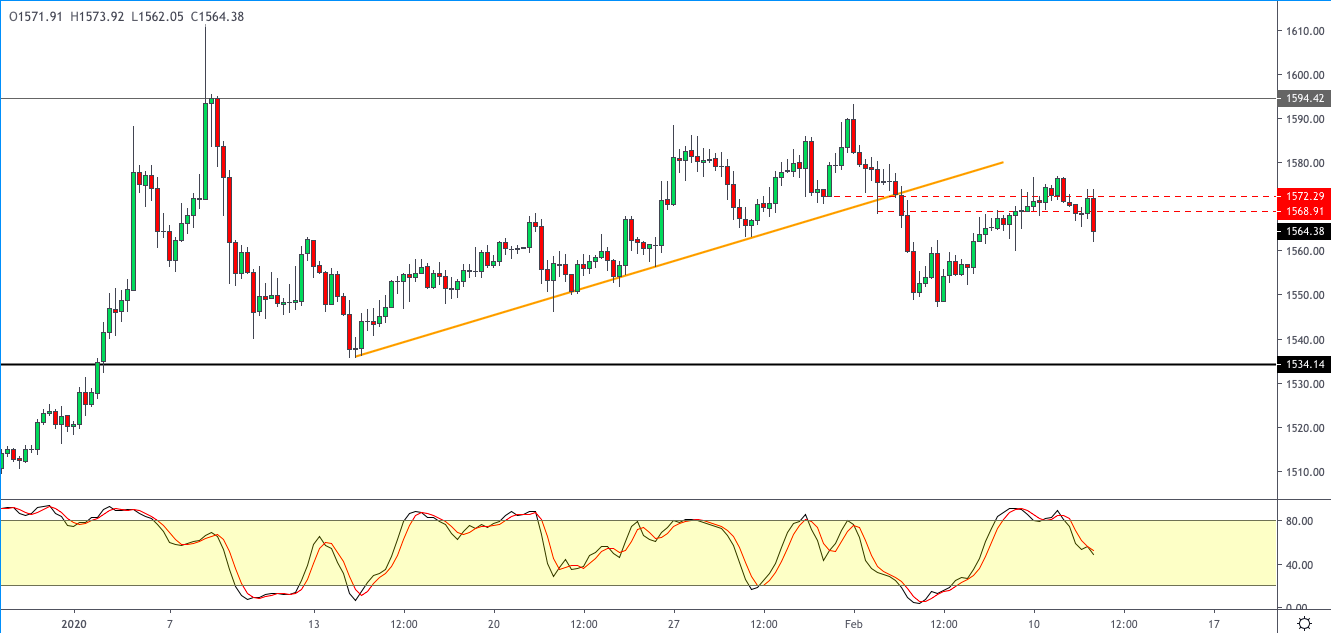
XAUUSD Reverses at Resistance
The precious metal, after failing to breakout off the resistance level at 1573 – 1568, is pushing lower. This could potentially confirm the downside correction.
But price action needs to close below the previous pivot lows of 1548.29 to confirm the downside. The next lower target is at 1534.14.
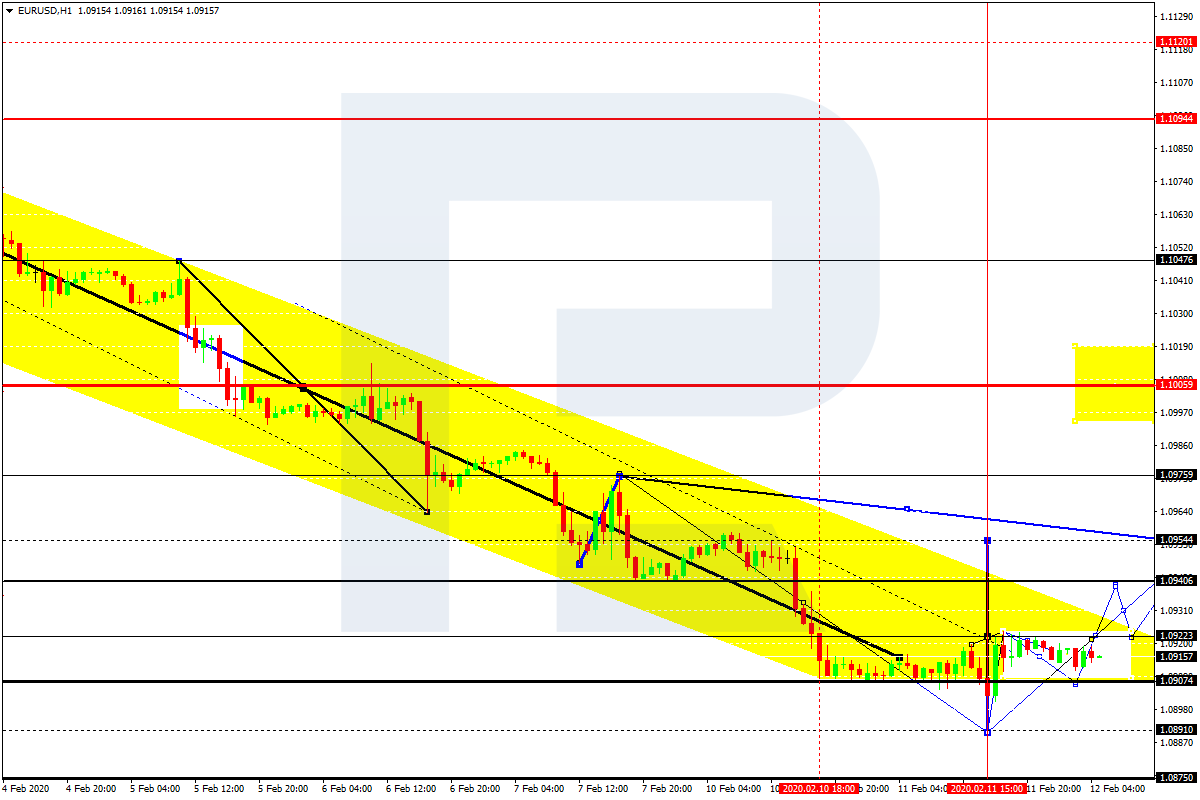
EURUSD has finished the ascending impulse from 1.0891. Possibly, today the pair may correct from 1.0924 to 1.0907, thus forming a new consolidation range between these two levels. If later the price breaks this range to the upside, the market may form one more ascending structure with the first target at 1.0955; if to the downside – start another decline to return to 1.0891.
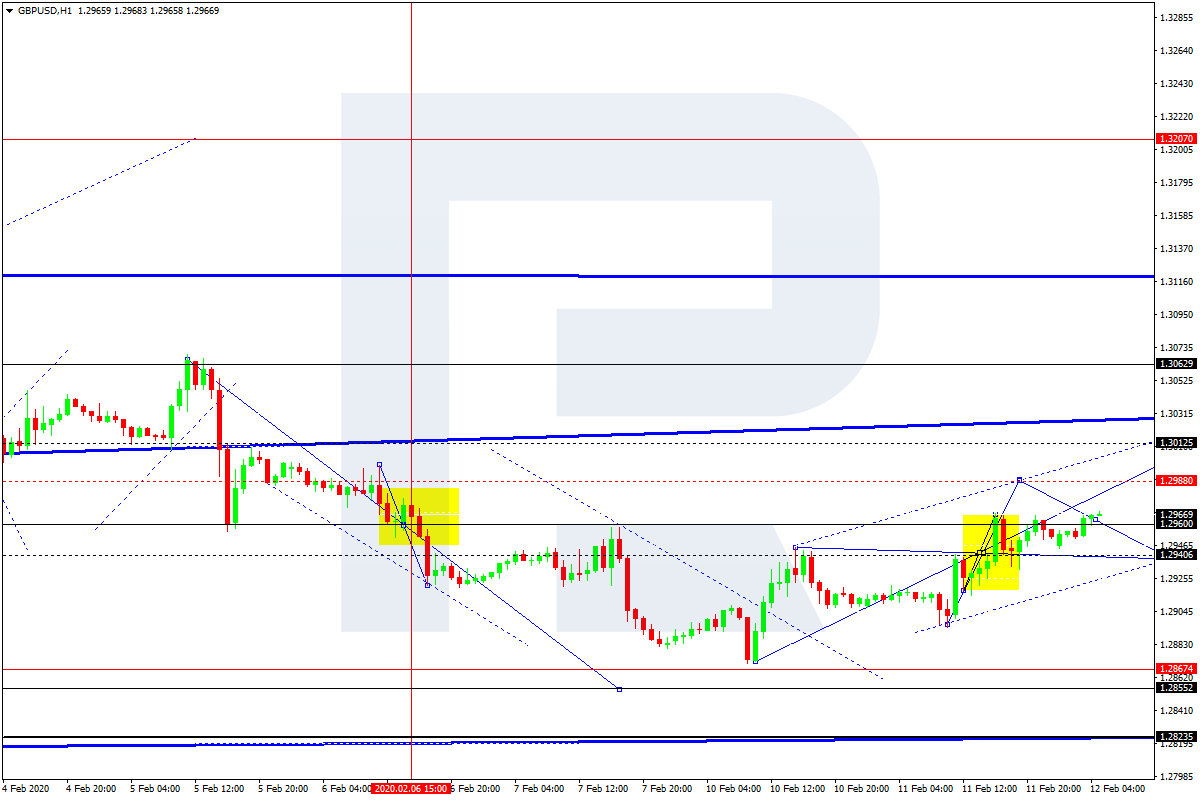
GBPUSD, “Great Britain Pound vs US Dollar”
GBPUSD has formed another consolidation range around 1.2940; right now, it is trading upwards. Possibly, the pair may break the range to reach 1.2988 and continue the correction (an alternative scenario). The main scenario implies that the price may fall to break 1.2945 and then continue moving downwards with the target at 1.2855.
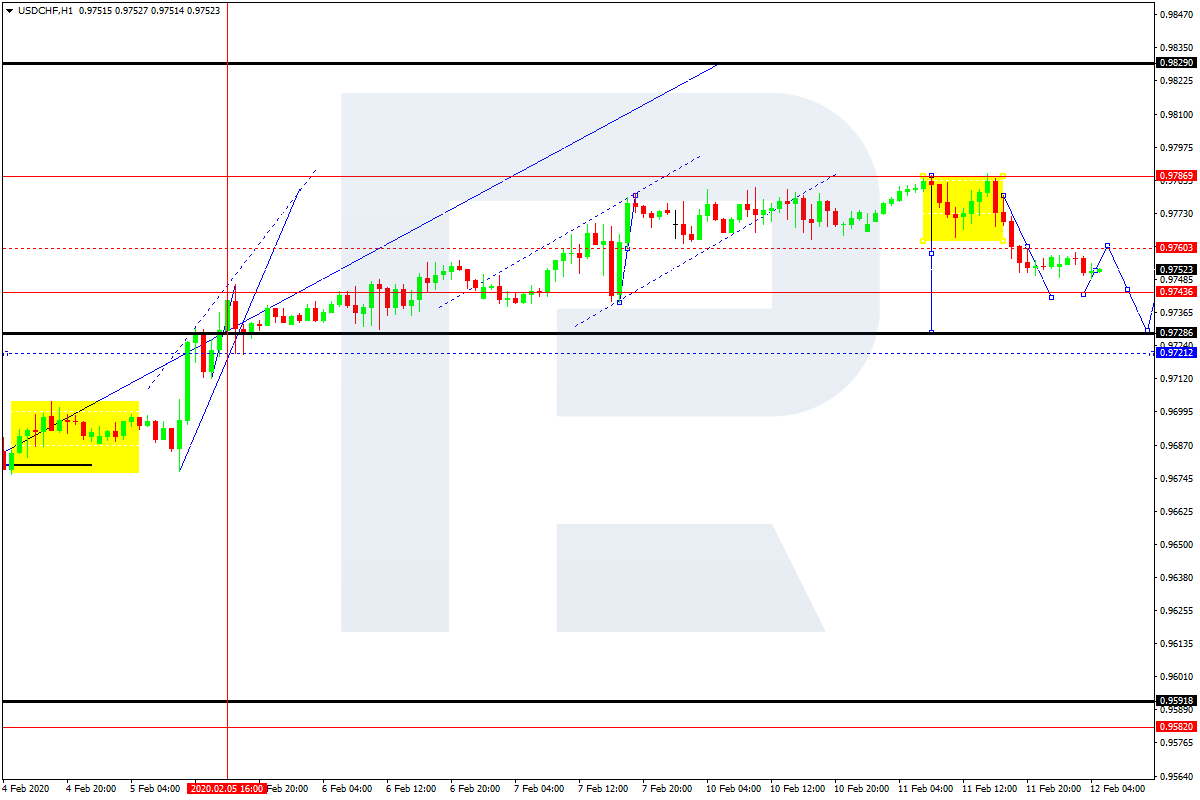
USDCHF, “US Dollar vs Swiss Franc”
USDCHF has broken 0.9760 downwards. Possibly, the pair may correct towards 0.9728 and then start another growth to break 0.9788. After that, the instrument may continue trading upwards with the target at 0.9829.
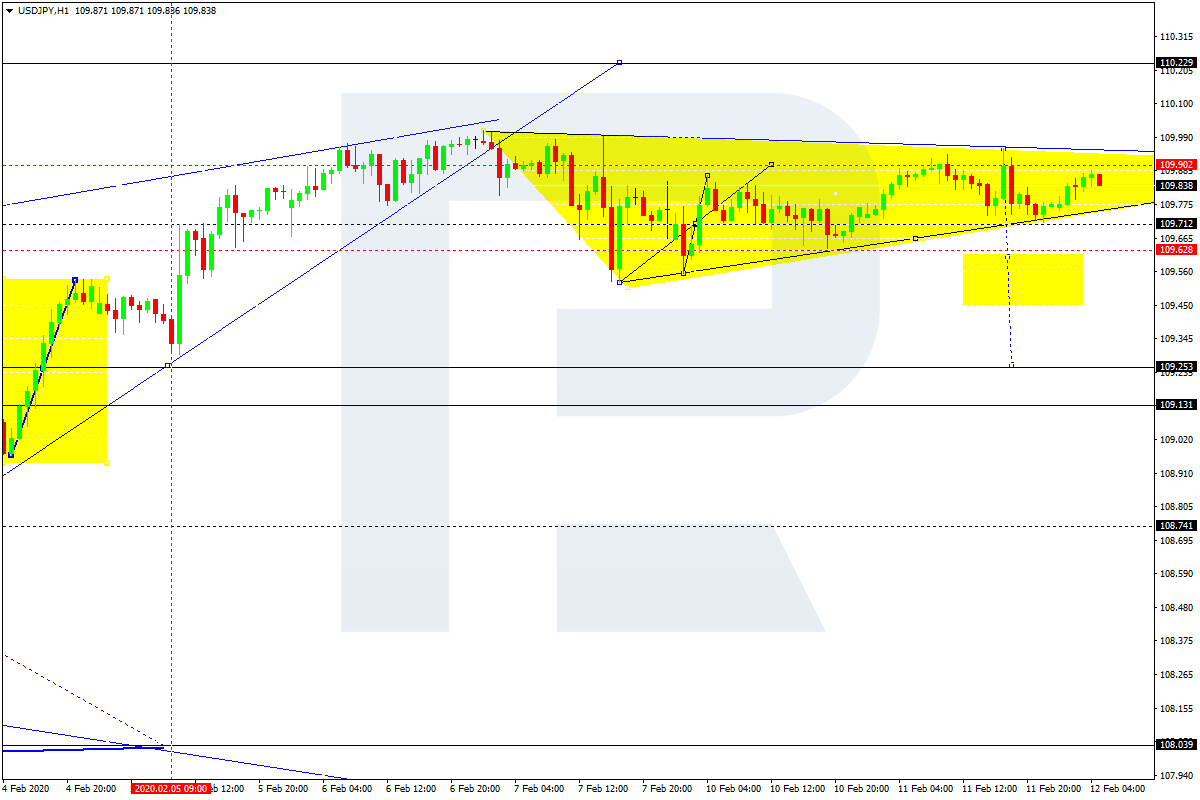
USDJPY, “US Dollar vs Japanese Yen”
USDJPY is forming a narrow consolidating range around 109.71 in the form of a triangle. If later the price breaks this range to the downside at 109.60, the instrument may start a new correction with the target at 109.25; if to the upside at 109.90 – form one more ascending structure towards 110.22.
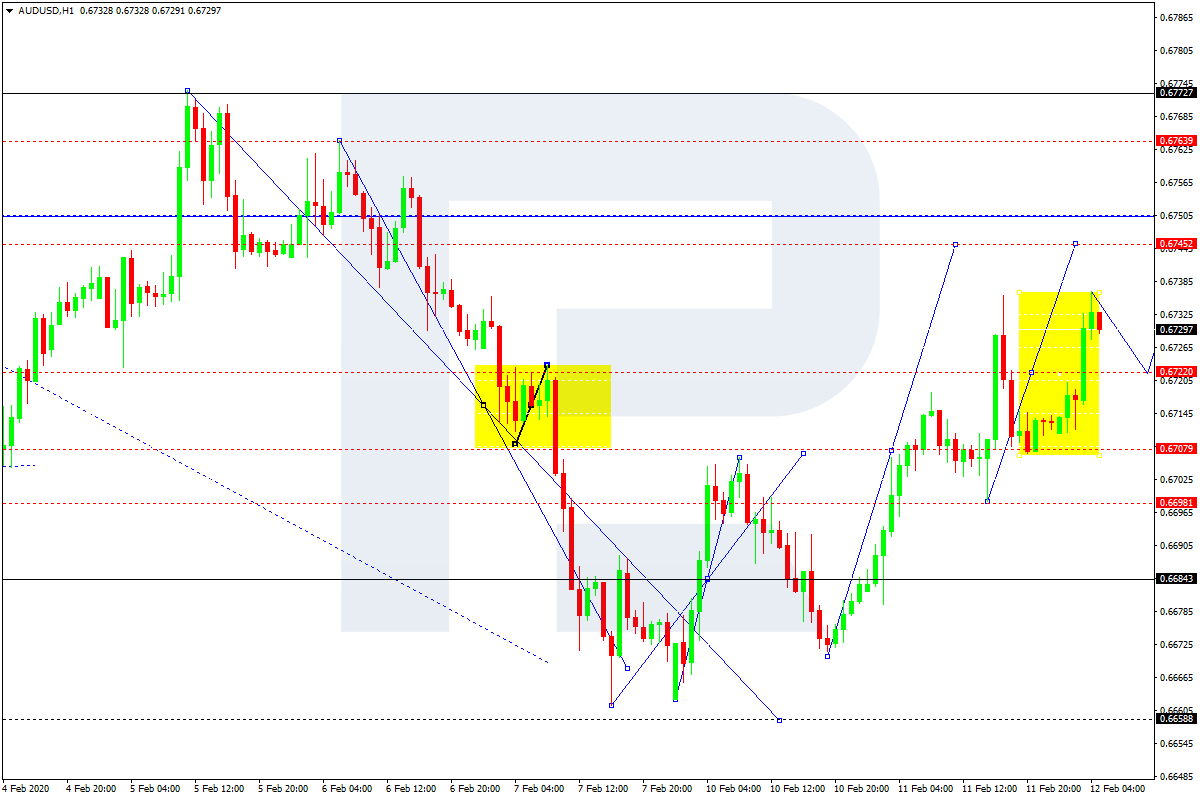
AUDUSD, “Australian Dollar vs US Dollar”
After forming another consolidation range around 0.6707, AUDUSD has broken it to the upside. Today, the pair may continue trading upwards to reach 0.6745 and then start a new descending structure with the target at 0.6707.
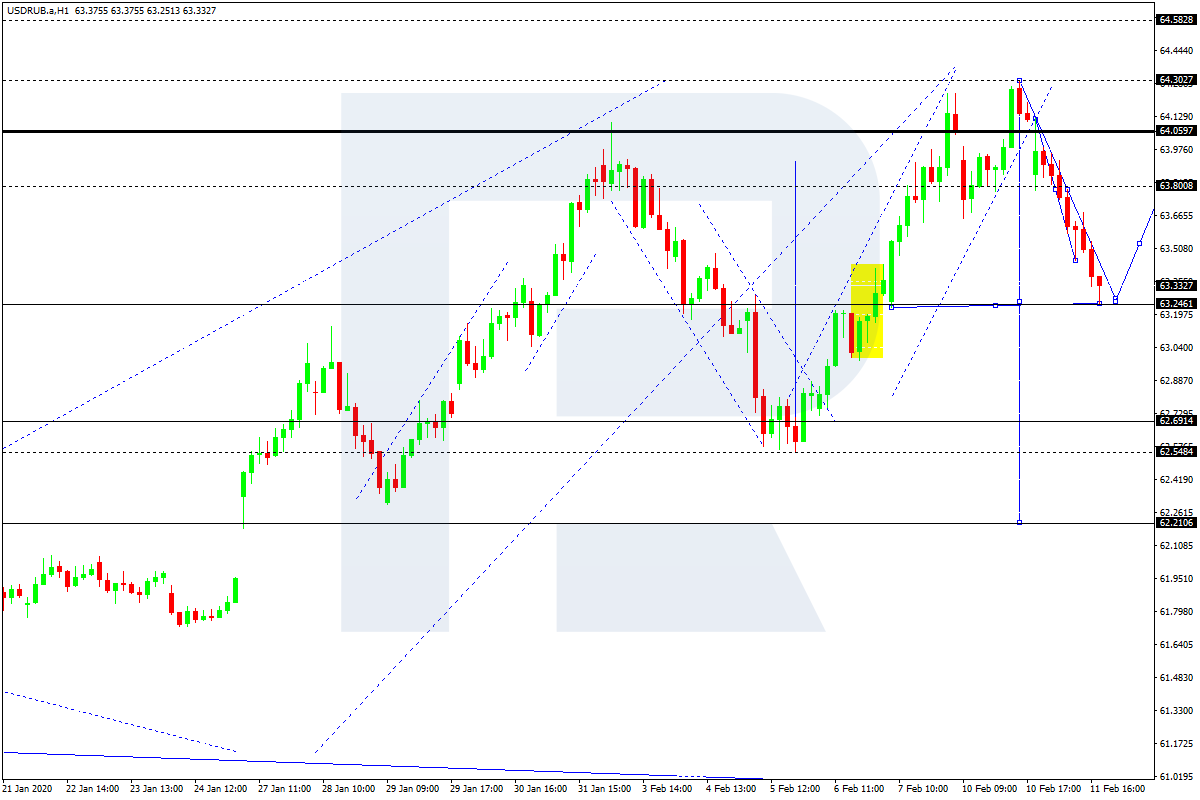
USDRUB, “US Dollar vs Russian Ruble”
USDRUB has completed the descending impulse towards 63.25. Possibly, today the pair may correct to reach 63.80 and then start a new decline with the short-term target at 62.70.
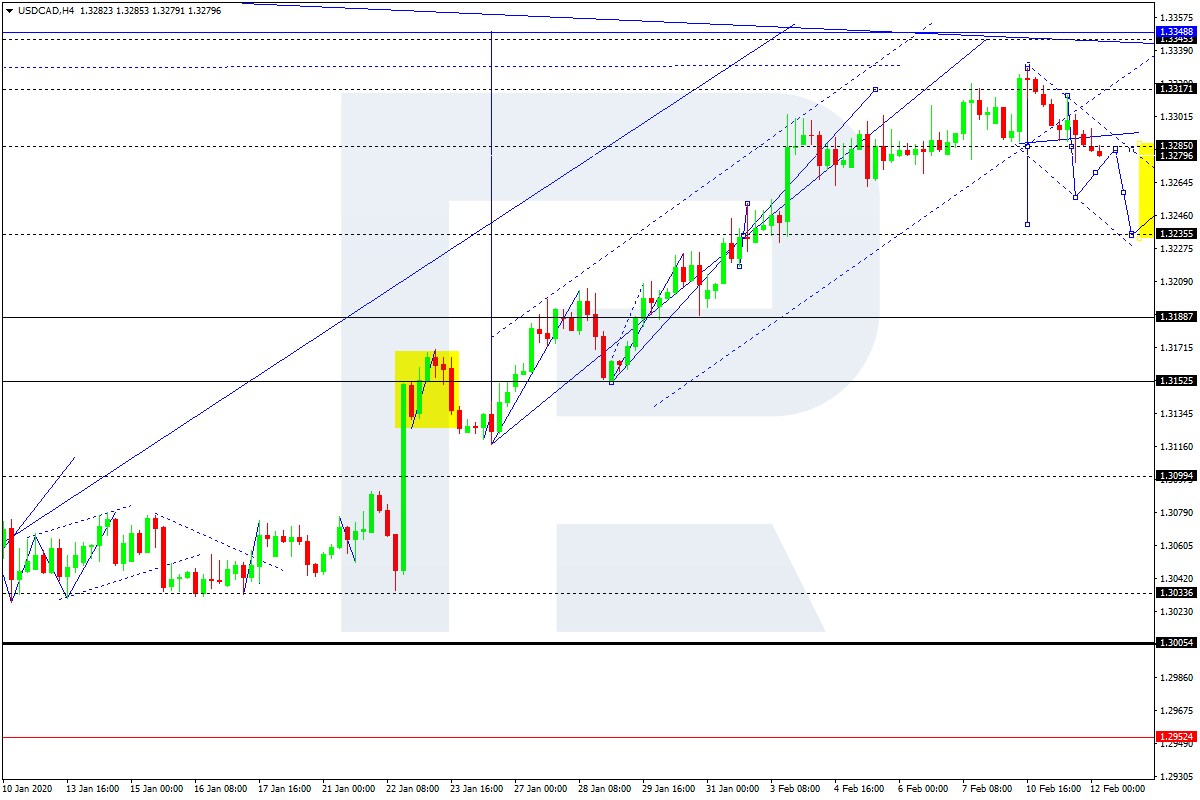
USDCAD, “US Dollar vs Canadian Dollar”
USDCAD is moving downwards. Possibly, the pair may reach 1.3233 and then resume trading upwards with the target at 1.3288, thus forming a new consolidation range. If later the price breaks this range to the downside, the instrument may start a new correction towards 1.3155; if to the upside – form one more ascending structure to reach 1.3345.
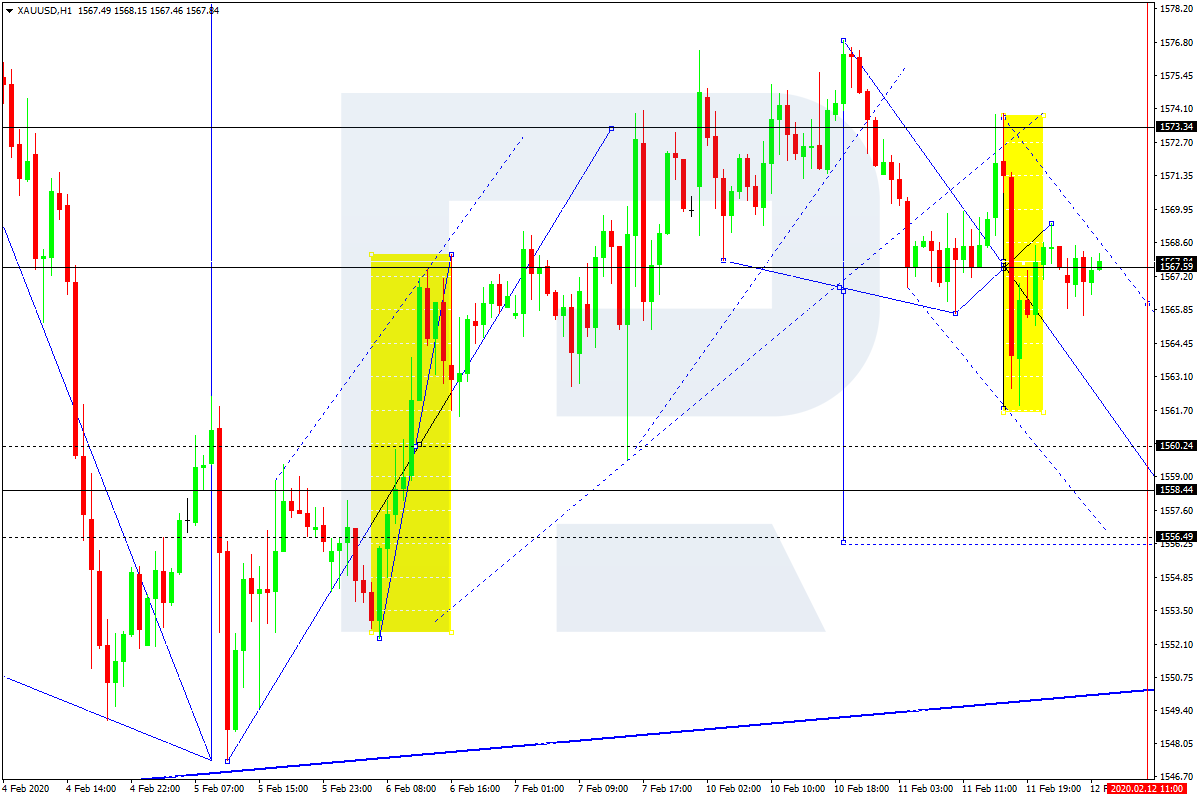
XAUUSD, “Gold vs US Dollar”
Gold is still consolidating around 1567.90. Today, the pair may fall to reach 1558.45 and then resume trading upwards to return to 1567.90.
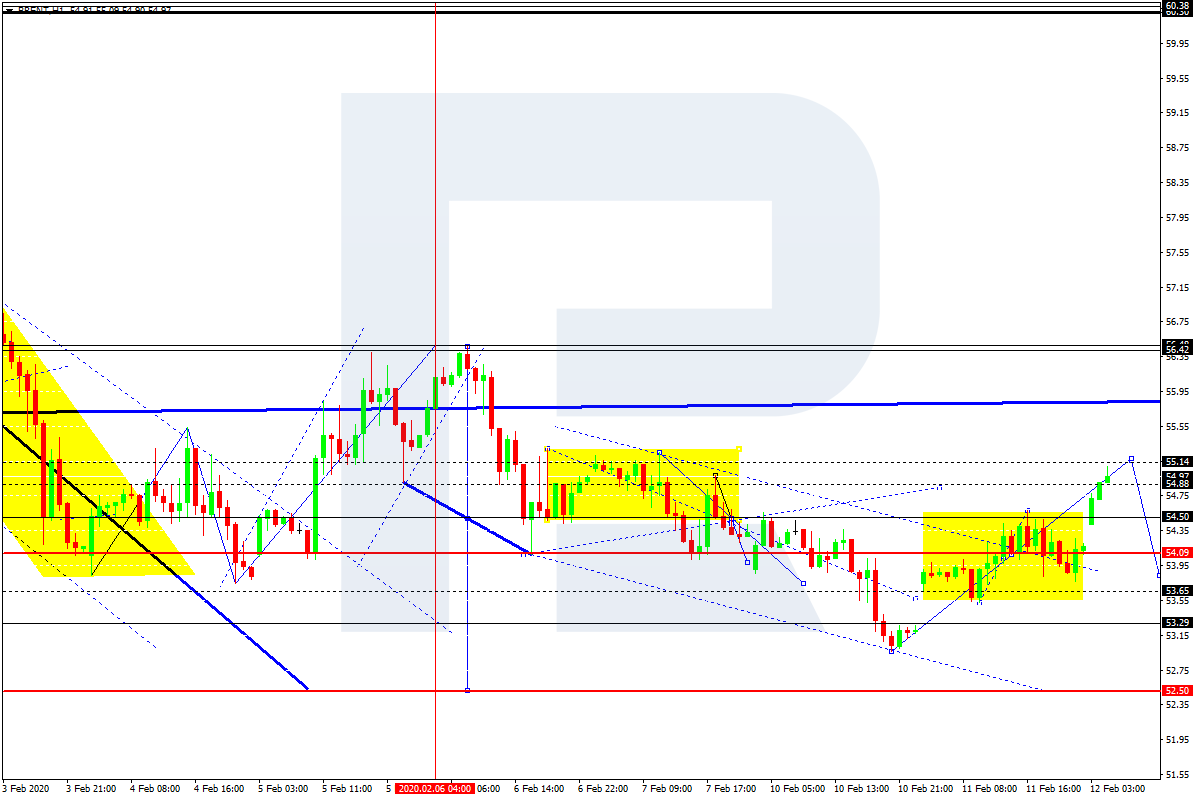
BRENT
Brent is moving upwards. Possibly, the pair may reach 55.15 and then form a new descending structure towards 54.10. If later the price falls and breaks 53.90, the instrument may continue falling with the target at 52.50; if grows and breaks 55.20 – form one more ascending structure to reach 56.45.
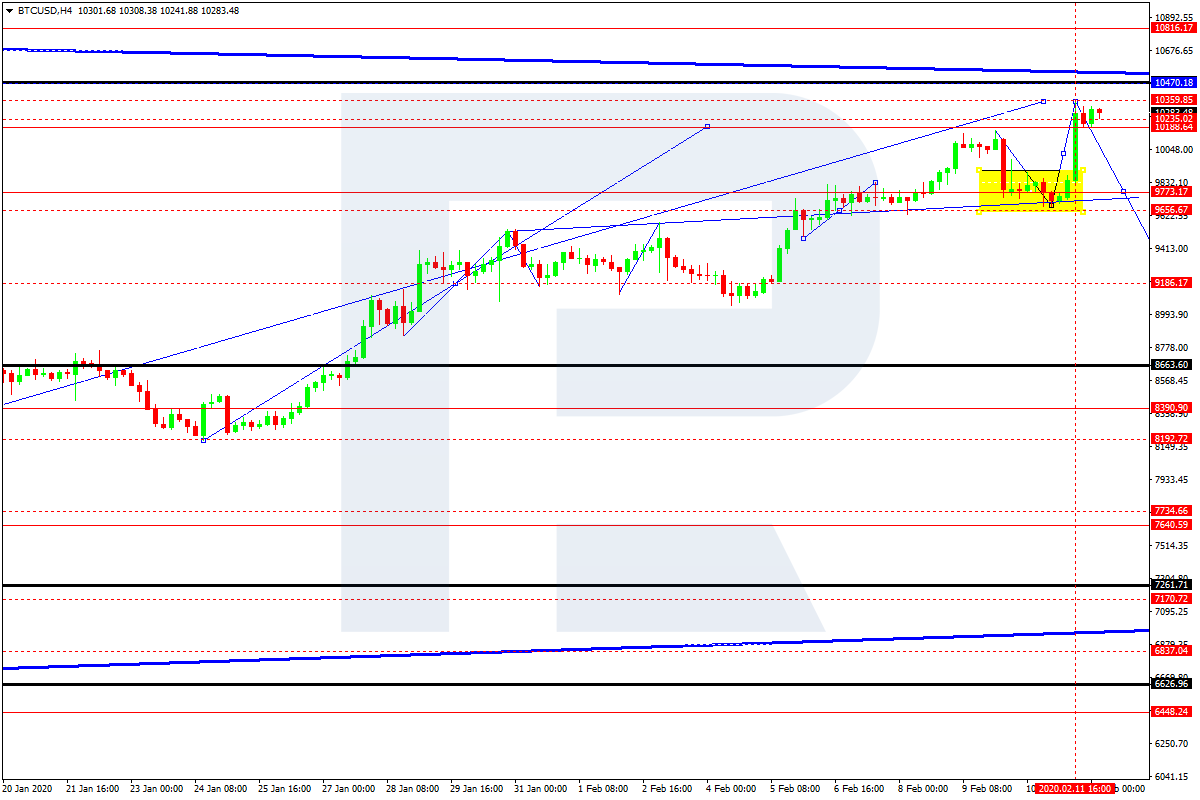
BTCUSD, “Bitcoin vs US Dollar”
BTCUSD has completed the ascending structure at 10300.00, thus almost reaching the short-term upside target; right now, it is consolidating close to the highs. According to the main scenario, the pair is expected to fall to break 9800.00 and continue the correction with the target at 8500.00, at least.
Attention! Forecasts presented in this section only reflect the author’s private opinion and should not be considered as guidance for trading. RoboForex LP bears no responsibility for trading results based on trading recommendations described in these analytical reviews.
As the downgrades of the economic outlook for US, China and worldwide are about to begin, the virus outbreak may be steadying. Sadly, much of the economic, xenophobic and virus damage stems for lagging cooperation.
At the end of January, United States declared the 2019 novel coronavirus acute respiratory disease (nCoV ARD) an “unprecedented public health threat” followed by preparations “as if this were the next pandemic.” The unilateral action went against guidance by the World Health Organization (WHO).
Thanks to sensationalist media, the move also unleashed fear across America at the peak of the domestic flu season. Some 22 to 31 million Americans have already been infected with the seasonal flu, requiring up to 210,000 to 370,000 hospitalizations and causing 12,000 to 30,000 deaths, according to the CDC. As the Trump administration is preparing a $4.8 trillion budget with big safety-net cuts, it is focusing public attention on the virus outbreak.
Instead of a focus on the epidemiological facts, international headlines have focused on the expected “pandemic,” resulting in pressure campaigns against the WHO and an avalanche of xenophobic anti-Chinese incidents. The net effect will reverberate in downgraded economic outlooks in China, US and worldwide.
Here’s how it happened.
Rising number of cases, rapid outbreak deceleration
Even reputable media has contributed to misunderstandings. On February 4, New York Times reported: “Deaths in China Rise, With No Sign of Slowdown.” The first part of the sentence was true, but the second was misguided. In reality, the daily increase of newvirus cases in China had just started to decelerate, while the pace of accumulated cases had been decelerating since mid-January.
With the new coronavirus, there are now (2 pm Wuhan time, Feb 11) over 42,600 confirmed cases worldwide, while the number of deaths is more than 1,000. If the current pace prevails, the former figure will soon exceed 50,000, while the latter may climb to 2,000.
And yet, the number of the confirmed cases and deaths has remained relatively low – less than 500 and only 2, respectively – outside China. While these numbers will continue to increase, the low starting-point suggests that China’s costly and draconian measures may have saved many lives within and outside China.
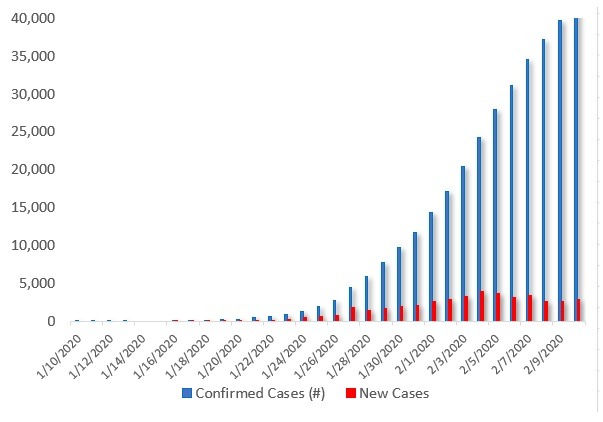
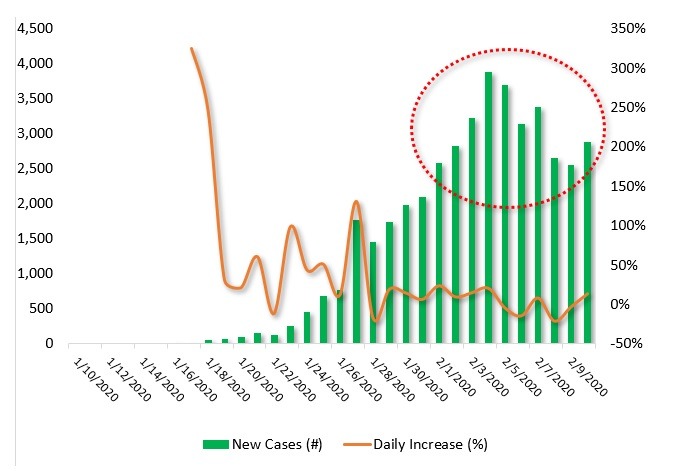
Moreover, the pace of the contagion is changing. The relative increase of the accumulated cases has decreased since mid-January. While the pace peaked at almost 100% after mid-January, it has declined to zero and below (Figure 1a). In turn, new cases increased steadily from mid-January soaring to almost 3,900 on February 4. But since then the numbers have fallen below 2,600 – from daily increase of almost 350% to zero and below (Figure 1b).
Daily Increase of Accumulated Cases, Jan 10 to Feb 9, 2020
Daily Increase of New Cases, Jan 10 to Feb 9, 2020
Source: DifferenceGroup. Data from China’s National Health Commission;
While the data could indicate a possible turnaround in the virus outbreak, there is no assurance that the deceleration will prevail. Since viruses can zigzag, these trends do not justify any complacency. And as the Lunar New Year holidays now end in China, new outbreak clusters are still possible, including outside China. But assuming current trends, we may be witnessing a crossroads – despite politicized international coverage.
Instead of virus outbreak, an ‘infodemic’
In late January, the World Health Organization (WHO) declared the outbreak a “public health emergency of international concern” (PHEIC) and urged attention to a global health emergency to foster a “coordinated international response.” The PHEIC was not motivated by China, but by the possible effects of the virus, if it would spread to countries with weaker healthcare systems. That’s why WHO has called for a $675 billion initiative to combat future virus outbreaks.
Instead, media hysteria contributed to ugly instances of xenophobia against people of Chinese and Asian descent. On February 2, the misinformation on global scale compelled the WHO to declare the coronavirus an “infodemic,” which “made it hard for people to find trustworthy sources and reliable guidance.”
Worse, WHO leaders were targeted in public pressure crusades, including an online petition campaign calling the WHO chief Tedros Adhanom Ghebreyesus to resign. In reality, Tedros, an Ethiopian public-health pioneer, has adhered to WHO guidelines regarding pandemics, supported research on virus causes and tried to foster member states’ cooperation against the outbreak.
The smear campaign is an ugly déjà vu. Amid the 2017 WHO election, Tedros was attacked for alleged cover-up of possible past cholera epidemics in Ethiopia. The odd allegations came from Lawrence Gostin, US law professor who advised the rival UK candidate (and has resurfaced as a critic of China’s anti-virus struggle). In the UN, the African Union dismissed the allegations as an “unfounded and unverified defamation campaign.” But now the same ugly campaign was back.
In contrast to Washington’s demands for WHO to declare the outbreak a “pandemic,” WHO has a six-stage pandemic classification, which requires a pandemic to be fatal, infectious and international. In the last pandemic, the 2009 H1N1 flu outbreak (swine flu), 150,000-300,000 people died around the world. The current outbreak has caused only two deaths outside China (both linked with Wuhan, the virus epicenter).
Oddly, as international coverage focused on China’s alleged conduct, which WHO mainly applauded, it ignored the actual conduct of other states, despite Tedros’s news bomb on February 4. It was not China, but countries outside China that had proved slow in sharing complete information about cases. Despite weeks of crisis and global health emergency, more than 60% of five member countries had failed to provide complete case reports to WHO.
As international cooperation lagged and precious time was lost, economic consequences have grown more severe.
Impact scenarios
After a month of the virus outbreak, three economic scenarios prevail. In the “SARS-like impact scenario,” a sharp quarterly effect, accounting for much of the damage, would be followed by a rebound. The broader impact would be relatively low and regional. The impact on annualized growth would be tolerable.
In China, the 1st quarter would be penalized by a 1.2% reduction to about 5% or less, while the 2nd quarter rebound would offset much (but not all) of the losses. U.S. growth could suffer a 0.4% slowdown of the annualized growth. In Japan, growth would fall closer to 0%. Due to supply chain disruptions, South Korea and Taiwan would take heavier hits. In Hong Kong, the outbreak will extend the technical recession into the 1st quarter. In Southeast Asia, downgrades would reduce growth closer to 4%. Annualized global growth would fall closer to 3.1%.
In the “extended impact scenario,” the adverse impact would last at least two quarters until early summer. In this case, the broader impact would be more severe and have an effect on global prospects, with rebound in the summer. The reductions in the US, China, and Japan would have a significant adverse impact in Asia and the global economy.
In the “accelerated impact scenario,” adverse damage would be far steeper, while a rebound would ensue only toward the end of the summer. The impact on annual growth would prove very significant, with dire repercussions in the global economy.
Today, consensus projections vary between the SARS-like and extended impact scenarios. If we are witnessing a sustained turnaround in new virus cases, there might be some reason for such hopes. Yet, international media coverage, pressures against WHO and lagging international cooperation indicate non-economic forces are fueling economic forecasts, while the risk of the extended impact scenario has increased. Finally, the accelerated impact scenario would undermine most of the post-2008 recovery with severe consequences to global prospects.
No virus outbreak will go by without adverse economic effects. But some of the impending damage could have been reduced with appropriate international cooperation.
About the Author:
Dr. Dan Steinbock is an internationally recognized strategist of the multipolar world and the founder of Difference Group. He has served at the India, China and America Institute (USA), Shanghai Institutes for International Studies (China) and the EU Center (Singapore). For more, see https://www.differencegroup.net
The original commentary was released by China-US Focus on Feb. 11, 2020
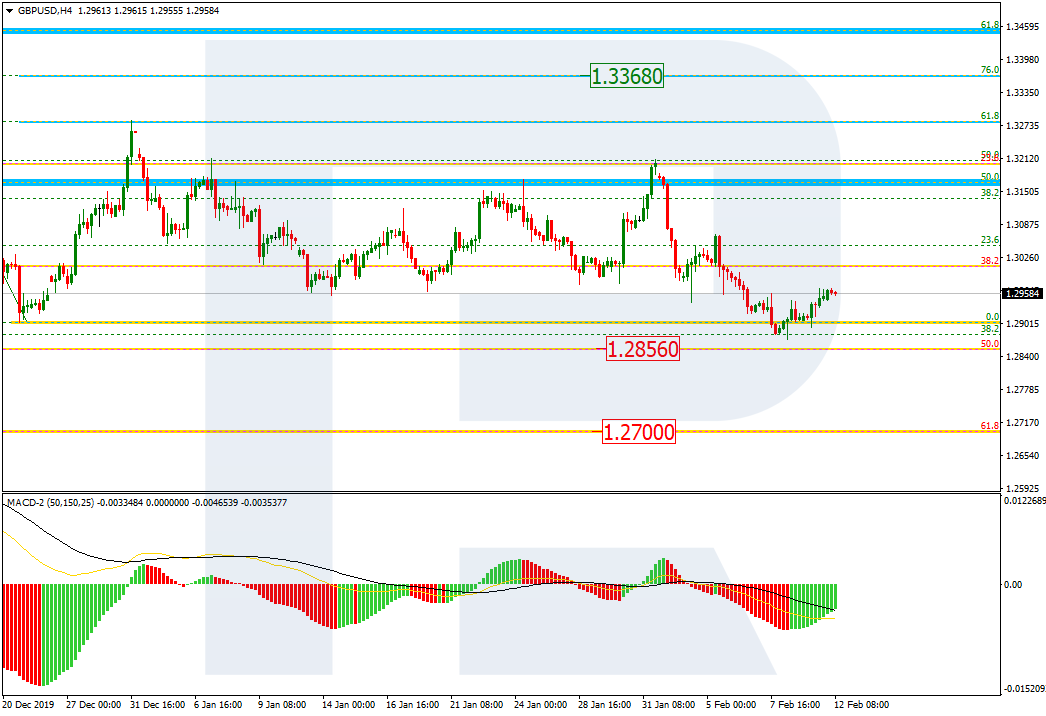
As we can see in the H4 chart, GBPUSD has tested the previous low, thus indicating that the price may continue falling towards 50.0% and 61.8% fibo at 1.2856 and 1.2700 respectively. in the nearest future, the instrument is expected to form a new correction to the upside.
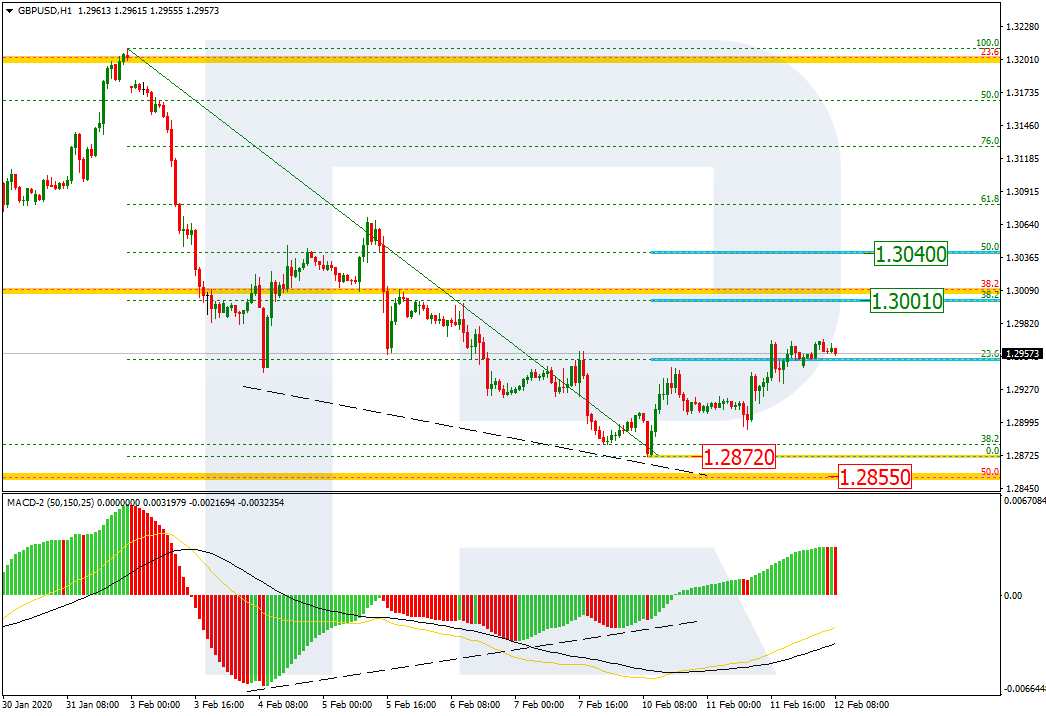
The H1 chart shows a rising correction after the convergence on MACD. By now, it has already reached 23.6% fibo and may continue growing towards 38.2% and 50.0% fibo at 1.3001 and 1.3040 respectively. The support is the low at 1.2872.
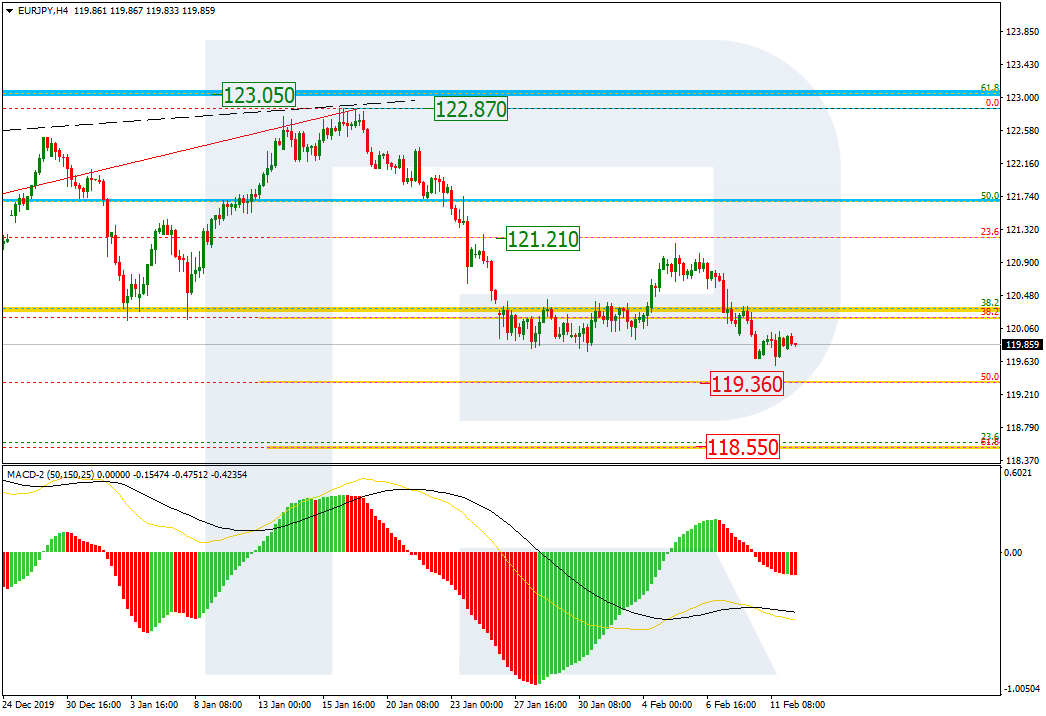
EURJPY, “Euro vs. Japanese Yen”
As we can see in the H4 chart, after finishing a pullback towards the resistance at 121.21, EURJPY is forming a new descending impulse, which has already updated the low. Later, the current decline may continue towards 50.0% and 61.8% fibo at 119.36 and 118.55 respectively.
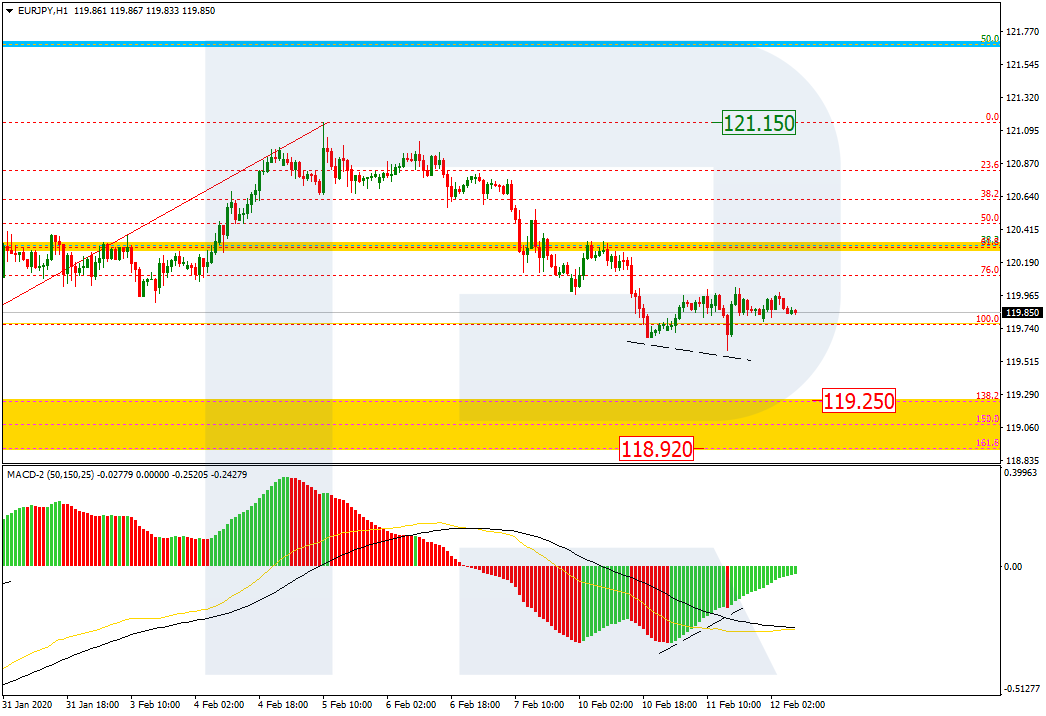
The H1 chart shows a new correction to the upside after the convergence on MACD. After finishing the correction, the instrument may resume falling to reach the post-correctional extension area between 138.2% and 161.8% fibo at 191.25 and 118.92 respectively.
Attention! Forecasts presented in this section only reflect the author’s private opinion and should not be considered as guidance for trading. RoboForex LP bears no responsibility for trading results based on trading recommendations described in these analytical reviews.
The US dollar has become stable against major competitors. The dollar index (#DX) closed yesterday’s trading session with a slight decrease (-0.18%). However, the demand for US currency remains at a fairly high level. Financial market participants assess the speech by Fed Chairman Jerome Powell for Congress. The official believes the economy is strong. He also noted that the Chinese coronavirus might have some influence on the United States, but it is too early to talk about it. The Central Bank monitors risks, but now the monetary policy is in line with the current situation.
The British pound has been growing after the publication of positive economic data from the UK. So, GDP (YoY) grew by 1.1% in the 4th quarter, which turned out to be better than the forecasted growth by 0.8%. GDP (m/m) grew by 0.3% instead of 0.2%. Manufacturing production (m/m) grew by 0.3 in December, although experts expected an increase by 0.5%.
Today, the Reserve Bank of New Zealand has decided on the interest rate during the Asian trading session. The indicator remained unchanged at 1.00%.
The “black gold” prices are rising. Currently, futures for the WTI crude oil are testing the $50.60 mark per barrel. At 17:30 (GMT+2:00), crude oil inventories will be published.
Market Indicators
Major US stock indices have updated historic highs again: #SPY (+0.17%), #DIA (+0.00%), #QQQ (+0.02%).
The 10-year US government bonds yield increased slightly. At the moment, the indicator is at the level of 1.62-1.63%.
The Economic News Feed for 12.02.2020:
We recommend paying attention to the speech by Fed Chairman Powell.