‘The Rock’ Exploring for Copper and Silver in Canada

By The Gold Report – Source: Ron Struthers for Streetwise Reports   02/12/2020

Ron Struthers of Struthers’ Resource Stock Report shares his thoughts on gold and the coronavirus, and profiles Rockridge Resources, a company with an advanced-stage copper project and a high-grade gold prospect, both in Canada.

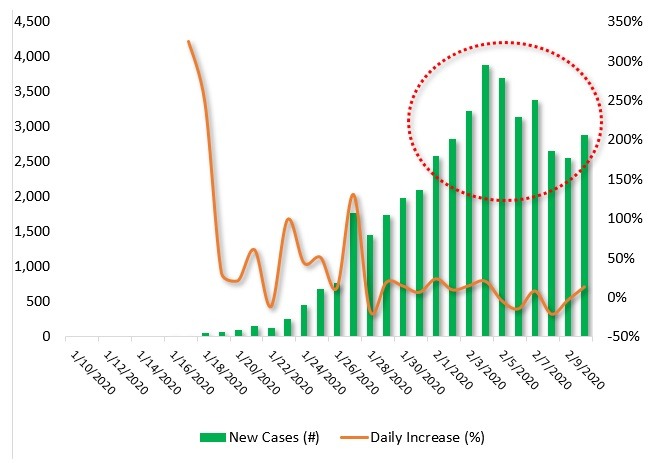
Gold is about to soar in price because of a worldwide misinformation campaign. So far the effects from the coronavirus are being mostly ignored by the markets. There seems to be hope that this virus will be contained or maybe it is denial of economic damage it will, and could cause.

Furthermore we are getting statistics from a government that is notorious for a lack of transparency.

The Chinese government probably does not even know how bad it is. The reported amount dead already exceeds SARS and the death rate of 2.5% may compare low but it is not if multiples more contract the virus. There is a website in China called Tencent, it is like Google or Facebook here. Tencent posted some numbers about 10 times greater that government statistics. Why would they be so far off, fake news but within hours the post taken down.

The Lancet in UK, a prestigious medical journal, did a study and used a model based on city population and travelling, etc. Based on hard data and a past reliable model, it came back 5 to 10 times worse than official China government statistics. We have two separate entities that produced results way higher than government stats. Also looking at what the people are seeing there and reporting sounds far worse than government stats.

They cannot even keep up to the death count as bodies are disposed of without confirmation testing. I have no doubt the situation is far worse than government reported stats. Remember, it is the government’s job and best interest whether here, Europe or China to promote stable economies and markets.

The best solution is a vaccine, but that usually takes two or three years, even if they get it in six months, there is the distribution and administering. China’s biological warfare weapons lab is in Wuhan, which is ground zero. What are the possibilities this is a leak from that lab? Let’s hope not, but China is not co-operating with the World Health Organization either, and that does not help the situation.

Symptoms don’t show for 10 to 14 days, which makes the whole containment initiative very difficult. The current estimate has 60 million people under quarantine and most travel is at a standstill. You have probably heard of some of the effects like Starbucks closing half their stores in China.

China is the manufacturing engine of the world and we are relying on them for so many goods that few realize. Practically all the smartphones are made there and what happens to a company and stock like Apple when they have a severe shortage of products to sell? This is just one example out of thousands. China is a manufacturing hub so it relies on transportation of goods into the country to assemble, then shipping finished goods out. If factories close or transportation halts, it does not just slow things down, it grinds it down to zero.

The economic impact could be catastrophic. What if markets start to price in the worst? China’s and the world economy were already slowing ahead of this. The U.S. is doing the best in the world but still GDP is only around 2%. This coronavirus is going to get much worse before it gets better and it is happening in an already weak economy. We are a few months away from seeing any impact; that could start showing with Q1 data.

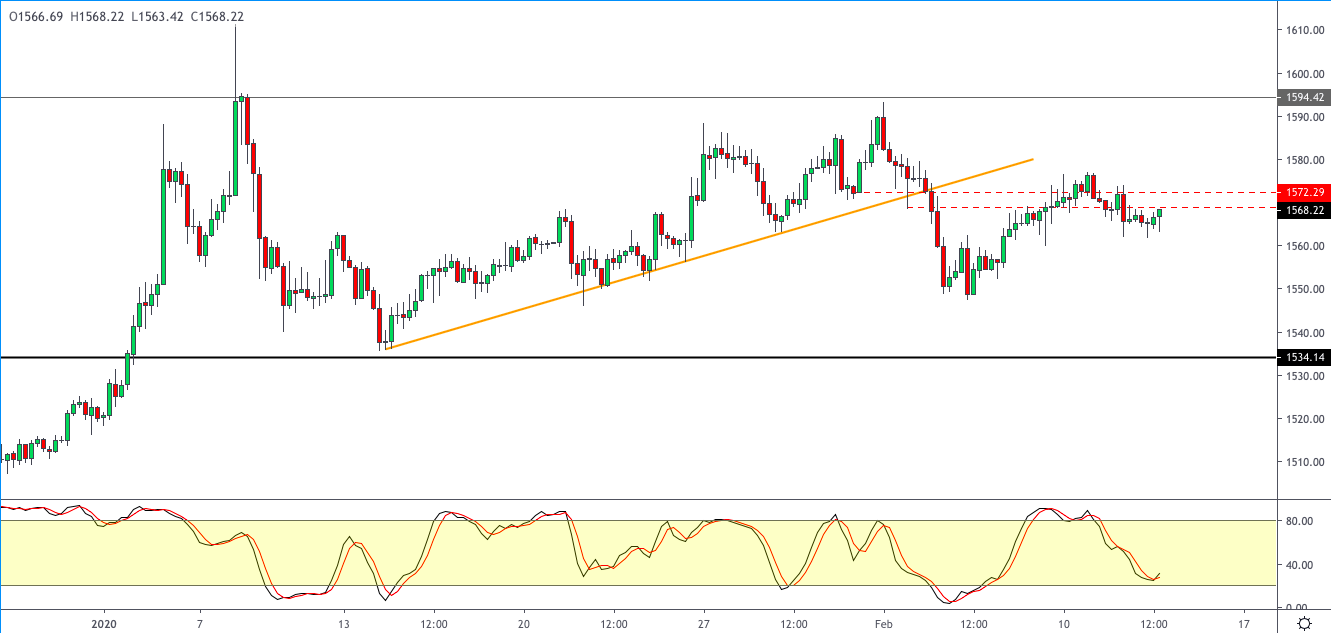
Slowing economies will results in more QE and a quicker move to zero interest rates. U.S. stock markets are frothy at record levels and the balloon is seeking a pin. These factors are all positive to gold and the price chart is just itching to break to the upside. I commented previously that I wanted to see a close above $1600 to confirm a break out, but let’s call a spade a spade. Since gold broke higher in early January the chart looks like a consolidation above the previous high. This usually results in higher prices. Now is an excellent time to add both producers and quality junior gold companies to our portfolio.

This underpriced junior has an advanced stage copper project in the Flin Flon VMS belt of Saskatchewan and a high-grade gold prospect in the Timmins gold camp, Ontario. The gold project is the current focus as they are just starting a drill program. The company’s strategy is to acquire projects in historical and prolific mining districts, apply modern exploration techniques to test new geological models and prove discoveries.

Rockridge Resources Ltd. (ROCK:TSX.V; RRRLF:OTC) (The Rock)

Recent Price $0.16
52 week trading range $0.13 to $0.39
Shares outstanding 33.9 million, Fully diluted 50.3M

Highlights:

  • Knife Lake Project – Flin Flon district of Saskatchewan which is ranked #3 in the world by Fraser Institute
  • Over 300 drill holes for 43-101 resource estimate
  • Near surface Indicated resource of 3.8M tonnes at 1.02% Cu Eq and Inferred resource of 7.9M tonnes at 0.67% Cu Eq
  • Raney Gold project SW of Timmins, best drill intercept 6.5 g/t Au over 8.0 meters
  • New geological model indicates south dip (previously thought north)
  • Very limited drilling and open on strike and depth
  • Strong management with extensive experience, some highlights below

Management – highlights

Grant Ewing, P.Geo, CEO, is a geologist with over 25 years of experience in the mineral industry and the last 10+ years in senior executive roles. His extensive knowledge base covers the entire mine development cycle, from early stage exploration through to production, in several different commodities. Strong merger and acquisitions, corporate development, and capital markets knowledge complement his mineral industry experience.

Recently, he was president and CEO of Kiska Metals (2014 to 2017) until it was acquired by AuRico Metals, where he continued as vice president exploration of AuRico Metals until it was acquired by Centerra Gold for approximately $300 million. Prior to that, he was president and CEO of Acadian Mining (2010 to 2014) until its sale to an international mining company. Atlantic Gold later acquired and is currently developing the projects that Acadian advanced through the discovery and resource development stages.

Jordan Trimble, president and director, has worked in the resource industry in various roles with numerous companies specializing in management, corporate finance/strategy, deal structuring and capital raising. He is the president and CEO of Skyharbour Resources Ltd., and was previously the corporate development manager for Bayfield Ventures, a gold company with projects in Ontario that was successfully acquired by New Gold (TSX: NGD) in 2014. Bayfield made a high-grade gold and silver discovery at its Burns Block property in the Rainy River district, which is now a part of the producing Rainy River Mine. Through his career Trimble has founded and helped manage several public and private companies and has been instrumental in raising substantial amounts of capital for mining companies with his extensive network of institutional and retail investors.

Ron Netolitzky, strategic advisor, has had an illustrious career in the mining and exploration industry with over 40 years of experience and having been directly associated with three major discoveries in Canada that subsequently went into production: Eskay Creek, Snip and Brewery Creek. Netolitzky has been honored with the Prospector of the Year award from the PDAC, and Developer of the Year award from the BC & Yukon Chamber of Mines. In 2015, he was inducted into the Canadian Mining Hall of Fame.

Joseph Gallucci, MBA, B.Comm, director, is a capital markets executive with over 15 years of experience in investment banking and equity research focused on mining, base metals, precious metals and bulk commodities on a global scale. Gallucci is currently the managing director and the head of mining investment banking at Laurentian Bank Securities Inc. His career has spanned across various firms including BMO Capital Markets, GMP Securities, Dundee Securities, and he was a founding principal of Eight Capital where he recently led their Mining Investment Banking Team.

Richard Kusmirski, P.Geo, M.Sc., director, has over 40 years of exploration experience in North America and overseas, and has actively participated in the discovery of a number of uranium, gold and base metal deposits. For several years, in his capacity as exploration manager, he directed Cameco Corporation’s (TSX: CCO) uranium exploration projects in the Athabasca Basin. In 1999, Kusmirski joined JNR Resources becoming VP of exploration in 2000. Subsequently, he directed the exploration program that led to the discovery of the Maverick Zone on the Moore Lake uranium joint venture in the Athabasca Basin in Saskatchewan with partner Kennecott Canada. Kusmirski became JNR’s president and CEO in January of 2001. In February of 2013, Denison Mines Corp. (TSX: DML) successfully acquired all of the outstanding shares of JNR by way of a friendly all-share take-over bid.

Raney Gold Project, Timmins, 100% option

The property is located in Ontario, 110 km SW of Timmins, on the eastern side of Raney Lake. The property is accessible by highway and secondary roads. It is in the Archean Swayze Greenstone Belt, which is a part of the Abitibi Greenstone Belt that hosts the world-class Timmins and Kirkland Lake gold mining camps.

The property has excellent access and infrastructure and is accessible by paved and forestry roads. Work by MPH Ventures in 2009 and 2010 consisted of trenching and sampling, induced polarization (IP) surveys, followed by drilling. MPH Ventures completed four separate phases of drilling on the Raney Project between early 2009 and early 2010. Hole R-09-08 returned 6.5 g/t Au over 8.0 meters, and established a 50-meter strike length for gold mineralization, extending from historical hole 99-01 to RAN-08-04.

  • Hole R-09-011 intersected 4.7 g/t Au over 3.0 meters, including 11.5 g/t Au over 1.0 meters.
  • Hole R-09-14 intersected 1.43 g/t Au over 2.25 meters, extending mineralization 100 meters west of the original discovery.

This zone needs to be tested for continuity with additional drilling, at and below the 150 meter level. The presence of a gold system as identified on the Raney Gold Project would suggest that the remainder of the project should be explored for additional gold structures. This graphic from the company’s presentation will give you a good picture of the limited area drilled and potential for expansion.

If The Rock’s new geological model proves correct we could see much longer drill intersects and higher grades at depth.

Last week The Rock announced plans to mobilize and commence an exploration drill program at its Raney gold project. Chenier Drilling Services Inc. has been contracted to conduct the drilling program and will mobilize its equipment for the program in mid-February. Chenier Drilling has carried out drill programs for IAMgold at the nearby Cote project. An exploration permit for the program is in hand that provides for exploration activities including geophysical surveys and diamond drilling to be conducted over three years.

Planned drill program summary

Historical drilling at the Raney gold project focused on identifying near-surface gold mineralization along an extensive alteration zone. Three sub-parallel and closely spaced mineralized zones of quartz carbonate alteration with quartz veining, pyrite, pyrrhotite and occasionally visible gold have been outlined. The drilling to date suggests the possibility of steeply plunging shoots of mineralization with reasonable widths open along strike.

A compilation and interpretation of historic data have resulted in the development of a new geologic model for the project. This new model indicates that the mineralized zones may have a steep south dip orientation versus the historical model that showed a steep north dip. Continuity between the mineralized zones correlate better along strike and down dip with the new model. The strike potential of the mineralized zones may be expanded as some of the historic exploration drill holes would have missed the target zone with the new geologic model.

The planned phase 1 exploration drill program will entail approximately 2,000 meters in 7 to 10 holes. The initial drill holes will target the zone that produced the best historical intercept of 6.5 g/t gold over eight meters. This zone occurs below the 100-meter level and is open for expansion. Mobilization of the drill will occur in mid-February with the drilling program expected to take approximately 60 days to complete. Updates from the field and drill program will be provided as the program progresses.

While the Raney gold project is the near-term focus, The Rock’s other asset is substantial and provides a solid base valuation for the company even if the current stock price is showing little value.

Knife Lake Project, Saskatchewan, 100% option

The 85,197 hectare Knife Lake Project is 130km north-northwest of Flin Flon and 45km north of Sandy Bay. A new power line 16km from the deposit area greatly enhances the project’s infrastructure. Since the initial discovery of mineralization in 1915, the Flin Flon camp has produced over 170 million tons of sulphide ore from 31 VMS deposits worth in excess of $25 billion dollars (2002 NRC, Current Research). Over 50% of deposits in the camp have been advanced to production, which have led to 86 consecutive years of mining. More recently, activity in the region has picked up including Rio Tinto’s $30 million earn-in option on the Janice Lake project northeast of Knife Lake, Glencore helping advance the McIlvenna Bay project through a feasibility study, Hudbay’s new high-grade discovery near the Lalor mine, and Greenstone’s $29 million strategic investment in Rockcliff Metals to advance and develop several VMS deposits around Flin Flon and Snow Lake.

The Knife Lake Project area is an advanced-stage copper, silver, zinc and cobalt exploration property with extensive exploration completed from the late 1960s to the 1990s. Prior to The Rock’s involvement, the last documented work program was completed in 2001. Over 300 holes provided data for the first NI 43-101 resource estimate.

Knife Lake NI 43-101 resource estimate provides excellent anchor for the project:

  • Indicated resources: 3.8 MT @ 1.02% Cu Eq.
  • or 3.8 MT @ 0.83% Cu, 3.7 gpt Ag, 0.097 gpt Au, 82 ppm Co,1740.7 ppm Zn.
  • Inferred resources: 7.9 MT @ 0.67% Cu Eq.
  • or 7.9 MT @ 0.53% Cu, 2.4 gpt Ag, 0.084 gpt Au, 53.1 ppm Co, 1454.9 ppm Zn.

Rockridge completed the first work program in the last ~20 years in 2019. Results included 2.03% Cu, 9.88 g/t Ag, 0.19 g/t Au, 0.36% Zn, and 0.01% Co (2.42% CuEq) over 37.6m beginning at 11.2m in hole KF19003.

The deposit is a remobilized portion of a presumably larger “primary” VMS deposit; most of the historical work has consisted of shallow drilling at the deposit area with little regional work carried out and limited deeper drilling below the deposit. There are 11 highly prospective priority targets and numerous second priority targets. The 2019 summer field exploration focused on refining three priority targets noted below. The field program included geological mapping, geochemical sampling and soil sampling.

Gilbert Lake target area is west of the Knife Lake deposit and is +14 km of highly prospective VMS stratigraphy, shallow EM conductors with favorable alteration and mineralization.

Scimitar Lake target area is east of the deposit and is 3.4 km of prospective VMS stratigraphy with EM conductors. The majority of conductors are untested along strike and at depth.

Machete is located north-northwest of the deposit and is +10km of prospective VMS stratigraphy with ab airborne EM anomaly. There is no documented exploration on this target.

There is strong discovery potential in and around the deposit as well as at regional targets on the property. The Rock plans to use modern exploration techniques and methods to make new discoveries.

Financials

Last financials as of October 2019 show almost $400,000 cash and no debt. Since then The Rock raised $1.04 million in a private placement with 3,210,000 units at 12.5 cents per share and 4,572,715 flow-through units at 14 cents . Each unit has a 1/2 warrant with a whole warrant exercisable at 25 cents for three years. The company is well funded for the current drill program and beyond.

Summary

I have nicknamed the company “The Rock” not just because of the symbol but I believe the company is rock solid and so is the investment. The management team is extensive and has experience with juniors that were bought out for their discoveries. The stock value is underpinned by its advanced copper VMS deposit, Knife Lake in Flin Flon, and also has upside there given it is a remobilized deposit. There is more upside with the Raney gold project the company is about to drill, as well with the new geological model. The company is relatively new as it acquired its first project, Knife Lake, in November 2018. The share structure is very good with just 34 million shares outstanding and with strong insider ownership.

The company is focused on copper and gold, which I believe is a good combination. Large copper deposits have become very hard to find and copper has a bright future as the world becomes electrified, especially the growing demand for electric vehicles. With years of inflated markets, easy monetary policy and heading to zero interest rates, the bull market in gold has a long way to go.

Given the large land package The Rock has northwest of Flin Flon, additional discoveries are likely. The stock was about double the current price last year based on Knife Lake. We will soon have news flow from drilling at the Raney Gold project and since a discovery has already been made, the odds of good drill results are high. If the company’s new geological model proves correct there could be some very pleasant upside with the drill results.

The stock chart looks very good. The stock broke the down trend channel in early January and the recent pull back from the 23 cent high is a very good entry level. It is also not much above support I see around 14 cents so it appears there is very little downside.

Ron Struthers founded Struthers’ Resource Stock Report 23 years ago. The report covers senior and junior companies with ample trading liquidity. He started his Millennium Index of dividend stocks in 2003 – $1,000 invested then was worth over $4,000 end of 2014 and the index returned 26.8% in 2016. He retired from IBM after 30 years in customer service, systems and business analyst, also developing his own charting software. He has expertise in junior start-ups and was a co-founder of Paramount Gold and Silver.

Sign up for our FREE newsletter at: www.streetwisereports.com/get-news

Disclosure:
1) Ron Struthers: I, or members of my immediate household or family, own shares of the following companies mentioned in this article: I currently own 40,000 shares of Rockridge Resources. I personally am, or members of my immediate household or family are, paid by the following companies mentioned in this article: None. My company currently has a financial relationship with the following companies mentioned in this article: Rockridge Resources is an advertiser at playstocks.net. Additional disclosures below. I determined which companies would be included in this article based on my research and understanding of the sector.
2) The following companies mentioned in this article are sponsors of Streetwise Reports: Skyharbour Resources. Click here for important disclosures about sponsor fees.
3) Statements and opinions expressed are the opinions of the author and not of Streetwise Reports or its officers. The author is wholly responsible for the validity of the statements. The author was not paid by Streetwise Reports for this article. Streetwise Reports was not paid by the author to publish or syndicate this article. The information provided above is for informational purposes only and is not a recommendation to buy or sell any security. Streetwise Reports requires contributing authors to disclose any shareholdings in, or economic relationships with, companies that they write about. Streetwise Reports relies upon the authors to accurately provide this information and Streetwise Reports has no means of verifying its accuracy.
4) This article does not constitute investment advice. Each reader is encouraged to consult with his or her individual financial professional and any action a reader takes as a result of information presented here is his or her own responsibility. By opening this page, each reader accepts and agrees to Streetwise Reports’ terms of use and full legal disclaimer. This article is not a solicitation for investment. Streetwise Reports does not render general or specific investment advice and the information on Streetwise Reports should not be considered a recommendation to buy or sell any security. Streetwise Reports does not endorse or recommend the business, products, services or securities of any company mentioned on Streetwise Reports.
5) From time to time, Streetwise Reports LLC and its directors, officers, employees or members of their families, as well as persons interviewed for articles and interviews on the site, may have a long or short position in securities mentioned. Directors, officers, employees or members of their immediate families are prohibited from making purchases and/or sales of those securities in the open market or otherwise from the time of the interview or the decision to write an article until three business days after the publication of the interview or article. The foregoing prohibition does not apply to articles that in substance only restate previously published company releases. As of the date of this interview, officers and/or employees of Streetwise Reports LLC (including members of their household) own securities of Skyharbour Resources, a company mentioned in this article.

Charts and images provided by the author.

Author’s Disclosures: Copyright 2020, Struthers’ Resource Stock Report. All forecasts and recommendations are based on opinion. Markets change direction with consensus beliefs, which may change at any time and without notice. The author/publisher of this publication has taken every precaution to provide the most accurate information possible. The information & data were obtained from sources believed to be reliable, but because the information & data source are beyond the author’s control, no representation or guarantee is made that it is complete or accurate. The reader accepts information on the condition that errors or omissions shall not be made the basis for any claim, demand or cause for action. Because of the ever-changing nature of information & statistics the author/publisher strongly encourages the reader to communicate directly with the company and/or with their personal investment adviser to obtain up to date information. Past results are not necessarily indicative of future results. Any statements non-factual in nature constitute only current opinions, which are subject to change. The author/publisher may or may not have a position in the securities and/or options relating thereto, & may make purchases and/or sales of these securities relating thereto from time to time in the open market or otherwise. Neither the information, nor opinions expressed, shall be construed as a solicitation to buy or sell any stock, futures or options contract mentioned herein. The author/publisher of this letter is not a qualified financial adviser & is not acting as such in this publication.

c. Copyright 2020, Struther’s Resource Stock Report

( Companies Mentioned: ROCK:TSX.V,
)

Canadian Palladium Makes a Debut

By The Gold Report

Source: Bob Moriarty for Streetwise Reports   02/12/2020

Bob Moriarty of 321gold discusses the name change and prospects for Canadian Palladium Resources.

I first wrote about a company named 21C last May. The company has a pair of “green energy” projects, palladium in Canada and cobalt/copper in Europe. And easily had the worse name of any company I ever knew. I hated the name 21C. What exactly did that mean?

Well, no thanks to me, the company changed the name to one of the very best names I have ever heard, especially valuable right now. They are now Canadian Palladium Resources Inc. (BULL:CSE; DCNNF:OTCQB) with the same symbol, BULL-V. Good timing as palladium went on a tear last week with prices touching $2602 USD before settling down. I would be quite comfortable with a correction; I hate it when any commodity goes curvilinear.

South Africa has gone stupid and socialist. What the government charges for electricity is lower than the cost of production. The mines across the country are getting killed with a constant lack of power. South Africa produces 78% of the world’s platinum and about 45% of the world’s production of palladium. We easily could have a multi-year shortage of both metals. Right now the near contracts for palladium carry a premium to the distant months indicating a severe shortage of the metal.

There are only a few juniors working in the platinum palladium space. Palladium has had a hell of a run lately while platinum has been about as exciting as watching paint dry. Personally I’d like to see the entire precious metals marketplace have a nice scary correction, bottoms are easier to see. But month after month the metals just keep climbing.

I love the fact that 21C changed their name to something highly meaningful. Just knowing what the company is about will bring in new buyers in what is a small area of the metals.

Canadian Palladium is well cashed up, just having completed a $4 million dollar placement as well as having Eric Sprott as a major investor. In the recent private placement the company issued 33 million shares and 33 millions warrants exerciseable at $0.18 which are already at the money. Should the price continue higher, that would bring in an additional $6 million which would pay for a lot more drilling. Days ago the company announced a 10,000 meter drill program designed to expand an existing 523,000 Pd ounce equivalent resource. Drilling has commenced.

With an $18 million market cap and $1.1 billion worth of metal in an inferred resource, Canadian Palladium is well positioned for an advance on any real success in their ongoing drill program. I don’t know if the palladium shortage reflects a real lack of physical metal but for now and at today’s price for palladium BULL looks like a good bet if you like the numbers on the metal.

Canadian Palladium is an advertiser and I have participated in a private placement in the past. Naturally that makes me biased so do your own due diligence.

Canadian Palladium
BULL-C $0.18 (Feb 12, 2020)
DCNNF-OTCQB 100.3 million shares
Canadian Palladium Website.

Bob Moriarty founded 321gold.com, with his late wife, Barbara Moriarty, more than 16 years ago. They later added 321energy.com to cover oil, natural gas, gasoline, coal, solar, wind and nuclear energy. Both sites feature articles, editorial opinions, pricing figures and updates on current events affecting both sectors. Previously, Moriarty was a Marine F-4B and O-1 pilot with more than 832 missions in Vietnam. He holds 14 international aviation records.

Sign up for our FREE newsletter at: www.streetwisereports.com/get-news

Disclosure:
1) Bob Moriarty: I, or members of my immediate household or family, own shares of the following companies mentioned in this article: Canadian Palladium. My company has a financial relationship with the following companies mentioned in this article: Canadian Palladium is an advertiser on 321 Gold. I determined which companies would be included in this article based on my research and understanding of the sector.
2) The following companies mentioned are billboard sponsors of Streetwise Reports: None. Click here for important disclosures about sponsor fees.
3) Statements and opinions expressed are the opinions of the author and not of Streetwise Reports or its officers. The author is wholly responsible for the validity of the statements. The author was not paid by Streetwise Reports for this article. Streetwise Reports was not paid by the author to publish or syndicate this article. The information provided above is for informational purposes only and is not a recommendation to buy or sell any security. Streetwise Reports requires contributing authors to disclose any shareholdings in, or economic relationships with, companies that they write about. Streetwise Reports relies upon the authors to accurately provide this information and Streetwise Reports has no means of verifying its accuracy.
4) The article does not constitute investment advice. Each reader is encouraged to consult with his or her individual financial professional and any action a reader takes as a result of information presented here is his or her own responsibility. By opening this page, each reader accepts and agrees to Streetwise Reports’ terms of use and full legal disclaimer. This article is not a solicitation for investment. Streetwise Reports does not render general or specific investment advice and the information on Streetwise Reports should not be considered a recommendation to buy or sell any security. Streetwise Reports does not endorse or recommend the business, products, services or securities of any company mentioned on Streetwise Reports.
5) From time to time, Streetwise Reports LLC and its directors, officers, employees or members of their families, as well as persons interviewed for articles and interviews on the site, may have a long or short position in securities mentioned. Directors, officers, employees or members of their immediate families are prohibited from making purchases and/or sales of those securities in the open market or otherwise from the time of the interview or the decision to write an article until three business days after the publication of the interview or article. The foregoing prohibition does not apply to articles that in substance only restate previously published company releases.

( Companies Mentioned: BULL:CSE; DCNNF:OTCQB,
)

Mexico cuts rate 5th time, global risks still to downside

By CentralBankNews.info

Mexico’s central bank lowered its benchmark interest rate for the fifth time, saying the balance of risks to the global economy remain to the downside due to a range of uncertainties, “including the effects of the recent coronavirus outbreak,” despite a further easing of global financial conditions.

The Bank of Mexico, known as Banxico, cut its target for the overnight interbank interest rate by 25 basis points to 7.0 percent and has now cut it five times and by a total of 125 points since July 2019 when it began to unwind some of the 500-point rate hikes in the three years from December 2015 to December 2018.

“Economic slowdown, low inflation, accommodative monetary policies, and lower interest rates continue to prevail in the world economy,” said the central bank, adding the bank’s board was unanimous in its decision.

In a new and more concise policy statement, aimed at getting is message more easily across to the public, Banxico said the prevalence of external and domestic risks could affect domestic financial markets, adding the peso’s exchange rate and yields on government securities had fallen in recent weeks.

Economic activity in Mexico has stagnated for several quarters, and economic growth this year is now seen growing less than forecast in the third quarter quarterly report, the central bank said, without providing further details.

In its quarterly inflation report released in November Banxico lowered its estimate of 2019 economic growth to between a contraction of 0.2 percent and growth of 0.2 percent, down from an earlier forecast of 0.2 – 0.7 percent growth.

In the fourth quarter of 2019, Mexico’s gross domestic product shrank an annual 0.3 percent, the same as in the third quarter, with growth for the full year estimated to contract 0.1 percent, sharply down from 2018 growth of 2.1 percent.

For 2020 Banxico cut its growth forecast to 0.8 – 1.8 percent from 1.5 – 2.5 percent and forecast growth in 2021 of 1.3 – 2.3 percent.

In January Mexico’s consumer price inflation rate rose 3.24 percent, within the central bank’s target of 3.0 percent, plus/minus 1 percentage point.

The central bank has recently warned that a 20 percent hike in minimum wages by Mexico’s government in December, the second major increase in as many years, could push up inflation and make it difficult to bring inflation down to its target this year.

Mexico’s peso has been rising this year and rose further after the rate cut to 18.63 to the U.S. dollar, up 1.6 percent this year.

The Bank of Mexico released the following press release:

“Banco de México’s Governing Board has decided to lower the target for the overnight interbank interest rate by 25 basis points to 7%.

Economic slowdown, low inflation, accommodative monetary policies, and lower interest rates continue to prevail in the world economy. Although in this context global financial conditions have continued to loosen, the balance of risks for world economic activity remains biased to the downside due to several factors of uncertainty, including the effects of the recent coronavirus outbreak. In this context, over the last weeks the peso exchange rate appreciated and interest rates on government securities of all maturities decreased. Nevertheless, external and domestic risks prevail which could affect the performance of domestic financial markets.

Economic activity in Mexico has remained stagnant for several quarters, with a generalized weakness in aggregate demand components. Thus, slack conditions have continued to widen. Based on most recent data, GDP in 2020 is foreseen to grow less than estimated in the Quarterly Report July-September 2019, with a balance of risks biased to the downside.

Between November 2019 and January 2020 annual headline inflation rose from 2.97% to 3.24%, mainly due to the increase in the non-core component from 0.98% to 1.81%, while core inflation did so from 3.65% to 3.73%. Core inflation was affected by the increase in the prices subject to the excise tax (IEPS, for its acronym in Spanish) and continues to show resistance to decline. Short-, medium- and long-term headline inflation expectations have remained relatively stable, albeit at levels above 3%, while core inflation expectations for the same terms were revised upwards.

In light of the recent behavior of the factors affecting the foreseen path of inflation, headline and core inflation are expected to be moderately above the forecasts published in the last Quarterly Report. Regarding risks to the foreseen trajectory for inflation, those prevailing to the upside include: core inflation’s resistance to decline; wage increases affecting the labor market and prices; a possible exchange rate adjustment due to external or domestic factors; increases in agricultural and livestock prices greater than expected; and a deterioration of public finances. As for downside risks: a further appreciation of the peso exchange rate; lower international prices of energy goods due to the coronavirus outbreak; and a greater economic slack. In this context, uncertainty still persists regarding the balance of risks for the referred trajectory of inflation.

With the presence of all its members, Banco de México’s Governing Board decided unanimously to lower the target for the overnight interbank interest rate by 25 basis points to 7%. To this end, the current levels of headline inflation, the inflation outlook within the time frame in which monetary policy operates, the greater amount of economic slack, and the recent behavior of external and domestic yield curves, were considered.

The Governing Board will take the necessary actions based on incoming data so that the policy rate is consistent with the orderly and sustained convergence of headline inflation to Banco de México’s target within the time frame in which monetary policy operates. To strengthen the macroeconomic framework and the country´s growth capacity, in addition to a prudent monetary policy, public finances must be consolidated in a sustainable way.”

www.CentralBankNews.info


Q4 European GDP & The Euro Reaction

By Orbex

The week is going to close with a bang for euro traders.

There is a host of economic data coming out in the morning that routinely riles up the markets. Key among them is the much anticipated quarterly GDP figures from Germany and then the entire eurozone.

With the ECB more focused on supporting the economy lately, the data could give us some insight into potential policy changes over the rest of the semester.

Recently, EBC head Lagarde expressed some pessimism about the prospects of Europe’s economy. This was followed by poor industrial production data out of Germany.

So will the bad news continue?

What We Are Looking For

Germany reports its GDP before European trading gets underway.

Although we get more data later in the day, the quarterly change in German GDP generally sets the tone for the market’s performance. This is because Germany is the largest country in the eurozone.

The consensus of expectations is that German GDP grew by just 0.1% in the final quarter of the year. This would be the same as the dismal third quarter.

On an annualized basis, that would mean the economy grew by 1.0%. That result would be a bit of an improvement over the 0.2% registered in the prior measurement. It would actually be an improvement over 2019 overall in which Germany registered a technical recession.

So, you could argue that with these figures, Germany will register technical growth.

Three hours later the eurozone reports its GDP figures. Not all that surprisingly, these are very similar to Germany’s.

Quarterly economic growth is projected to be 0.1% compared to 0.1% prior. On an annualized basis, projections indicate that eurozone GDP will have grown 1.0%, the same as the prior measure.

The Situation

Germany has been back in the news lately with some things that are likely to have a drag on the economy.

But, they all happened after the fourth quarter was over. Thus, they won’t be reflected in the data. In other words, these less than positive results are likely to be the high-water mark in the German economy for a while.

The markets don’t like uncertainty. And another round of leadership contests of the leading political party isn’t going to make investors comfortable. Especially when it could include a resignation of the Chancellor, depending on who gets put forward!

The Fundamentals

The other factor is that supply disruptions from the coronavirus are likely to have affected German manufacturers (as well as other parts of Europe).

Some analysts put the effect between 0.3-0.6% in GDP, which would imply that Q1 growth will be negative this year. That’s the first step for Germany falling again into a technical recession.

On the other hand, corporate earnings out of Europe have so far performed better than expected, if only because expectations have been low. Stock indices have managed to push higher ahead of the largest components of the DAX and Stoxx600 reporting through the week, while the euro suffered.

By Orbex


Predictive Modeling Suggests Gold Will Break Above $1650 Within 15~30 Days

By TheTechnicalTradersOur Adaptive Dynamic Learning predictive modeling system is suggesting Gold will rally above $1650 within the next 2 to 4 weeks, then settle into a narrow price range above $1600.  If you’ve followed our analysis of Gold over the past few months and years, you already know we expect Gold to rally above $1750 this year and to continue to move higher attempting to breach the $2100 level.  It is just a matter of time as far as we are concerned where Metals begin a massive upside rally as the global debt markets become an issue throughout the world.

Right now, there is a very clear opportunity for Gold to rally nearly $100 over the next few weeks.  Our ADL predictive modeling system is suggesting this really should begin very soon and will likely propel the price of Gold to levels above $1640 before March 15. Of course, as we’ve seen before if price stays below the $1600 level for another few weeks, this will set up a “price anomaly” where the price will, at some point, attempt to rally very aggressively to the upside to make up the difference.

Weekly Gold ADL Chart

This Weekly Gold ADL chart highlights the predicted price movement higher, above $1640, then sideways afterward – setting up a new momentum base.  You can see how Gold enters rally phases, then bases for 5 to 10+ weeks.  We believe this next move higher will be a continued advancement leg in Gold that may prompt a short momentum base before another rally sets up near April/May 2020.

Monthly Gold ADL Chart

This Monthly Gold ADL chart highlights our overall trend expectations for Gold going out 8+ months into the future.  We believe this upside price rally is ultimately targeting levels above $1800.  It will likely attempt this move in multiple upside price legs containing various pause/momentum basing events.  Yet we believe the ultimate upside objective in Gold is really $1800 to $1850 before a new downside leg will setup.  That downside leg will end fairly quickly, then the next wave of buying will push the price above $2100 and ultimately much higher.

If you have not yet seen our silver and silver miner charts and predictions see this article.

Concluding Thoughts:

This is an excellent opportunity for skilled traders to attempt to buy Gold or Silver near current levels before the upside breakout pattern drives prices 4% to 6% higher ($75 to $100).  Pay attention to our research and be prepared for these bigger sector swings.  2020 is going to be a great year for technical traders.

Learn how we can help you find and execute better trades and turn the extreme volatility into solid profits.  Read our research and see what our research team has been predicting over the past few months.  We dedicate our efforts to helping you find great trades and helping you protect your assets.

Join my ETF Trade Alert Newsletter if you like what you read here and ride my coattails as I navigate these financial markets and build wealth while others lose nearly everything they own.

Chris Vermeulen
TheTechnicalTraders.com

NOTICE: Our free research does not constitute a trade recommendation or solicitation for our readers to take any action regarding this research.  It is provided for educational purposes only.  Our research team produces these research articles to share information with our followers/readers in an effort to try to keep you well informed.  Visit our web site to learn how to take advantage of our members-only research and trading signals.


US Crude Stocks Surge Higher

By Orbex

Crude Inventories Rally

Crude prices have been fighting to reclaim some higher ground this week. However, the rally was capped on Wednesday by the latest report from the Energy Information Administration. The EIA reported that in the week ending February 7th, US crude inventories rose by a further 7.5 million barrels. This increase was well above the 2.3 million barrels forecast by the market. The figure takes total inventory levels to 435 million barrels.

The data comes on the back of the API reporting a 6 million barrel inventory increase and sees inventory levels extending recent surpluses. The EIA has now reported three consecutive weekly increases in inventory levels with 3.4 and 3.5 million increases seen over the last two weeks.

Gasoline & Distillate Stockpiles Fall

Elsewhere, the data showed that gasoline inventories fell by 100k barrels last week. This was in stark contrast to the 546k barrel increase forecast by the market. Distillate inventories, including diesel and heating oil, were also lower by 2 million barrels. This was far deeper than the 55k barrel decline forecasts and sees distillate inventories running down to 143.2 million barrels.

The data also showed that refinery crude runs were higher by 48k barrels last week. Refinery utilization rates were higher by 0.6%. Net US crude imports also rose by 806k barrels over the last week.

Despite the data this week, which has weighed on crude prices, oil has generally had a better week. The asset has benefitted from better risk sentiment. The outbreak of the coronavirus has weighed on crude prices over recent weeks due to expectations of reduced demand. However, this week, the market seems to be displaying more optimism towards the virus which has mainly only seen deaths in China.

EIA Reduces US Crude Production Outlook

The latest Short Term Energy Outlook Report was released a day ahead of the inventories this week. In the report, the EIA lowered its US crude-production outlook. The EIA now forecasts crude production of 13.2 million barrels. This is down 0.8% from the last forecasts. 2021 production forecast was lowered by 1.1% also. Despite the lowered production forecasts, with crude demand forecast to fall also, crude prices are forecast to end the year around $55.71. This is 6% lower than the prior forecast.

Technical Perspective

Crude prices continue to range within the contracting triangle forming at the foot of the recent declines. Price is clinging to the 51 level for now though the outlook remains skewed to the downside. If price breaks below here the next level to watch is the 47.68. If price breaks to the topside, the 53.70 level is the next zone to watch.

By Orbex


Equities Maintain A Steady Grip

By Orbex

Equity markets are holding steady as they trade close to the all-time highs. This comes amid a mixed investor sentiment. Gold prices also continue to hold steady. The economic calendar is generally quiet and Powell’s speech did not give much for investors to digest.

Eurozone Industrial Production Data

Industrial production in the Eurozone fell more than forecast in the month of December. Official data from Eurozone showed that industrial production fell 2.1% on the month in December. This follows a flat print in November. The economist’s forecasts were for a 1.7% decline. All aspects of the production fell. The data follows weak manufacturing and industrial figures from Germany.

EURUSD Could be Set for a Correction

Price action in EURUSD indicates a possible correction might be underway. The Stochastics on the 4-hour chart suggests a possible bullish divergence. Price action needs to break past the pivot high of 1.0922 to confirm the upside. The immediate target is at 1.0952, followed by a move back to 1.1000 resistance.

Weekly Crude Oil Inventory Rises

The weekly crude oil inventory report from the US Energy Information Administration showed a strong build-up. For the week ending February 8th, crude oil inventory rose 7.5 million barrels. This was slightly higher than the API’s report of a 6 million build in inventory. WTI crude oil prices, however, brushed aside the report to post some modest gains.

WTI Crude Oil Looks to be Forming a Bottom

Crude oil prices are likely forming a bottom following a modest rebound. However, the declines are still not out of the woods. Oil prices are trading at 51.65 resistance level. Only a breakout above this level can confirm a corrective move in price. In the short term, WTI crude oil could remain range-bound within the 51.65 and 50.00 regions.

Gold Prices Continue to Consolidate

Gold prices are holding steady amid lack of volatility. Prices are rising modestly after a decline the day before. Economic data remains sparse and investors are picking up cues from the global themes including the Coronavirus and the US monetary policy. Fed Chair Powell gave his second day of testimony to the Congress.

XAUUSD Retesting the Resistance

A day after posting some modest declines, gold is back close to testing the resistance area of 1573 – 1569. With the Stochastics oscillator hinting at a possible move higher, we could see some pickup in momentum. But gold needs to clearly break past the resistance area to confirm further upside. Secondly, it also needs to break past the previous pivot highs to maintain the uptrend.

By Orbex


Virus Outbreak at Crossroads? Impact on ASEAN

By Dan Steinbock     

The virus outbreak is showing possible signs of steadying, although the number of accumulated cases will continue to rise. The economic impact on the ASEAN depends on the outbreak’s duration and severity.

With the new coronavirus – the 2019 novel coronavirus acute respiratory disease (2019-nCoV ARD) – there are now (2 pm Wuhan time, Feb 11) more than 42,600 confirmed cases worldwide. If the current pace prevails, that figure will exceed 50,000 in the coming days.

And yet, there may be something else going on behind the reported figures.

Toward possible turnaround?

On the one hand, the number of confirmed cases outside China is less than 500, and there have been only two deaths, which both are associated with the virus epicenter Wuhan. While these numbers are likely to increase in the near future, the low starting-point suggests that China’s costly and draconian measures may have saved many lives within and particularly outside China.

More importantly, the pace of the contagion may be decelerating in China. In international media, the spotlight is mainly on the absolute numbers of accumulated cases and deaths, which are likely to increase. And yet, the relative increase of these accumulated cases has decreased ever since mid-January.

Even more importantly, the relative daily increase of new cases, which have critical impact on the longer-term duration and severity of the outbreak, may be amid a crossroads.

The confirmed new cases increased steadily from mid-January soaring to almost 3,900 on February 4. Since then the numbers have fallen below 2,700. In relative terms, the change has been almost progressive, having plunged from almost 350% to negative (Figure).

Figure Is the virus outbreak at a crossroads?

Confirmed New Cases, Jan 1 to Feb 8, 2020

Source: DifferenceGroup. Data from China’s National Health Commission;

The big question is, will the trend prevail. While the data could indicate a possible turnaround in the virus outbreak, there is no assurance that the deceleration will prevail. It is well known that virus trend lines can zigzag. Consequently, complacency in the struggle against the outbreak is no option.

Also, all projections rely on data accuracy and presume the absence of adverse mutations within and outside China. Furthermore, the trend lines are predicated on the idea that there will be no new, major outbreaks as people in China are now returning to their homes after the holiday period. Finally, the trend is predicated on the idea that containment will succeed outside China, where precautions have been lagging in many countries, including high-income nations.

As WHO chief Tedros Adhanom Ghebreyesus has warned, confirmed cases of coronavirus being transmitted by people who have never traveled to China could be the “tip of the iceberg.”

Economic impact on Southeast Asia

Since mid-2018, ASEAN countries have suffered collateral damage associated with the US-Sino trade friction, slowing world trade and eroding global growth.  Even before the outbreak, regional growth prospects were downgraded by 0.3-0.4 percentage points for 2019-2020. Now, Southeast Asian economies may face new downgrades associated with the outbreak’s likely economic impact (on the basic scenarios, see my previous TMT column of Feb 3, 2020).

Last December, the Asian Development Bank (ADB) revised its forecast down to 4.4% for 2019 but maintained at 4.7% for 2020.  The latter was predicated on the anticipated mild recovery in China and the US. It will be downgraded.

Prior to the virus outbreak, growth forecasts were downgraded for Singapore and Thailand, but upgraded for Brunei and Vietnam, with the remaining ASEAN economies on track to meet forecasts, despite export declines and weaker investment weighing on growth prospects.

In early 2020, downgrades are likely to deepen in Singapore and Thailand, while positive prospects in Vietnam will not prevail. Growth forecasts in Taiwan and East Asia – South Korea and Taiwan – will be penalized, due to anticipated supply chain disruptions, particularly in electronics, machinery and textiles.

Growth prospects in Singapore have eroded significantly and will be compounded by the outbreak. The 2020 real GDP forecast could be downgraded to less than 1%. In Hong Kong, political volatility coupled with the outbreak will extend the technical recession into the 1st quarter.

The rest of Southeast Asia – Malaysia, Indonesia, Lao, Cambodia, Myanmar, and the Philippines – will find it hard to stay on track with forecasts. In the past year, softening domestic investment exacerbated export woes in most larger economies—Indonesia, Malaysia, Philippines, Singapore, and Thailand—but domestic consumption held up to cushion the slowdown.

Since household spending is the first victim of the virus outbreak, larger economies will not be immune to it. But in each case, the specific country impact will depend on the duration and severity of the virus spread.

About the Author:

Dr. Dan Steinbock is an internationally recognized strategist of the multipolar world and the founder of Difference Group. He has served at the India, China and America Institute (USA), Shanghai Institutes for International Studies (China) and the EU Center (Singapore). For more, see https://www.differencegroup.net

The original commentary was released by The Manila News on Feb. 10, 2020. The data has been updated (Feb 11, 2020)


Ichimoku Cloud Analysis 13.02.2020 (AUDUSD, NZDUSD, USDCAD)

Article By RoboForex.com

AUDUSD, “Australian Dollar vs US Dollar”

AUDUSD is trading at 0.6715; the instrument is moving below Ichimoku Cloud, thus indicating a descending tendency. The markets could indicate that the price may test the cloud’s upside border at 0.6725 and then resume moving downwards to reach 0.6575. Another signal to confirm further descending movement is the price’s rebounding from the descending channel’s upside border. However, the scenario that implies further decline may be canceled if the price breaks the cloud’s upside border and fixes above 0.6775. In this case, the pair may continue growing towards 0.6845 and form a Double Bottom reversal pattern. After breaking the support area and fixing below 0.6645, the price may resume moving downwards.

AUDUSD
Risk Warning: the result of previous trading operations do not guarantee the same results in the future

NZDUSD, “New Zealand Dollar vs US Dollar”

NZDUSD is trading at 0.6446; the instrument is moving below Ichimoku Cloud, thus indicating a descending tendency. The markets could indicate that the price may test the cloud’s upside border at 0.6455 and then resume moving downwards to reach 0.6295. Another signal to confirm further descending movement is the price’s rebounding from the descending channel’s upside border. However, the scenario that implies further decline may be canceled if the price breaks the cloud’s upside border and fixes above 0.6525. In this case, the pair may continue growing towards 0.6605.

NZDUSD
Risk Warning: the result of previous trading operations do not guarantee the same results in the future

USDCAD, “US Dollar vs Canadian Dollar”

USDCAD is trading at 1.3251; bulls still haven’t been able to fix the price above 1.3365. The instrument is moving inside Ichimoku Cloud, thus indicating a sideways tendency. The markets could indicate that the price may test the cloud’s downside border at 1.3235 and then resume moving upwards to reach 1.3435. Another signal to confirm further ascending movement is the price’s rebounding from the rising channel’s downside border. However, the scenario that implies further growth may be canceled if the price breaks the cloud’s downside border and fixes below 1.3205. If the instrument breaks 1.3325 close to the cloud’s upside border, the price may resume moving upwards.

USDCAD

Article By RoboForex.com

Attention!
Forecasts presented in this section only reflect the author’s private opinion and should not be considered as guidance for trading. RoboForex LP bears no responsibility for trading results based on trading recommendations described in these analytical reviews.

Japanese Candlesticks Analysis 13.02.2020 (EURUSD, USDJPY)

Article By RoboForex.com

EURUSD, “Euro vs. US Dollar”

As we can see in the H4 chart, the descending tendency continues. After breaking the channel’s downside border, EURUSD has completed several reversal candlestick patterns, such as Hammer. Right now, the pair may start reversing. We may assume that later the price may test the channel’s downside border and then resume its decline to reach the support level at 1.0849. However, one shouldn’t exclude a possibility that the price may return inside the channel and grow towards 1.0991.

EURUSD
Risk Warning: the result of previous trading operations do not guarantee the same results in the future

USDJPY, “US Dollar vs. Japanese Yen”

As we can see in the H4 chart, USDJPY is still moving inside the rising channel. After forming another Hanging Man pattern, the pair is reversing. The current situation implies that the pair may finish the correction and resume growing to reach the resistance level at 110.20. At the same time, the pair may choose another scenario, according to which it is expected to return to 109.00 without testing the resistance level.

USDJPY

Article By RoboForex.com

Attention!
Forecasts presented in this section only reflect the author’s private opinion and should not be considered as guidance for trading. RoboForex LP bears no responsibility for trading results based on trading recommendations described in these analytical reviews.