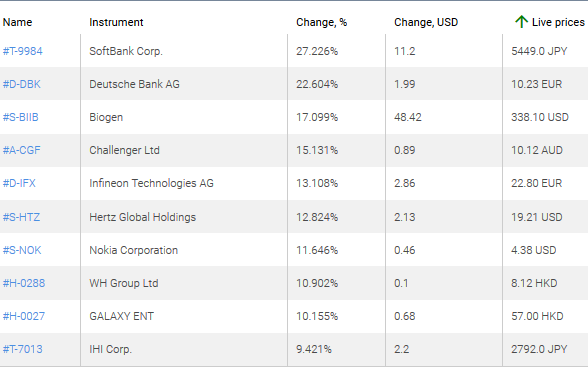
2. Tesla Motors Inc. – an American manufacturer of electric vehicles.
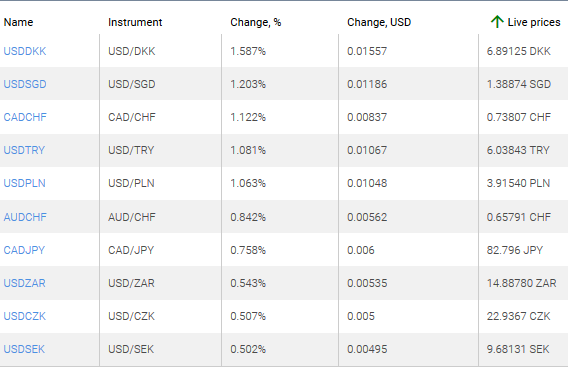
Top Gainers – Foreign Exchange Market (Forex)
1. USDDKK, USDSGD – an increase in these charts means the strengthening of the US dollar against the Singapore dollar and the Danish krone.
2. CADCHF, USDTRY – an increase in these charts means the weakening of the Swiss franc against the Canadian dollar and the Turkish lira against the US dollar.
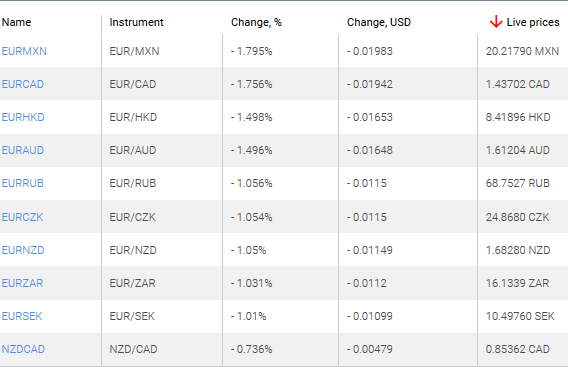
Top Losers – Foreign Exchange Market (Forex)
1. EURMXN, EURCAD – a decrease in these charts means the weakening of the euro against the Mexican peso and the Canadian dollar.
2. EURHKD, EURAUD – a decrease in these charts means the weakening of the euro against the Hong Kong and Australian dollars.
Note: This overview has an informative and tutorial character and is published for free. All the data, included in the overview, are received from public sources, recognized as more or less reliable. Moreover, there is no guarantee that the indicated information is full and precise. Overviews are not updated. The whole information in each overview, including opinion, indicators, charts and anything else, is provided only for familiarization purposes and is not financial advice or а recommendation. The whole text and its any part, as well as the charts cannot be considered as an offer to make a deal with any asset. IFC Markets and its employees under any circumstances are not liable for any action taken by someone else during or after reading the overview.
Higher export and lower supply forecasts bullish for soybean price
US Department of Agriculture increased its forecast for US soybean exports by 50 million bushels to 1.825 billion bushels in its WASDE February 11 report. At the same time it estimated a 10.5% decline of US soybean carryout from last month. And China customs data indicate soybean imports by China totaled 88.5 million tons for 2019, up 0.5% year on year, despite African Swine Fever and the trade war. Higher export and lower carryover forecasts are bullish for soybean prices.
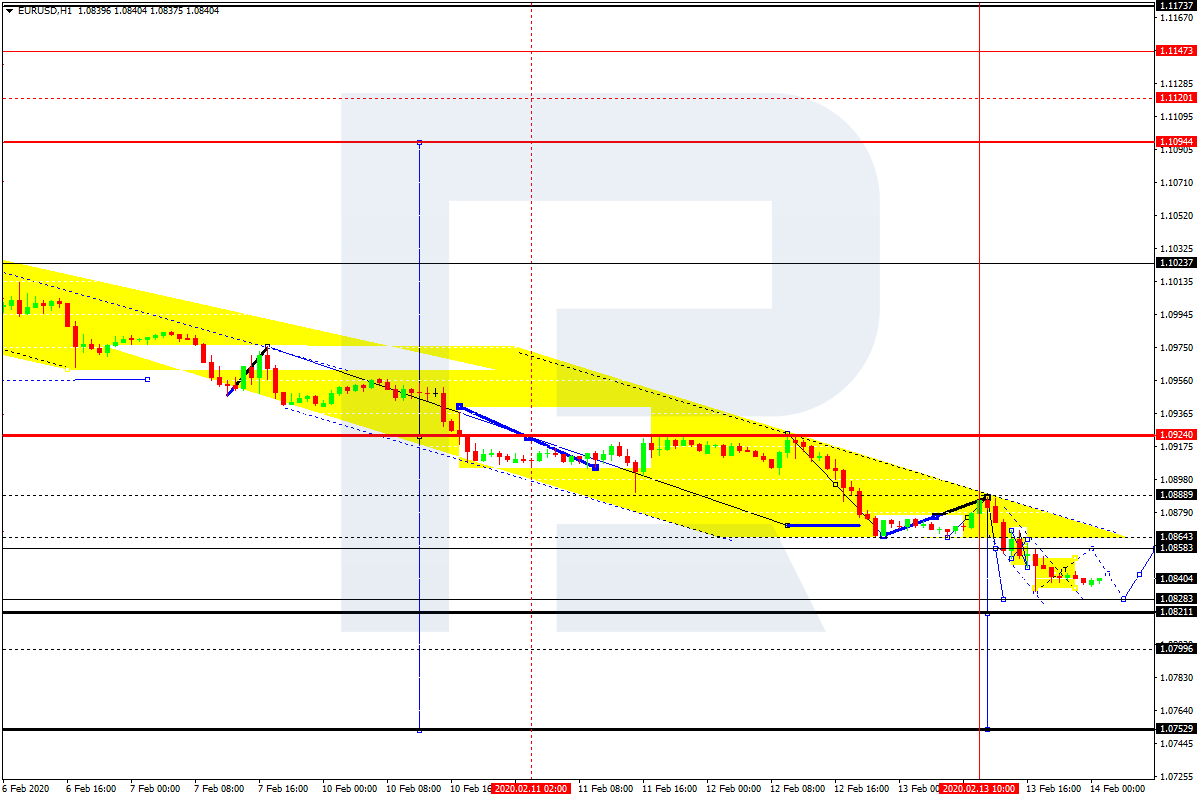
After finishing the correction towards 1.0888 and then breaking 1.0858 to the downside, EURUSD has formed a downside continuation pattern. Possibly, pair may continue falling to reach 1.0828. After that, the instrument may start another correction to test 1.0858 from below and then resume trading inside the downtrend with the target at 1.0799.
GBPUSD, “Great Britain Pound vs US Dollar”
GBPUSD has completed the ascending structure; right now, it is consolidating around 1.3034. If later the price breaks this range to the downside, the instrument may start a new correction to break 1.3000 and then continue trading downwards with the target at 1.2944.
USDCHF, “US Dollar vs Swiss Franc”
After breaking 0.9784 upwards, USDCHF has tested it from above. The main scenario implies that the pair may continue trading upwards to reach 0.9809. After that, the instrument may start a new correction towards 0.9794 and then form one more ascending structure with the target at 0.9828.
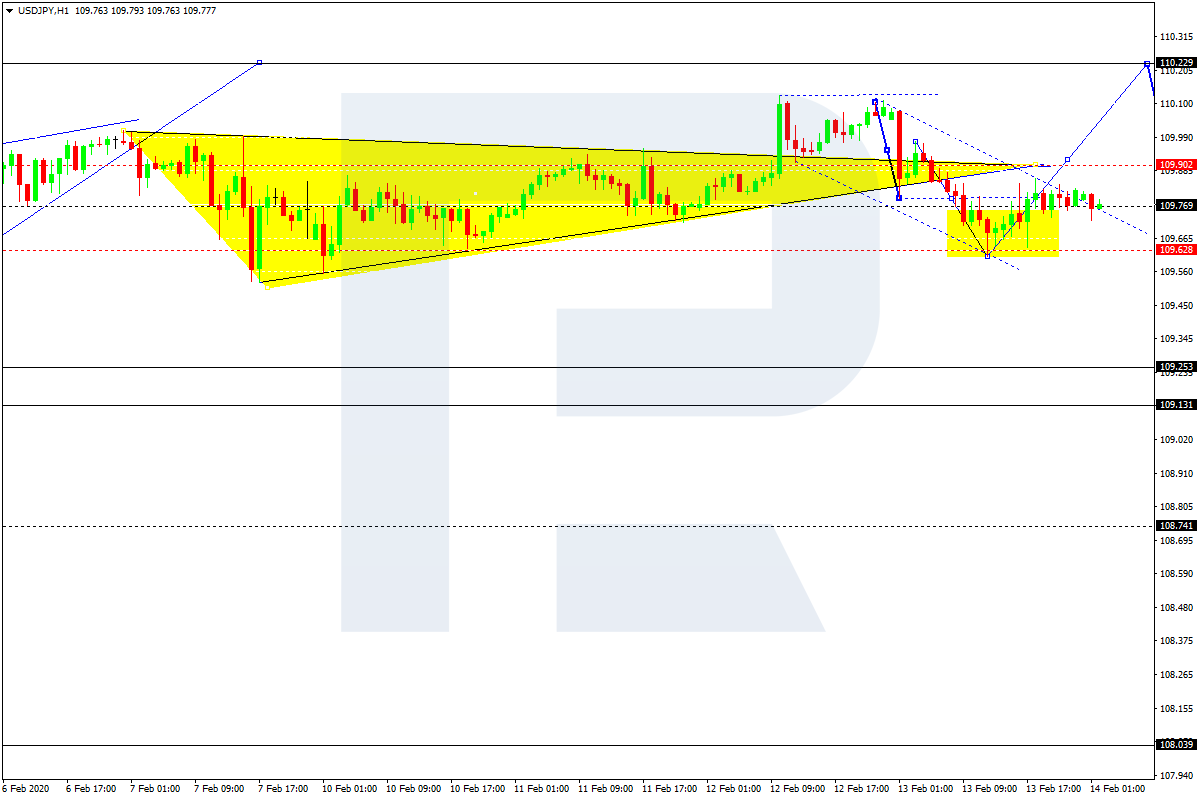
USDJPY, “US Dollar vs Japanese Yen”
USDJPY has finished the descending impulse towards 109.61; right now, it is growing to reach 109.90. Later, the market may form a new descending structure towards 109.75, thus forming a new consolidation range between these two levels. If later the price breaks this range to the downside, the instrument may start another decline towards 109.25; if to the upside – form one more ascending structure with the target at 110.22.
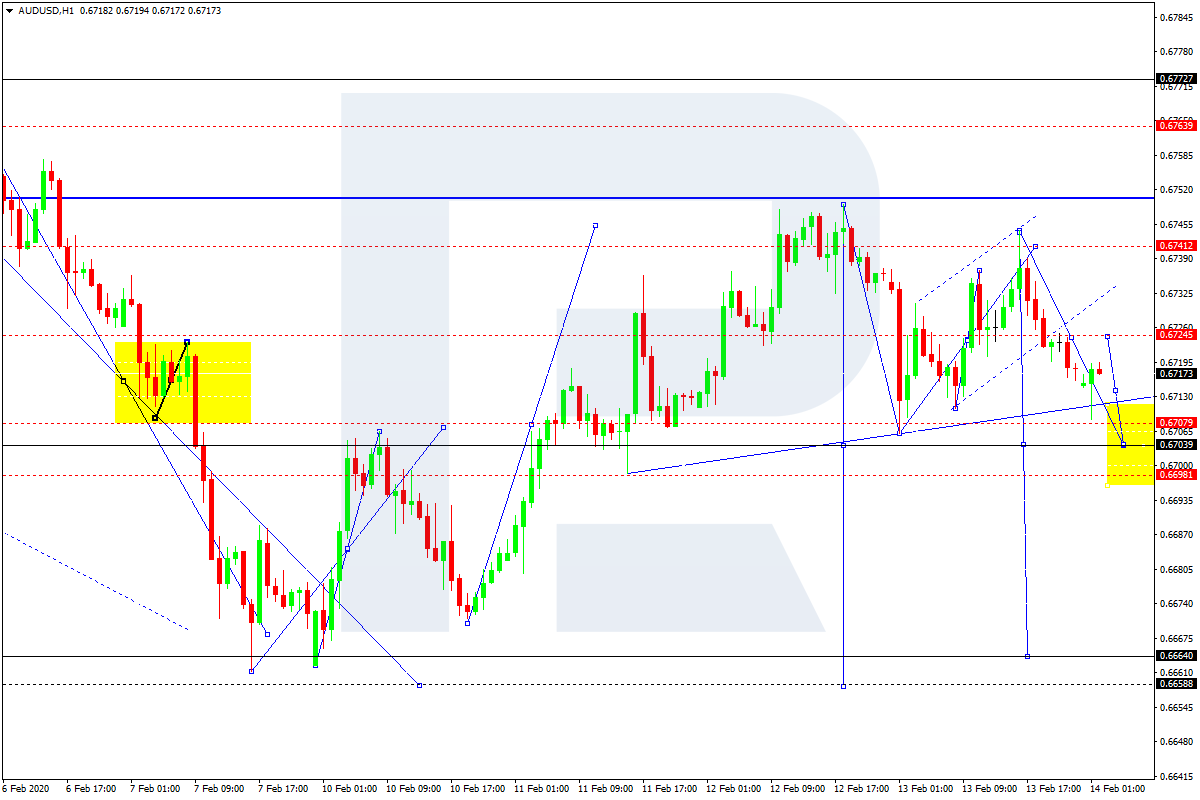
AUDUSD, “Australian Dollar vs US Dollar”
After completing the correction at 0.6742, AUDUSD has broken the correctional channel downwards. Possibly, the pair may trade downwards to break 0.6703 and then continue falling with the short-term target at 0.6680.
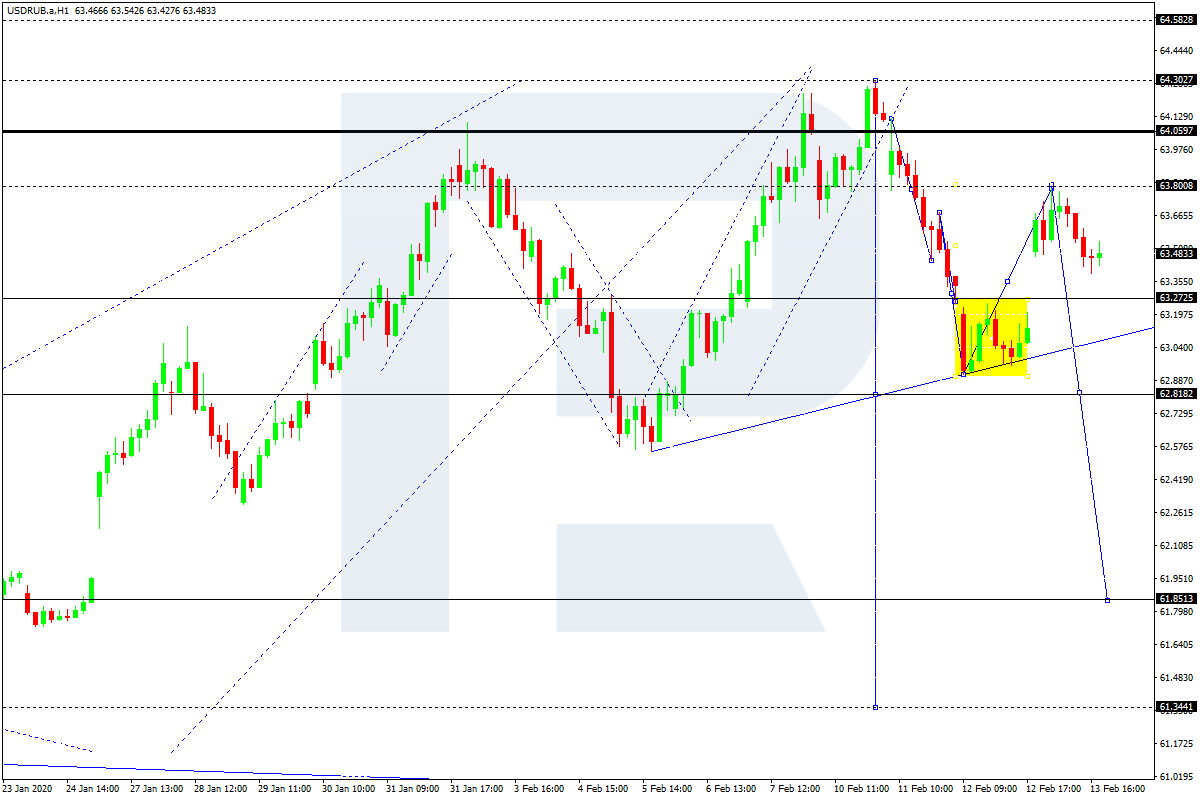
USDRUB, “US Dollar vs Russian Ruble”
USDRUB has finished the descending impulse at 62.91 along with the correction towards 63.77. Today, the pair may form a new descending impulse to break 62.81 and then continue trading inside the downtrend with the short-term target at 61.88.
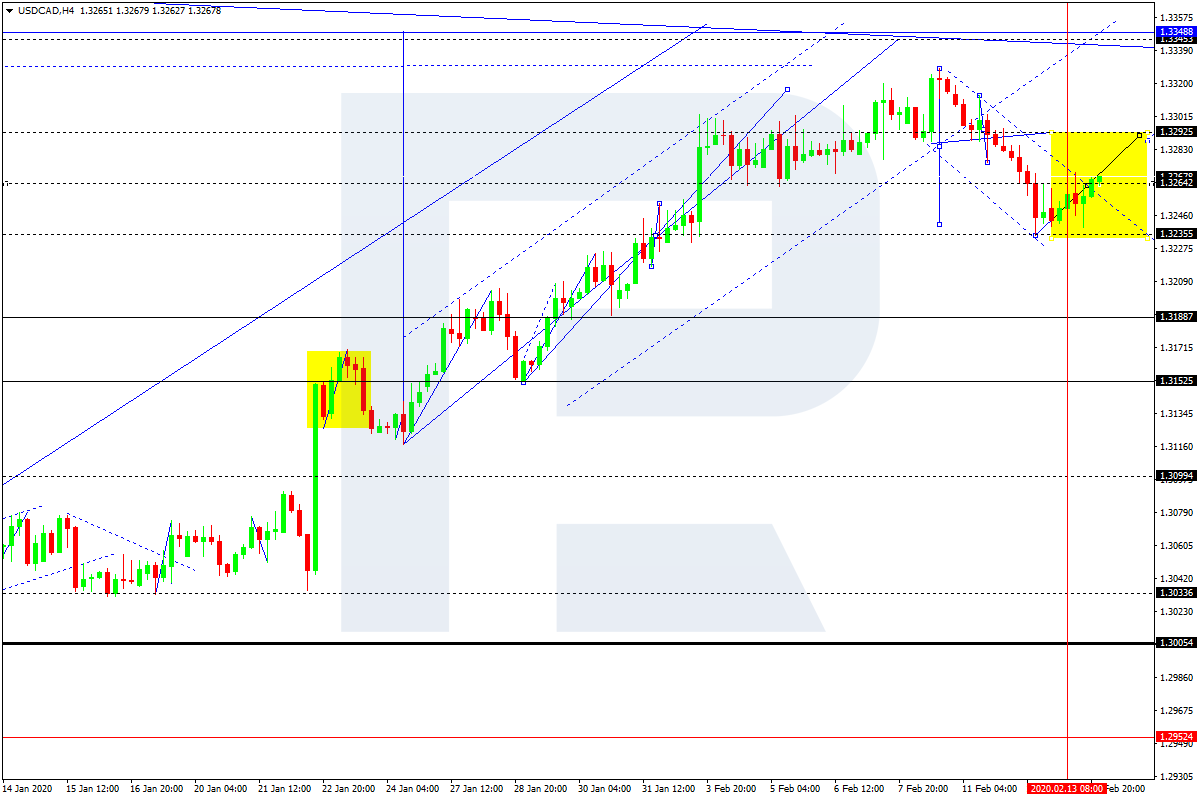
USDCAD, “US Dollar vs Canadian Dollar”
After completing the descending impulse towards 1.3235, USDCAD has broken this impulse’s channel upwards. Possibly, the pair may grow towards 1.3292 and then fall to return to 1.3264, thus forming a new consolidation range between these two levels. If later the price breaks this range to the downside, the instrument may start a new decline towards 1.3188; if to the upside – form one more ascending structure to reach 1.3344.
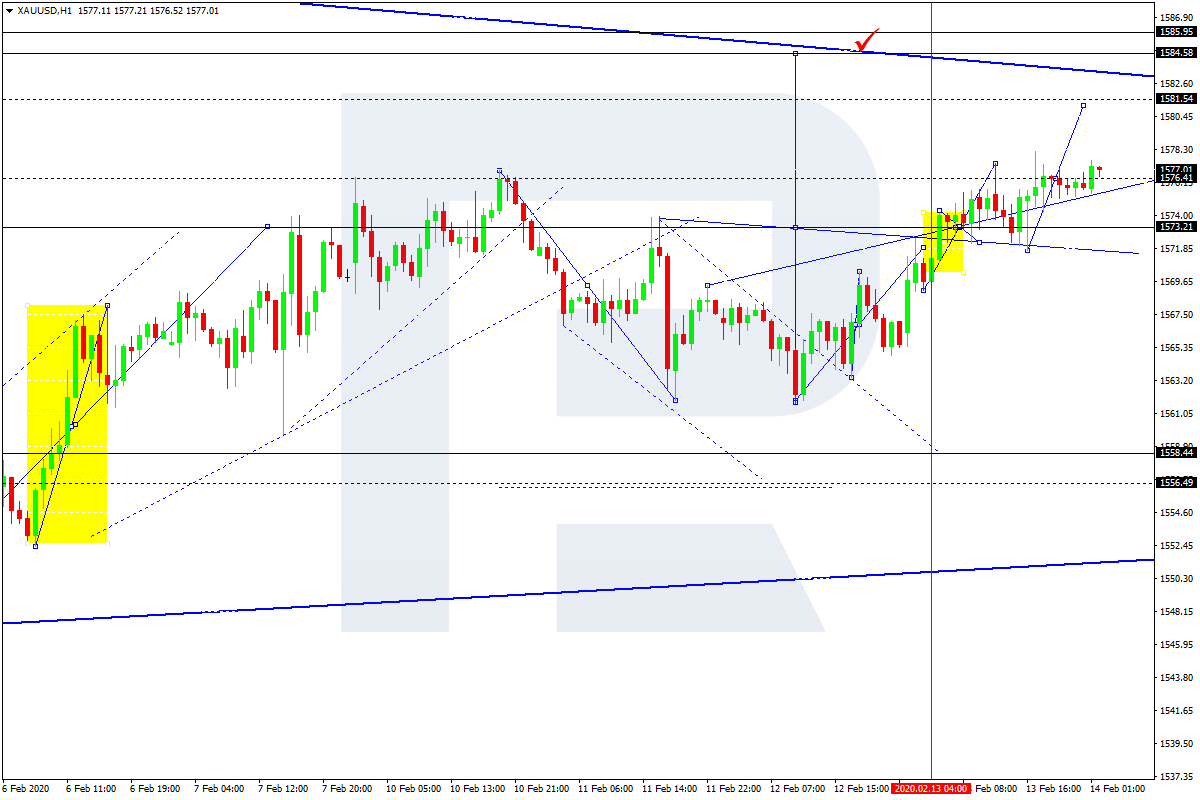
XAUUSD, “Gold vs US Dollar”
Gold is moving upwards. Today, the pair may reach 1581.54 and then start a new correction towards 1573.21. After that, the instrument may resume trading upwards with the target at 1584.58.
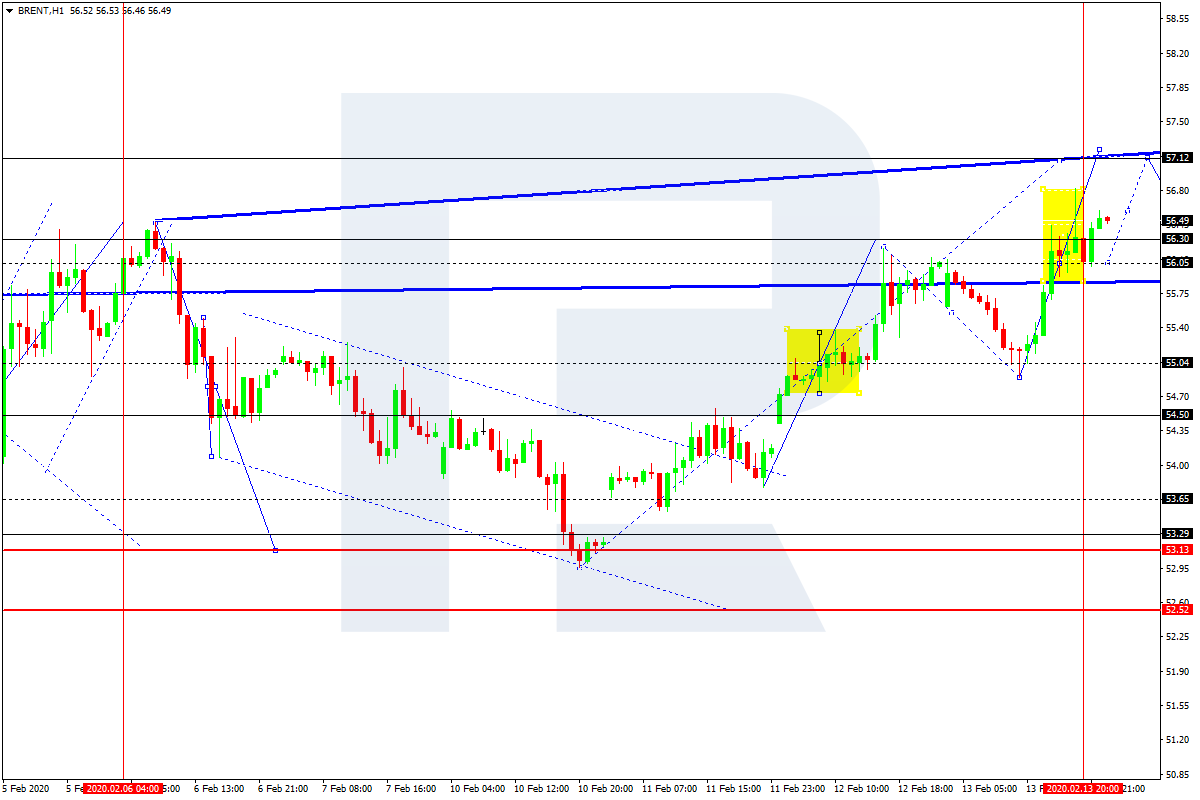
BRENT
Brent has reached its short-term target at 56.30; right now, it is consolidating below it. If later the price breaks this range to the downside, the instrument may start a new correction towards 55.05; if to the upside – resume trading inside the uptrend with the target at 57.12.
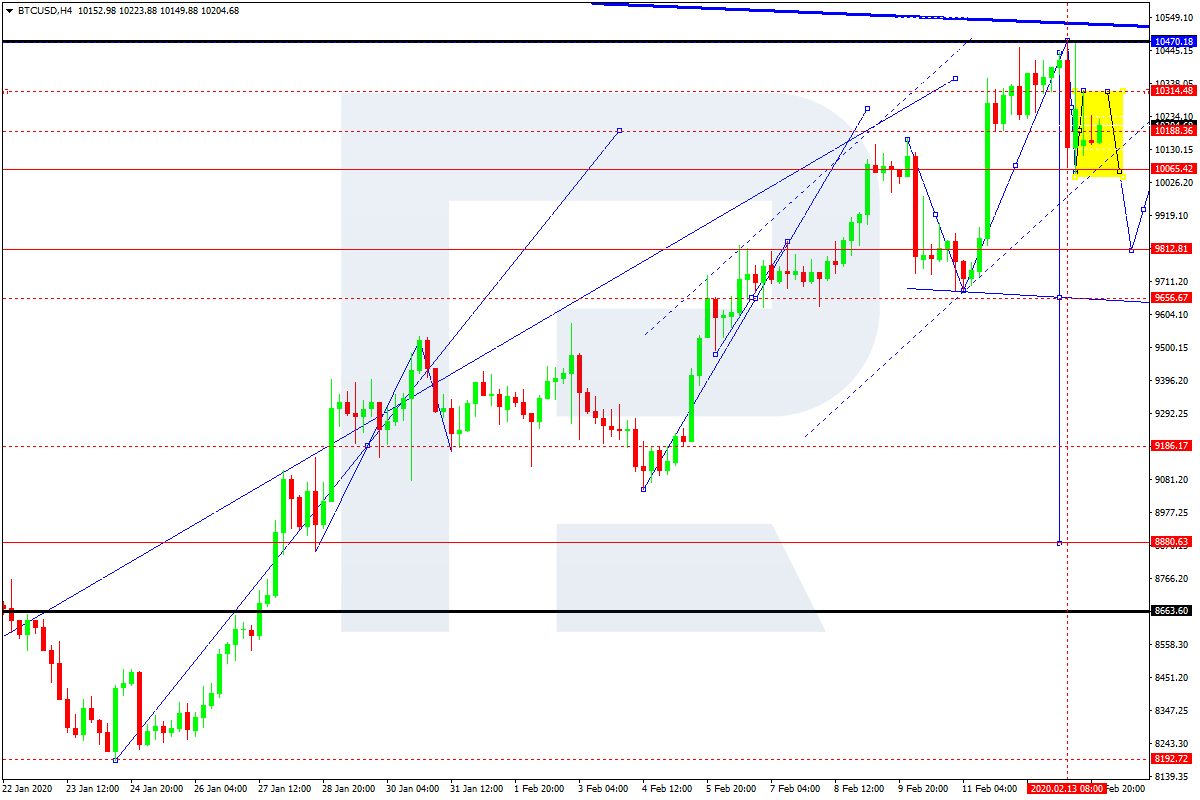
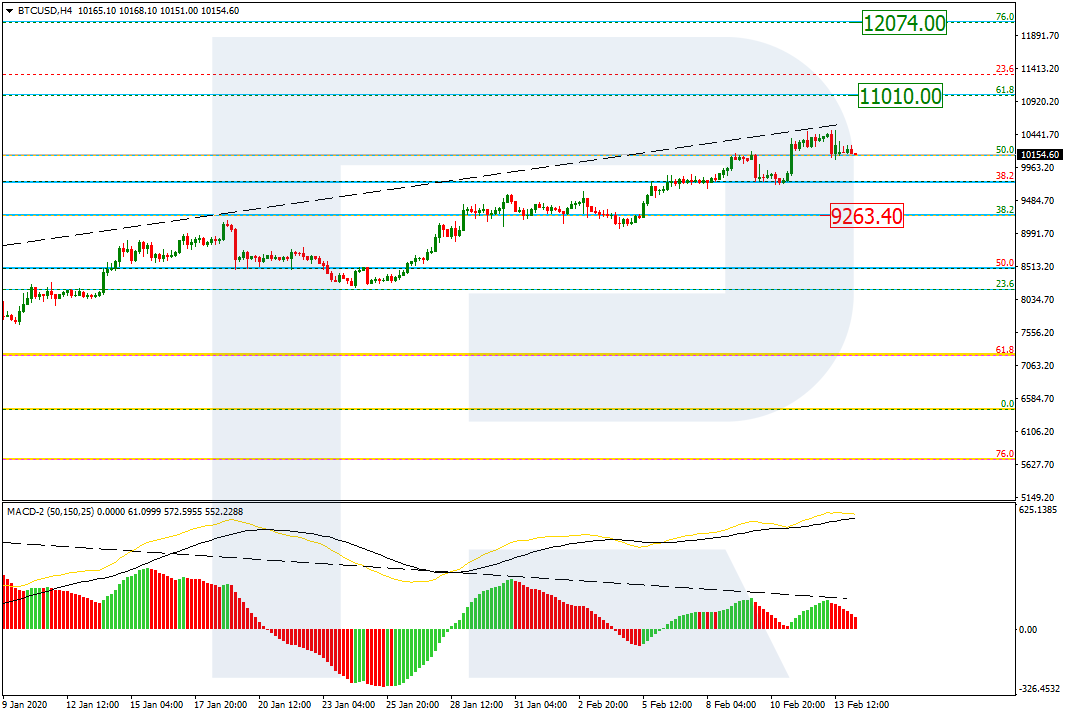
BTCUSD, “Bitcoin vs US Dollar”
After finishing the descending impulse towards 10052.00, BTCUSD has completed the correction at 10300.00, thus forming a new consolidation range. According to the main scenario, the pair may break the range to the downside and resume falling with the short-term target at 9800.00.
Attention! Forecasts presented in this section only reflect the author’s private opinion and should not be considered as guidance for trading. RoboForex LP bears no responsibility for trading results based on trading recommendations described in these analytical reviews.
The H4 chart shows a steady rising tendency. After BTCUSD had reached 50.0% fibo, there was a divergence on MACD, which made the pair resume falling. The support is at 38.2% fibo (9263.40). after completing the correction, the instrument may start a new rising impulse towards 61.8% and 76.0% fibo at 11010.00 and 12074.00 respectively.
The H1 chart shows a new decline after the divergence. The downside targets are 23.6%, 38.2%, and 50.0% fibo at 9965.90, 9632.60, and 9361.00 respectively. The resistance is the high at 10505.60.
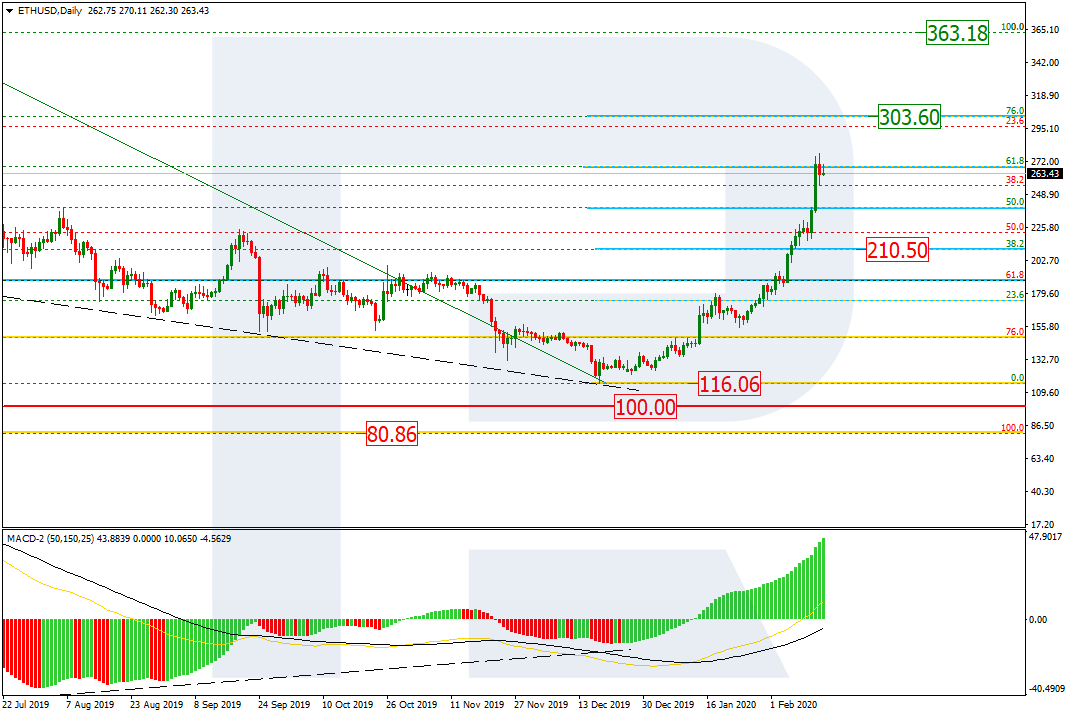
ETHUSD, “Ethereum vs. US Dollar”
As we can see in the daily chart, ETHUSD is moving inside the uptrend, which has already reached 61.8% fibo. The next upside target may be 76.0% fibo at 303.60. right now, there are no signals for a pullback, but it may be forced by a quick descending impulse and a new rising impulse after that. The support is 38.2% fibo at 210.50.
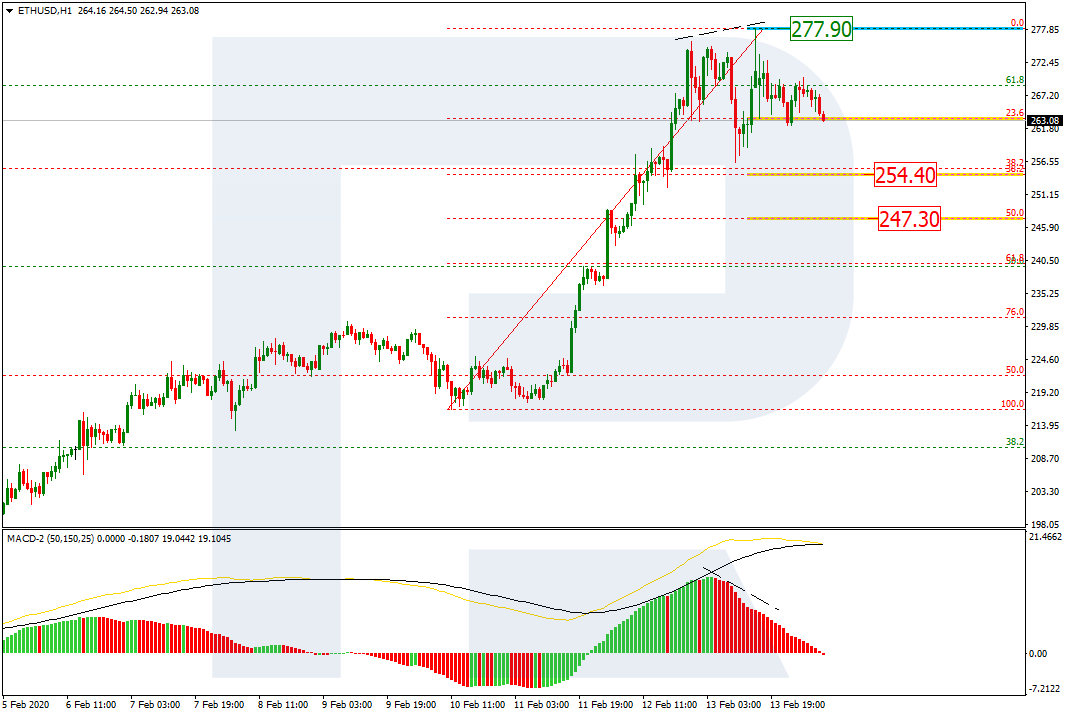
The H1 chart shows a new descending pullback after the divergence. The pair has already reached 23.6% fibo and may later continue falling towards 38.2% and 50.0% fibo at 254.40 and 247.30 respectively. the resistance is the high at 277.90.
Attention! Forecasts presented in this section only reflect the author’s private opinion and should not be considered as guidance for trading. RoboForex LP bears no responsibility for trading results based on trading recommendations described in these analytical reviews.
The US dollar strengthened slightly against a basket of major currencies. Yesterday, the dollar index (#DX) closed in the red zone (+0.04%). At the same time, the demand for greenback is still high. Quite optimistic data on the US economy were published yesterday. Thus, the core consumer price index rose by 0.2% in January, which met the forecasts. Initial jobless claims fell to 205K instead of 210K. Experts believe that the economic impact of the Chinese coronavirus epidemic on the United States will be less significant than on European countries, as Europe has strong trade ties with Asian markets, in particular with China. The single currency has updated two-year lows against the US dollar.
The British pound has been growing. Investors were surprised by the news that the UK Chancellor of the Exchequer Sajid Javid resigned. The new UK Chancellor will be the Chief Secretary of the Treasury, Rishi Sunak.
The “black gold” prices are rising. Currently, futures for the WTI crude oil are testing the $52.10 mark per barrel.
Market Indicators
Yesterday, there was the bearish sentiment in the US stock market: #SPY (-0.11%), #DIA (-0.30%), #QQQ (-0.13%).
The 10-year US government bonds yield is consolidating. At the moment, the indicator is at the level of 1.59-1.60%.
The EUR/USD currency pair continues to show a steady downtrend. The trading instrument has updated its two-year lows. EUR remains under pressure amid weak economic releases, as well as fears about the impact of the epidemic in China. At the moment EUR/USD quotes are consolidating. Local support and resistance levels are at 1.08250 and 1.08650, respectively. We recommend opening positions from these markers.
The Economic News Feed for 14.02.2020:
– GDP Report (EU) – 12:00 (GMT+2:00);
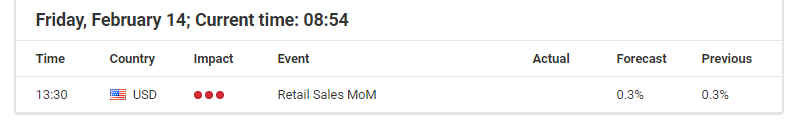
– Retail Sales Report (US) – 15:30 (GMT+2:00);
The indicators signal the sellers’ strength: the price has fixed below 50 MA and 100 MA.
The MACD histogram is in the negative zone, which indicates a bearish sentiment.
The Stochastic Oscillator is in the neutral zone, the %K line has crossed the %D line. There are no signals at the moment.
Trading recommendations
Support levels: 1.08250, 1.08000
Resistance levels: 1.08650, 1.09000, 1.09400
If the price fixes below 1.08250, expect further decline toward 1.08000-1.07700.
Alternatively, the quotes could grow toward 1.09000-1.09200.
The GBP/USD currency pair
Technical indicators of the currency pair:
Prev Open: 1.29597
Open: 1.30422
% chg. over the last day: +0.65
Day’s range: 1.30368 – 1.30555
52 wk range: 1.1959 – 1.3516
GBP/USD quotes have moved up. Yesterday, GBP added more than 80 points in the price against USD. The trading instrument has updated the local highs. At the moment GBP/USD currency pair is consolidating. The key range is 1.30100-1.30650. The technical patterb signals the further recovery of GBP/USD quotes. We expect important economic reports from the USA. Positions should be opened from key levels.
The news background on the UK economy is calm.
The indicators point to the strength of buyers: the price has fixed above 50 MA and 100 MA.
MACD histogram is in the positive zone, but below the signal line, which gives a weak signal to buy GBP/USD.
The Stochastic Oscillator is located in the neutral zone, the %K line crossed the %D line. There are no signals at the moment.
Trading recommendations
Support levels: 1.30100, 1.29850, 1.29400
Resistance levels: 1.30650, 1.31000, 1.31400
If the price fixes above 1.30650, expect further growth toward 1.31000-1.31400.
Alternatively, the quotes could descend toward 1.29700-1.29500.
The USD/CAD currency pair
Technical indicators of the currency pair:
Prev Open: 1.32516
Open: 1.32665
% chg. over the last day: +0.10
Day’s range: 1.32541 – 1.32690
52 wk range: 1.2949 – 1.3566
The USD/CAD currency pair is moving sideways. There is no defined trend. The investors are waiting for additional drivers. The trading instrument tests local support and resistance levels at 1.32400 and 1.32700, respectively. USD/CAD quotes can decline further. Today we recommend paying attention to the economic releases from the USA, as well as the dynamics of oil prices. Positions should be opened from key levels.
The publication of important statistical data from Canada is not planned.
Indicators do not give accurate signals: the price has crossed 50 MA.
MACD histogram is near the 0 mark.
The Stochastic Oscillator is located in the neutral zone, the %K line has crossed the %D line. There are no signals at the moment.
Trading recommendations
Support levels: 1.32400, 1.32200, 1.31900
Resistance levels: 1.32700, 1.33000, 1.33250
If the price fixes below 1.32400, expect further correction toward 1.32000.
Alternatively, the quotes could grow toward 1.32900-1.33100.
The USD/JPY currency pair
Technical indicators of the currency pair:
Prev Open: 110.071
Open: 109.813
% chg. over the last day: -0.28
Day’s range: 109.730 – 109.912
52 wk range: 104.45 – 113.53
USD/JPY currency pair continues to trade in a flat. The technical pattern is ambiguous. The trading instrument tests the local supply and demand zones at 109.550-109.700 and 110.000-110.150, respectively. Investors are still concerned about the further spread of coronavirus from China, which supports the demand for safe haven currencies. Today the focus is on the US economy statistics. We recommend opening positions from key levels.
The news background on the Japanese economy is calm.
Indicators do not give an accurate signal: 50 MA crossed 100 MA.
MACD histogram is near the 0 mark. No signals at the moment.
The Stochastic Oscillator is in the neutral zone, the %K line has crossed the %D line. There are no signals at the moment.
Trading recommendations
Support levels: 109.700, 109.550, 109.300
Resistance levels: 110.150, 110.400
If the price fixes below 109.700, consider selling USD/JPY, the price will be moving toward 109.400-109.200.
Alternatively, the quotes could grow toward 110.250-110.400.
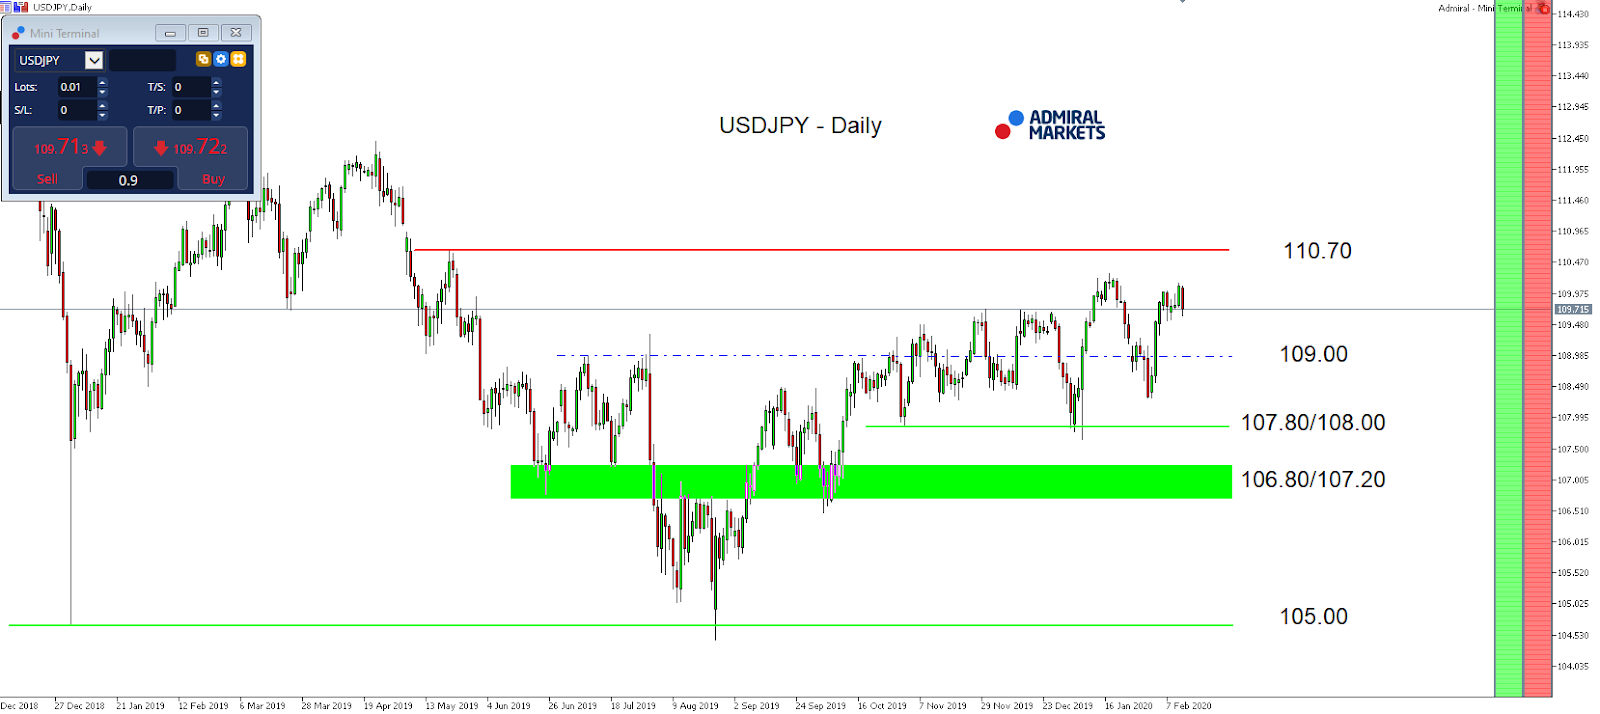
As we approach the weekly close, forex traders around the globe will certainly keep an eye on today’s US Retail Sales numbers at 1330 GMT.
Particularly interesting will the data set be for the USD/JPY, which has shown some interesting developments over the last days.
Not only were the US yields unable to profit from solid US economic data last week, but the subdued reaction to Fed chairman Powell’s neutral (and thus in our opinion, USD-bullish) comments at his semi-annual testimony does not bode well for the USD/JPY.
Certainly, the USD/JPY went for another stint up to 110 the last days, mainly driven by rising risk appetite among market participants, particularly in Equity markets, thus driving the Carry trade funding currency JPY lower.
But the fact that the comments from Powell fell on deaf ears among market participants who still expect, with a likelihood of around 80%, the Fed to cut rates at least once by 25 basis points in 2020 (according to the Fed Watch Tool and as of last Thursday), means: if US Retail Sales disappoint today, a sharper drop lower and bounce against 110.00 in the USD/JPY seems likely.
On the other hand, even a better than expected print should be carefully reviewed, any push above 110.00 in the USD/JPY may be short-lived with the USD/JPY finding a stronger zone of resistance around 110.30/70:
Source: Admiral Markets MT5 with MT5-SE Add-on USD/JPY Daily chart (between December 4, 2018, to February 13, 2020). Accessed: February 13, 2020, at 10:00pm GMT – Please note: Past performance is not a reliable indicator of future results, or future performance.
In 2015, the value of the USD/JPY increased by 0.5%, in 2016, it fell by 2.8%, in 2017, it fell by 3.6%, in 2018, it fell by 2.7%, in 2019, it fell by 0.85%, meaning that after five years, it was down by 9.2%.
Discover the world’s #1 multi-asset platform
Admiral Markets offers professional traders the ability to trade with a custom, upgraded version of MetaTrader 5, allowing you to experience trading at a significantly higher, more rewarding level. Experience benefits such as the addition of the Market Heat Map, so you can compare various currency pairs to see which ones might be lucrative investments, access real-time trading data, and so much more. Click the banner below to start your FREE download of MT5 Supreme Edition!
Disclaimer: The given data provides additional information regarding all analysis, estimates, prognosis, forecasts or other similar assessments or information (hereinafter “Analysis”) published on the website of Admiral Markets. Before making any investment decisions please pay close attention to the following:
This is a marketing communication. The analysis is published for informative purposes only and are in no way to be construed as investment advice or recommendation. It has not been prepared in accordance with legal requirements designed to promote the independence of investment research, and that it is not subject to any prohibition on dealing ahead of the dissemination of investment research.
Any investment decision is made by each client alone whereas Admiral Markets shall not be responsible for any loss or damage arising from any such decision, whether or not based on the Analysis.
Each of the Analysis is prepared by an independent analyst (Jens Klatt, Professional Trader and Analyst, hereinafter “Author”) based on the Author’s personal estimations.
To ensure that the interests of the clients would be protected and objectivity of the Analysis would not be damaged Admiral Markets has established relevant internal procedures for prevention and management of conflicts of interest.
Whilst every reasonable effort is taken to ensure that all sources of the Analysis are reliable and that all information is presented, as much as possible, in an understandable, timely, precise and complete manner, Admiral Markets does not guarantee the accuracy or completeness of any information contained within the Analysis. The presented figures refer that refer to any past performance is not a reliable indicator of future results.
The contents of the Analysis should not be construed as an express or implied promise, guarantee or implication by Admiral Markets that the client shall profit from the strategies therein or that losses in connection therewith may or shall be limited.
Any kind of previous or modeled performance of financial instruments indicated within the Publication should not be construed as an express or implied promise, guarantee or implication by Admiral Markets for any future performance. The value of the financial instrument may both increase and decrease and the preservation of the asset value is not guaranteed.
The projections included in the Analysis may be subject to additional fees, taxes or other charges, depending on the subject of the Publication. The price list applicable to the services provided by Admiral Markets is publicly available from the website of Admiral Markets.
Leveraged products (including contracts for difference) are speculative in nature and may result in losses or profit. Before you start trading, you should make sure that you understand all the risks.
Asian stocks and currencies are mixed, as market participants still grapple with the true extent of the Covid-19 outbreak, with the death toll in China edging towards 1,500. The optimism mid-week was quickly dashed upon news that the perceived slowdown in the virus’ spread proved to be a false dawn.
This week’s developments underscore the fact that this situation remains highly fluid, and uncertainties continue to abound, especially around whether the global economy could withstand Covid-19’s economic toll. Until investors are offered a meaningful dose of certainty, markets should see a broadly supportive environment for safe haven assets such as Gold and the Japanese Yen, while emerging-market assets are expected to remain handicapped by the downside risks stemming from Covid-19.
US, China trade tariffs thaw on Valentine’s Day
The lowering of trade tariffs between the US and China today as part of the phase-one trade deal is being overshadowed by the economic risks posed by Covid-19. While lowering barriers to trade may go some ways in alleviating the pressures on the global economy, the ensuing tailwind is expected to be offset over the near-term by the drop in demand due to the outbreak.
Amid the travel bans, manufacturing disruptions, and the pullback in discretionary spending, policymakers may be forced into rolling out more stimulus measures to support their respective economies. The theme of global trade tensions will likely only return to the forefront of the market’s collective consciousness once the coronavirus outbreak begins to show sustained signs of stabilising.
US retail sales could tip Dollar index further into overbought domain
The Dollar index (DXY) has climbed past the 99 line and is trading around its highest levels since October. Dollar bulls are hoping for a positive surprise in the January US retail sales data, which is expected to show at 0.3 percent advance, in order to push DXY higher.
However, with the Dollar index now tipping over into overbought territory, the upward momentum may peter out in the near-term. Still, from a fundamental perspective, the Dollar should be able to retain most of its recent gains, considering the market uncertainties over Covid-19’s economic toll, as well as the US economy’s resilience relative to its developed peers.
Disclaimer: The content in this article comprises personal opinions and should not be construed as containing personal and/or other investment advice and/or an offer of and/or solicitation for any transactions in financial instruments and/or a guarantee and/or prediction of future performance. ForexTime (FXTM), its affiliates, agents, directors, officers or employees do not guarantee the accuracy, validity, timeliness or completeness, of any information or data made available and assume no liability as to any loss arising from any investment based on the same.
China has a monopoly on one of the most strategic metals on the planet, and Washington is anxious to change that.
Global dominance at this point in the game means control of the rare earths elements that form the backbone of existing technology and the future of technology, and while everyone is busy playing at war with oil and gas, Beijing is busy sitting on a monopoly of our most precious strategic metals.
There are 16 metals in total that form the world’s strategically critical rare-earth elements–and China controls the supply of every single one because it controls 96% of production.
One of these crucial metals is Cesium.
It’s worth up to twice the price of gold, ounce for ounce, there are only three producing mines in the world, and all of them are controlled by China.
The only question in this game now is whether there is any chance for North America to get its hands-on new cesium of its own to get out from under a Chinese monopoly.
But while there are only three cesium mines in the world, the potential is in new supply. Of five cesium occurrences in Canada’s Ontario province, a small-cap Canadian explorer called Power Metals owns 100% of three of them (West Joe, Tot Lake and Marko).
The company discovered the pegmatites at West Joe Dyke in August 2018, intersecting high-grade cesium mineralization in six drill holes when it was targeting lithium instead.
So, the focus now is not on what has been lost to China, but the promise of new North American critical cesium.
Exactly How Strategic Is Cesium?
Cesium is extremely rare globally. In May 2018, the United States Department of the Interior included lithium, cesium and tantalum on its list of Critical Minerals.
The supreme technological war of global dominance can’t be won without these metals, so whoever controls them has the upper hand.
Cesium is described by the German Institute for Strategic Metals (ISE) as “the most electropositive of all stable elements in the periodic table”, and the heaviest of the stable metals. Cesium is “extremely pyrophoric, ignites spontaneously when in contact with air, and explodes violently in water or ice at any temperature above -116 ° C”.
Laboratories use cesium compounds for strategic organic chemistry, including in x-ray radiation for cancer treatments.
The list of commercial and industrial applications is long and varied, from catalyst promoters, glass amplifiers and photoelectric cell components, to crystals in scintillation counters, and getters in vacuum tubes.
Much cesium demand also comes from the oil and gas industry, which uses cesium formate brines in drilling fluids to prevent blow-outs in high-temperature, over-pressurized wells.
In terms of world dominance, the “cesium standard” is the key. This is the standard by which the accurate commercially available atomic clocks measure time, and it’s vital for the data transmission infrastructure of mobile networks, GPS and the internet.
That means it has serious defense applications as well, including in infrared detectors, optics, night vision goggles and much, much more.
At high purity levels, using the 2018 price for 99.98% pure cesium metal, it’s worth about $79 per gram–twice the price of a gram of gold, according to renowned geologist Mickey Fulp. Most uses required 98% pure cesium, which was set at about $39 for 25 grams in 2018. Otherwise, it’s hard to get a world market price on cesium because there is no trading of this strategic metal.
But imagine China being able to starve manufacturers of something like cesium, which would seriously disrupt U.S. industry and hinder the development of critical military equipment. That’s exactly why this rare metal was left off Washington’s tariff lists in the trade war back-and-forth.
But Dr. Julie Selway, a key geologist for the Ontario Geological Survey during the tantalum boom of the early 2000s, and now VP of exploration for Power Metals, says the three properties the company is drilling are hoped to have similar finds as the strategically important Sinclair mine in Australia.
“They are shipping their resource, which they say is higher than 10% cesium-oxide, and ours have some that are between 12% and 14% of cesium-oxide,” Selway–one of the world’s most renowned experts on pegmatites–told Oilprice.com.
China has dominated rare-earths since the 1990s with power in this sector that rivals OPEC for oil–even if it doesn’t make the headlines like oil and gas does.
In 2010, China cut back on exports, triggering major price spikes all over the world because of the critical nature of these metals to the tech industry.
That woke Washington from its slumber, but only slightly.
Beijing’s next move, according to the Wall Street Journal, was to manipulate the market so that rare earth elements (RREs) were cheaper in China than outside the country. What this did was prompt some major manufacturers and tech industries to set up shop in China, where they could get supplies at a lower cost.
In the entire world, there are only three pegmatite mines that can produce cesium: one is the Tanco mine in Manitoba, the second is the Bitika mine in Zimbabwe, and the third is the Sinclair mine in Australia.
Where does China fit into this picture? It controls them all, beyond its own borders, with few players like Power Metals and its three-play Cesium venue which could challenge that total control.
Washington’s emergence from its cesium slumber, however, was short-lived.
According to Fulp, speaking to Kitco, a United States company essentially sold off its control of cesium to Sinomine Resources of China last summer–even after the U.S. placing the metal on the critical list. Prior to this June 2019 deal, cesium production was largely controlled by Boston-based Cabot Corporation, which owned the Tanco mine in Manitoba, but which also has operations in China. This mine was shut down in 2015, with demand met from stockpiles.
Now, Tanco and Bitiki are no longer producing, but Sinomine Resources Group holds all the cesium ore stockpiles.
What that means is that this playing field isn’t just of strategic proportions–but it’s locked up.
The only company in the cesium supply chain right now is Chinese, and one of the only companies on the radar for potential commercial cesium supplies in North America is Canadian junior Power Metals, which is hoping to prove that it’s sitting on the world’s fourth minable deposit of the critical metal.
That’s why, finally, in December 2019, the United States and Canada agreed on a strategy to reduce the need for rare-earth metals mined or controlled by China.
Other companies shaking up China’s rare-earth dominance:
Teck Resources (NYSE:TECK, TSX:TECK)
Teck could be one of the best-diversified miners out there, with a broad portfolio of Copper, Zinc, Energy, Gold, Silver and Molybdenum assets. Its free cash flow and a lower volatility outlook for base metals in combination with a potential trade war breakthrough could send the stock higher in H2 of this year.
Teck’s share price stabilized last year and many investment banks now see the stock as undervalued. Low prices for Canadian crude and disappointing base metals prices weighed on Q4 earnings.
Despite its struggles, however, Teck Resources recently received a favorable investment rating from Fitch and Moody’s, and will likely benefit from its upgraded score. “Having investment grade ratings is very important to us and confirms the strong financial position of the company,” said Don Lindsay, President and CEO. “We are very pleased to receive this second credit rating upgrade.”
Turquoise Hill Resources (NYSE:TRQ ,TSX:TRQ)
Turquoise is a mid-cap Canadian mineral exploration and development company headquartered in Vancouver, British Columbia. Its focus is on the Pacific Rim where it is in the process of developing several large mines.
The company mines a diversified set of metals/minerals including Coal, Gold, Copper, Molybdenum, Silver, Rhenium, Uranium, Lead and Zinc. One of the fortes of Turquoise hill is its good relationship with mining giant Rio Tinto.
Turquoise has seen its share price languish last year, and the successful development of its world-class Oyu Tolgoi project in Mongolia is of utmost important to the future of this miner.
Pretium Resources (NYSE:PVG, TSX:PVG)
This impressive Canadian company is engaged in the acquisition, exploration and development of precious metal resource properties in the Americas. Pretium has an impressive portfolio and if you can catch the stock while the price is right, there could be huge opportunity for upside. Additionally, construction and engineering activities at its top location continue to advance, and commercial production is targeted for this year.
With Pretium’s variety of assets, this mining giant is a key figure in Canada’s resource realm. Investors know a good thing when they see it, and have definitely taken note of this company’s ambitious and forward-looking drive.
Magna International (NYSE:MGA, TSX:MG)
Based in Aurora, Ontario, Magna is a global automotive supplier is gutsy and innovative–and definitely tuned to the obvious future–clean transportation. A great catalyst is its development of a combo electric/hydrogen vehicle–a fuel cell range-extended EV (FCREEV). It’s not going to produce them (for now, at least) but plans to use the model to show off its engineering and design prowess and produce elements of the electric drivetrain and contract manufacturing. It’s insightful, forward-thinking and smart value/low cost for shareholders.
Agnico Eagle Mines Ltd (NYSE:AEM, TSX:AEM)
Canadian based gold producer, Agnico Eagle Mines is an especially noteworthy company for investors. Why? Between 1991-2010, the company paid out dividends every year. With operations in Quebec, Mexico, and Finland, the company also is taking place in exploration activities in Europe, Latin America, and the United States.
While Agnico primarily focuses on gold, it made this list because it’s a prime example of sustainability and environmental consciousness, and that means everything in a world rapidly shifting away from traditional mining.
**IMPORTANT! BY READING OUR CONTENT YOU EXPLICITLY AGREE TO THE FOLLOWING. PLEASE READ CAREFULLY**
Forward-Looking Statements
This news release contains forward-looking information which is subject to a variety of risks and uncertainties and other factors that could cause actual events or results to differ from those projected in the forward-looking statements. Forward looking statements in this release include that prices for cesium will retain value in future as currently expected; that PWM can fulfill all its obligations to maintain its properties; that PWM’s property can successfully mine commercial quantities of cesium; that the three properties the company is drilling are hoped to have similar finds as the strategically important Sinclair mine in Australia; that occurrences and indications of a commercially sized deposit become reality; that high grades found in samples are indicative of a high grade deposit; and that PWM will be able to carry out its business plans. These forward-looking statements are subject to a variety of risks and uncertainties and other factors that could cause actual events or results to differ materially from those projected in the forward-looking information. Risks that could change or prevent these statements from coming to fruition include that aspects or all of the properties’ development may not be successful, mining of the cesium may not be cost effective, the price of cesium may not stay high and it may never be profitable to mine cesium; PWM may not raise sufficient funds to carry out its plans, changing costs for mining and processing; increased capital costs; the timing and content of upcoming work programs; geological interpretations and technological results based on current data that may change with more detailed information or testing; potential process methods and mineral recoveries assumptions based on limited test work with further test work may not be viable; competitors may offer cheaper cesium; more production of Cesium could reduce its price; alternatives could be found for cesium; the availability of labour, equipment and markets for the products produced; and despite the current expected viability of its projects, that the minerals cannot be economically mined on its properties, or that the required permits to build and operate the envisaged mines cannot be obtained. The forward-looking information contained herein is given as of the date hereof and the Company assumes no responsibility to update or revise such information to reflect new events or circumstances, except as required by law.
DISCLAIMERS
ADVERTISEMENT. This communication is not a recommendation to buy or sell securities. Oilprice.com, Advanced Media Solutions Ltd, and their owners, managers, employees, and assigns (collectively “the Company”) may in the future be paid by PWM to disseminate future communications if this communication proves effective. In this case the Company has not been paid for this article. But the potential for future compensation is a major conflict with our ability to be unbiased, more specifically:
This communication is for entertainment purposes only. Never invest purely based on our communication. We have not been compensated by PWM but may in the future be compensated to conduct investor awareness advertising and marketing for TSXV: PWM.V; OTC:PWRMF. Therefore, this communication should be viewed as a commercial advertisement only. We have not investigated the background of the company. Frequently companies profiled in our alerts experience a large increase in volume and share price during the course of investor awareness marketing, which often end as soon as the investor awareness marketing ceases. The information in our communications and on our website has not been independently verified and is not guaranteed to be correct.
SHARE OWNERSHIP. The owner of Oilprice.com owns shares of this featured company and therefore has an additional incentive to see the featured company’s stock perform well. The owner of Oilprice.com will not notify the market when it decides to buy more or sell shares of this issuer in the market. The owner of Oilprice.com will be buying and selling shares of this issuer for its own profit. This is why we stress that you conduct extensive due diligence as well as seek the advice of your financial advisor or a registered broker-dealer before investing in any securities.
NOT AN INVESTMENT ADVISOR. The Company is not registered or licensed by any governing body in any jurisdiction to give investing advice or provide investment recommendation. ALWAYS DO YOUR OWN RESEARCH and consult with a licensed investment professional before making an investment. This communication should not be used as a basis for making any investment.
RISK OF INVESTING. Investing is inherently risky. Don’t trade with money you can’t afford to lose. This is neither a solicitation nor an offer to Buy/Sell securities. No representation is being made that any account will or is likely to achieve profits similar to those discussed.
US stock market rally paused on Thursday against the background of an increase in China’s coronavirus infection cases as new methodology was applied. The S&P 500 lost 0.2% to 3373.94. The Dow Jones industrial average slid 0.4% to 29423.3. Nasdaq composite index slipped 0.1% to 9711.97. The dollar strengthening slowed as January consumer prices increase slowed to 0.1% over month from 0.2% while the number of people applying for first time jobless benefits rose by 2,000 to 205,000 last week: live dollar index data show the ICE US Dollar index, a measure of the dollar’s strength against a basket of six rival currencies, rose 0.1% to 99.09 and is higher currently. Futures on stock indexes point to lower openings today.
FTSE 100 led European indexes retreat
European stocks puled back on Thursday. EUR/USD continued sliding while the GBP/USD climbed higher yesterday with the dynamics for both pairs holding currently. The Stoxx Europe 600 index lost 0.15% led by energy shares. Germany’s DAX 30 slipped 0.03% to 13745.43. France’s CAC 40 slid 0.2% while UK’s FTSE 100 fell 1.1% to 7452.03 as British Prime Minister Boris Johnson appointed new finance minister.
Nikkei fell while other Asian indexes gain
Asian stock indices are mixed today. Nikkei ended down 0.6% at 238687.59 with yen advance against dollar intact. Markets in China are rising despite reports 121 more people had died and there were 5,090 new COVID-19 confirmed cases: the Shanghai Composite Index is up 0.4% while Hong Kong’s Hang Seng Index is 0.3% higher. Australia’s All Ordinaries Index recovered 0.4% despite resumed Australian dollar climbing against the greenback.
Brent futures prices Brent futures prices are extending gains today. Prices ended higher yesterday: April Brent crude rose 1% to $56.34 a barrel on Thursday.
Gold slips
Gold prices are retracing lower today. Prices rose yesterday: April gold added 0.5% to $1578.80 an ounce on Thursday.
Note: This overview has an informative and tutorial character and is published for free. All the data, included in the overview, are received from public sources, recognized as more or less reliable. Moreover, there is no guarantee that the indicated information is full and precise. Overviews are not updated. The whole information in each overview, including opinion, indicators, charts and anything else, is provided only for familiarization purposes and is not financial advice or а recommendation. The whole text and its any part, as well as the charts cannot be considered as an offer to make a deal with any asset. IFC Markets and its employees under any circumstances are not liable for any action taken by someone else during or after reading the overview.