The sell-off on global stock markets will ease as liquidity measures are rolled out – and some investors will make a fortune from the volatility – affirms the CEO of one of the world’s largest independent financial advisory organizations.
Nigel Green, the chief executive and founder of deVere Group, is speaking out after coronavirus fears triggered the largest one-day fall on many global indices – including the FTSE and the Dow Jones – since the “Black Monday” market crash in 1987.
Mr Green comments: “Global markets were thrown into turmoil Thursday as fear gripped investors over the jump in confirmed coronavirus cases and as governments around the world introduced measures to try and halt the spread, which contributed to the panic.
“All assets – even safe-haven ones such as gold and Treasuries – were being shed in order to shore up cash reserves to meet margin requirements.
“This was a temporary phenomenon.
“Whilst some volatility will remain as no-one can truly know where the bottom is due to the unpredictability of this public health crisis, the global sell-off will ease as central banks roll-out liquidity measures.”
This prediction was also made earlier in the week by the deVere CEO who noted: “Markets are looking for good reason to return to being bullish – which has been their default position for an unusually long time – and actions being taken by central banks could provide just that in days to come.”
He added: “We expect global stock markets to have recovered significantly before the year-end.”
On Friday Asia-Pacific markets staged sharp recoveries, European and U.S. ones are expected to follow suit.
Mr Green observes: “The coronavirus is an unprecedented public health crisis, with many tragic consequences that cannot and should not be underestimated or dismissed.
“It has spooked the markets to historic levels.
“Yet many investors will use the temporary volatility as important buying opportunities, with some set to make a fortune from the turbulence.
“Fluctuations can cause panic-selling and mispricing. Sought-after stocks can then become cheaper, meaning investors can top up their portfolios and/or take advantage of lower entry points. This all typically results in better returns.
“A sensible fund manager will assist investors to seek out the opportunities that turbulence creates and mitigate potential risks as and when they are presented.”
The deVere CEO concludes: “As ever in times of market volatility, many investors will be using the fall-out of the coronavirus outbreak as a chance to generate and build wealth.”
About:
deVere Group is one of the world’s largest independent advisors of specialist global financial solutions to international, local mass affluent, and high-net-worth clients. It has a network of more than 70 offices across the world, over 80,000 clients and $12bn under advisement.
On Thursday, March 12, trading on the euro ended up down. After ECB President Christine Lagarde’s speech, the EURUSD pair fell to 1.1056. Following the meeting, the ECB decided to leave the refinancing rate unchanged at 0.0%. The deposit rate remained at the previous level of -0.5%. The regulator increased its plans for the purchase of government bonds by 120bn. EUR (by the end of the year – not monthly). The press release confirmed that the QE program will work for as long as necessary, and will end shortly before the next rate increase
By the close of the day, the price recovered to 1.1226. Growth was accompanied by a collapse in stock indices. The S&P index fell by almost 10%. During the American session, stock indices looked to gain a boost from the US Federal Reserve announcement, which allocated $1.5 trillion USD to increase liquidity in the financial markets. None of these measures did enough to calm investors.
Today’s news (GMT+3):
15:30 USA: Import Price Index (YoY) (Feb).
17:00 USA: Michigan Consumer Sentiment Index (Mar).
21:00 USA: Baker Hughes US Oil Rig Count.
Current situation:
The EURUSD pair had been floating around within the zone located above the line D4. The collapse of stock indices helped the single currency to make its way out of this zone. At the time of writing, the euro is worth 1.1205.
The coronavirus pandemic continues to gather pace. A significant increase in the number of cases in developed countries serves only to provoke governments to take reactive measures to limit the movement of people and to close various public institutions. Mortality from the total number of infected increased to 3.6%. In Italy, the figure stands at 6.6%. Investors fear a serious recession in the global economy.
Asian stocks traded in the red zone today. Futures on the S&P500 and DJIA rose by 3.9%. It can be assumed that the peak of the “panic” has passed, and European indices will open with growth. On the back of Christine Lagarde’s speech, we can expect the pair to fall back to 1.1120, around the 90th degree.
Vir Biotechnology shares traded higher after the company reported that it has entered into a research collaboration with the National Institutes of Health Vaccine Research Center on antibodies against coronaviruses including SARS-CoV-2.
Clinical-stage immunology company Vir Biotechnology Inc. (VIR:NASDAQ), which is focused on treating and preventing serious infectious diseases, today announced that it has entered into “a research collaboration agreement with the National Institutes of Health (NIH) and the National Institute of Allergy and Infectious Diseases (NIAID), Vaccine Research Center (VRC) to advance characterization and development of human monoclonal antibodies (mAbs) against coronaviruses, including SARS-CoV-2, the virus that causes the disease COVID-19.”
The company advised that the joint project is scheduled to commence this week and is structured “to augment ongoing efforts by both parties to identify antibodies that can be used to prevent or treat infection with existing and emerging viruses and help inform the development of vaccines.”
The agreement entails that Vir Biotech will work together with the NIAID to identify and optimize combinations of antibodies against coronaviruses, including SARS-CoV-2, SARS and MERS. The joint research project will also investigate other antibodies that may be effective across additional coronavirus strains. The company and the NIAID have agreed to exchange antibodies and materials for testing and are also planning to implement in vivo animal studies in order to analyze immune responses.
The company’s Chief Scientific Officer Herbert “Skip” Virgin, M.D., Ph.D., commented, “This collaboration expands Vir’s efforts to characterize and develop antibody therapies against coronaviruses by allowing us to access the VRC’s significant and broad research experience with coronaviruses, which is complementary to ours…This is one of multiple approaches we are taking to rapidly identify and test potential prophylactics and therapeutics for COVID-19 and we expect it to allow us to accelerate finding solutions to this urgent public health need.”
The firm reported that “it has identified a number of monoclonal antibodies that bind to SARS-CoV-2 that were isolated from individuals who had survived SARS infections.” The company is now investigating if its current antibodies, or additional antibodies from COVID-19 survivors, can be effective as treatment or prophylaxis against SARS-CoV-2.
The company explained that its antibody platform “is used to identify rare antibodies from survivors that have the potential to treat and prevent rapidly evolving and/or previously untreatable pathogens via direct pathogen neutralization and immune system stimulation.” The firm indicated that its platform has already been used to identify and develop antibodies for pathogens including Ebola, hepatitis B virus, influenza A and malaria.
Vir Biotechnology is headquartered in San Francisco and describes itself as “a clinical-stage immunology company focused on treating and preventing serious infectious diseases.” The company noted that its technology platforms serve to stimulate and enhance the immune system and identify and observe natural immune processes.
Vir Biotechnology has a market capitalization of around $3.3 billion with approximately 109.7 million shares outstanding. VIR shares opened more than 12 % higher today at $33.55 (+$3.64, +12.17%) over yesterday’s $29.11 closing price. The stock has traded today between $30.52 and $40.99 per share and is currently trading at $34.89 (+$4.98, +16.65%).
Disclosure: 1) Stephen Hytha compiled this article for Streetwise Reports LLC and provides services to Streetwise Reports as an independent contractor. He or members of his household own securities of the following companies mentioned in the article: None. He or members of his household are paid by the following companies mentioned in this article: None. 2) The following companies mentioned in this article are billboard sponsors of Streetwise Reports: None. Click here for important disclosures about sponsor fees. 3) Comments and opinions expressed are those of the specific experts and not of Streetwise Reports or its officers. The information provided above is for informational purposes only and is not a recommendation to buy or sell any security. 4) The article does not constitute investment advice. Each reader is encouraged to consult with his or her individual financial professional and any action a reader takes as a result of information presented here is his or her own responsibility. By opening this page, each reader accepts and agrees to Streetwise Reports’ terms of use and full legal disclaimer. This article is not a solicitation for investment. Streetwise Reports does not render general or specific investment advice and the information on Streetwise Reports should not be considered a recommendation to buy or sell any security. Streetwise Reports does not endorse or recommend the business, products, services or securities of any company mentioned on Streetwise Reports. 5) From time to time, Streetwise Reports LLC and its directors, officers, employees or members of their families, as well as persons interviewed for articles and interviews on the site, may have a long or short position in securities mentioned. Directors, officers, employees or members of their immediate families are prohibited from making purchases and/or sales of those securities in the open market or otherwise from the time of the interview or the decision to write an article until three business days after the publication of the interview or article. The foregoing prohibition does not apply to articles that in substance only restate previously published company releases. 6) This article does not constitute medical advice. Officers, employees and contributors to Streetwise Reports are not licensed medical professionals. Readers should always contact their healthcare professionals for medical advice.
US stock market plunge accelerated on Thursday despite President Trump’s promise of financial relief “for workers who are ill, quarantined or caring for others due to coronavirus,” emergency low-interest loans from Small Business Administration to affected businesses, and deferred tax payments for certain individuals and companies for three months. The S&P 500 lost 9.5% to 2480.64. The Dow Jones industrial average sank 9.98% to 21200.62. Nasdaq composite index tumbled 9.4% to 7201.80. Both SP 500 and Nasdaq Composite joined the Dow in bear market territory, defined as a decline of at least 20% from their recent record intraday maximums. The dollar strengthening accelerated as the Federal Reserve offered some $1.5 trillion worth of funding and announced about purchases of US Treasury notes and bonds to increase its balance sheet: live dollar index data show the ICE US Dollar index, a measure of the dollar’s strength against a basket of six rival currencies, rose 0.9% to 97.50 but is lower currently. Futures on stock indexes are up.
European indexes’ plunge deepened after ECB decision of no rate cut
European stocks drop accelerated on Thursday after European Central Bank decided not to cut interest rates. ECB’s announcement of new measures to support bank lending, including expansion of its quantitative easing (QE) program by 120 billion euros ($135.28 billion), wasn’t sufficient to stem selling pressure . Both EUR/USD and GBP/USD accelerated their declines yesterday with both pairs higher currently. The Stoxx Europe 600 index lost 11% led by travel and leisure shares. Germany’s DAX 30 slumped 12.24% to 9161.13. France’s CAC 40 tumbled 12.28% while UK’s FTSE 100 fell 10.87% to 5237.48.
Australia’s All Ordinaries Index rebounds while Asian indexes fall
Asian stock indices are mostly lower today after steepest losses on Wall Street since the Black Monday crash of 1987. Nikkei ended down 6.1% at 17431.05 despite continued yen decline against the dollar. Markets in China are falling: the Shanghai Composite Index is down 1.2% and Hong Kong’s Hang Seng Index is 1.2% lower. Australia’s All Ordinaries Index however rebounded 4.4% with Australian dollar little changed against the greenback.
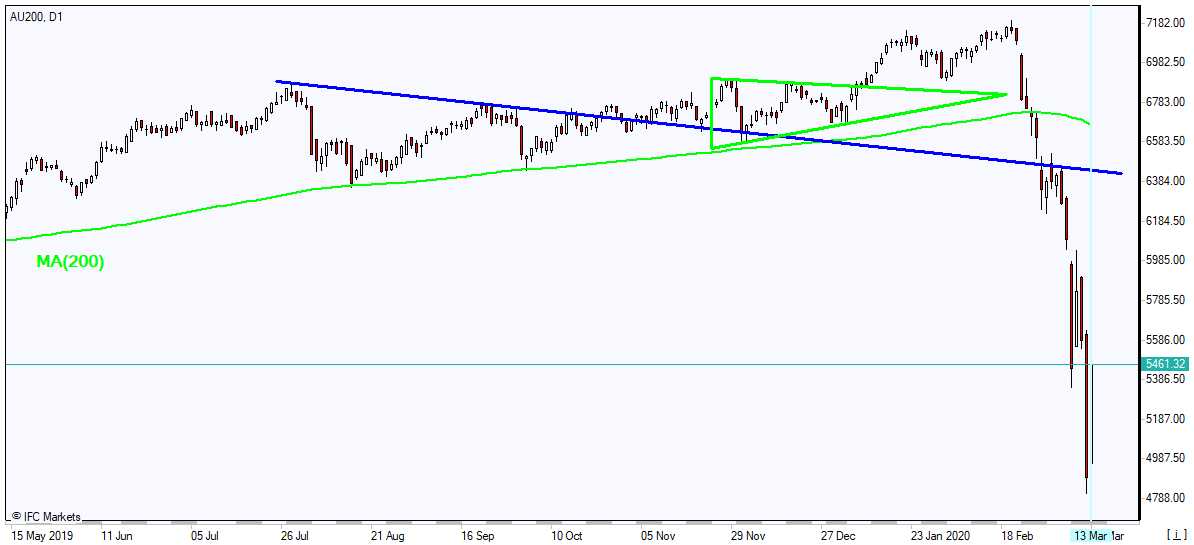
Note: This overview has an informative and tutorial character and is published for free. All the data, included in the overview, are received from public sources, recognized as more or less reliable. Moreover, there is no guarantee that the indicated information is full and precise. Overviews are not updated. The whole information in each overview, including opinion, indicators, charts and anything else, is provided only for familiarization purposes and is not financial advice or а recommendation. The whole text and its any part, as well as the charts cannot be considered as an offer to make a deal with any asset. IFC Markets and its employees under any circumstances are not liable for any action taken by someone else during or after reading the overview.
Things just got even worse for financial markets as rising panic surrounding the coronavirus pandemic pummeled equities across the globe.
Asian shares continued the global slump on Friday plunging deeper into the abyss, while European markets posted their worst one-day drop in history yesterday. Overnight, the sell-off on Wall Street was so severe that the Dow and S&P 500 experienced their biggest one-day declines since 1987, after triggering circuit breakers for only the second time in one week.
Markets are highly volatile with Trump’s travel ban on 26 European countries clearly adding more fuel to the fire, now global stocks are ablaze. It seems the ongoing uncertainty from the coronavirus outbreak is set to continue burning the outlook for the global economy.
What is more alarming is that these gut-wrenching declines across stocks have come despite emergency action by the Federal Reserve , Bank of England and European Central Bank to rescue markets. There seems to be little faith over the effectiveness of monetary policy shielding the economy from the impact of the coronavirus, with fiscal measures seen as a better alternative in stabilising conditions.
Markets currently remain in panic mode with risk aversion the dominant theme. Equities across the globe are likely to remain severely depressed amid the darkening mood, with safe-haven assets like the Dollar and Japanese Yen, the best destinations for safety.
Dollar regains mojo as investors rush to safety
King Dollar stood tall against every single G10 currency on Thursday, as investors sprinted towards the world’s most liquid currency amid the market meltdown.
A sense of disappointment with the government’s response to the rising infections in the United States is fostering caution and unease. The jump in risk aversion is boosting appetite for the Dollar, despite expectations around the Fed announcing more interest rate cuts , with around 100bp now priced in over the next week.
Focusing on the technical picture, the Dollar Index has staged an incredible rebound on the daily charts with prices trading around 97.50, as of writing. A solid daily close above this level could re-open the doors back towards 98.30. However, should 97.50 prove to be reliable resistance, prices could sink back towards 97.00.
Commodity spotlight – Gold
Not even safe-haven Gold has escaped the brutal market sell-off, as the pandemic panic sweeping global equities forced investors to cover margin calls.
The precious metal has depreciated over 5% this week despite the market chaos, which puts it on track for its biggest weekly loss since 2011. An appreciating Dollar also added to the pain with prices trading around $1591, as of writing.
Focusing on the technical picture, prices are bearish with sustained weakness below $1600 opening the doors towards $1555. If bulls are able to secure a weekly close above $1600, the next key level of interest will be found at $1620.
Disclaimer: The content in this article comprises personal opinions and should not be construed as containing personal and/or other investment advice and/or an offer of and/or solicitation for any transactions in financial instruments and/or a guarantee and/or prediction of future performance. ForexTime (FXTM), its affiliates, agents, directors, officers or employees do not guarantee the accuracy, validity, timeliness or completeness, of any information or data made available and assume no liability as to any loss arising from any investment based on the same.
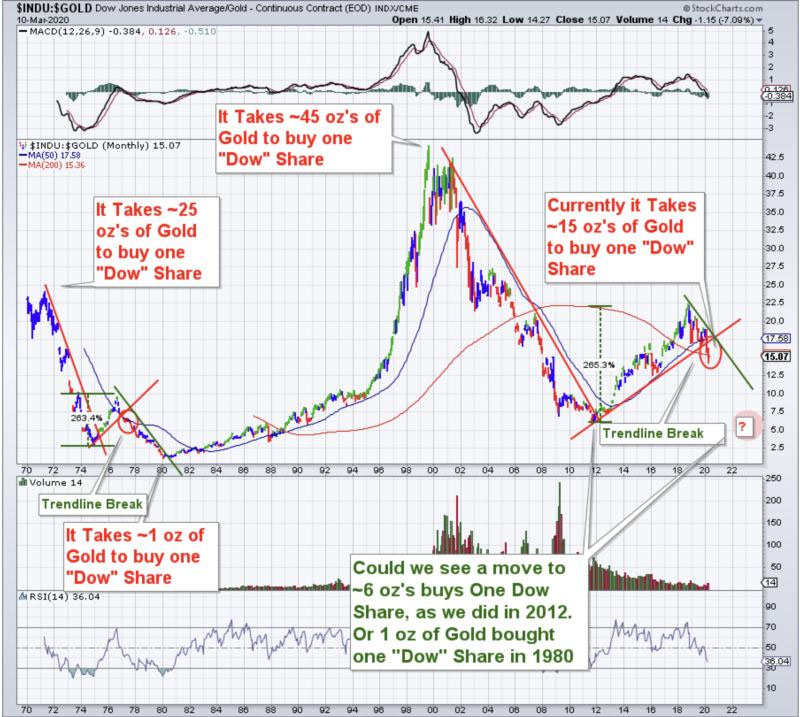
Technical analyst John Newell charts the Dow-Gold ratio and speculates on where it could be heading.
The Dow/Gold ratio broke a trend-line in past few weeks that could be signaling that gold could be trending higher against the Dow Jones Industrial Index in the next 18 months to two years.
An example might be a ratio of 10 or the Dow at 20,000 and gold at $2,000 (a new all-time high in U.S. dollars) equals 10.
Conversely, if the Dow went to 30,000 and gold went to $3,000, the ratio would equal 10. This is not a prediction but an observation.
What I found interesting was in the mid-1970s gold corrected from ~$200 to ~$100 and the Dow/Gold ratio went up ~260%, as it did again from the 2012 lows into mid-2019 but over a longer period.
John Newell is a portfolio manager at Fieldhouse Capital Management and president and CEO of Golden Sky Minerals Corp. He has 38 years of experience in the investment industry acting as an officer, director, portfolio manager and investment advisor with some of the largest investment firms in Canada. Newell is a specialist in precious metal equities and related commodities and is a registered portfolio manager in Canada (advising representative).
Disclosures: 1) John Newell: I, or members of my immediate household or family, own shares of the following companies mentioned in this article: None. I personally am, or members of my immediate household or family are, paid by the following companies mentioned in this article: None. My company currently has a financial relationship with the following companies mentioned in this article: None. I determined which companies would be included in this article based on my research and understanding of the sector. Additional disclosures/disclaimer below. 2) The following companies mentioned in this article are sponsors of Streetwise Reports: None. Click here for important disclosures about sponsor fees. 3) Comments and opinions expressed are those of the specific experts and not of Streetwise Reports or its officers. The author is wholly responsible for the validity of the statements. The author was not paid by Streetwise Reports for this article. Streetwise Reports was not paid by the author to publish or syndicate this article. The information provided above is for informational purposes only and is not a recommendation to buy or sell any security. Streetwise Reports requires contributing authors to disclose any shareholdings in, or economic relationships with, companies that they write about. Streetwise Reports relies upon the authors to accurately provide this information and Streetwise Reports has no means of verifying its accuracy. 4) The article does not constitute investment advice. Each reader is encouraged to consult with his or her individual financial professional and any action a reader takes as a result of information presented here is his or her own responsibility. By opening this page, each reader accepts and agrees to Streetwise Reports’ terms of use and full legal disclaimer. This article is not a solicitation for investment. Streetwise Reports does not render general or specific investment advice and the information on Streetwise Reports should not be considered a recommendation to buy or sell any security. Streetwise Reports does not endorse or recommend the business, products, services or securities of any company mentioned on Streetwise Reports. 5) From time to time, Streetwise Reports LLC and its directors, officers, employees or members of their families, as well as persons interviewed for articles and interviews on the site, may have a long or short position in securities mentioned. Directors, officers, employees or members of their immediate families are prohibited from making purchases and/or sales of those securities in the open market or otherwise from the time of the interview or the decision to write an article until three business days after the publication of the interview or article. The foregoing prohibition does not apply to articles that in substance only restate previously published company releases.
Additional Disclosures and Disclaimer from John Newell, Fieldhouse Capital Management
Legal Notice / Disclaimer:
This document is not and should not be construed as an offer to sell or the solicitation of an offer to purchase or subscribe for any investment.
John Newell has based this document on information obtained from sources he believes to be reliable, but which has not been independently verified.
John Newell makes no guarantee, representation or warranty and accepts no responsibility or liability as to its accuracy or completeness. Expressions of opinion are those of John Newell only and are subject to change without notice. John Newell assumes no warranty, liability or guarantee for the current relevance, correctness or completeness of any information provided within this Report and will not be held liable for the consequence of reliance upon any opinion or statement contained herein or any omission.
Furthermore, I, John Newell, assume no liability for any direct or indirect loss or damage or for lost profit, which you may incur because of the use and existence of the information provided within this Report.
It should not be assumed that the methods, techniques, or indicators presented in these pages will be profitable or that they will not result in losses. Past results are not necessarily indicative of future results. Examples presented on these pages are for educational purposes only. These set-ups are not solicitations of any order to buy or sell. The authors, the publisher, and all affiliates assume no responsibility for your trading results. There is a high degree of risk in trading. Hypothetical and historical performance results have many inherent limitations, some of which are described below. No representation is being made that any account will or is likely to achieve profits or losses similar to those shown. In fact, there are frequently sharp differences between hypothetical and historical performance results and the actual results subsequently achieved by any trading program. One of the limitations of hypothetical and historical performance results is that they are generally presented with the benefit of hindsight. In addition, hypothetical and historical trading may not present the financial risks and returns for future trading. For example, the ability to withstand losses or to adhere to a particular trading program in spite of trading losses are material points which can also adversely affect trading results. There are numerous other factors related to the markets in general or to the implementation of any specific trading program which cannot be fully accounted for in the preparation of hypothetical performance results and all which can adversely affect actual trading results. Disclaimer: This Publication is protected by Canadian and International Copyright laws. All rights reserved. No license is granted to the user except for the user’s personal use. No part of this publication or its contents may be copied, downloaded, stored in a retrieval system, further transmitted, or otherwise reproduced, stored, disseminated, transferred, or used, in any form or by any means without prior written permission. This publication is proprietary. Neither the information, nor any opinion expressed constitutes a solicitation for the purchase of an investment program.
By TheTechnicalTraders – Has the selloff ended? When will it end? What will the bottom look like and am I at risk of taking further losses? What should I do?
Do you want to take a guess at how many of our friends and family members are calling us over the past week or so asking these questions? Personally, I get bombarded with dozens of emails every day from friends and other family members asking “where’s the bottom? What should I do?”.
This post is going to help you understand the structure of the markets and what is really happening. Price always attempts to seek out new price highs or new price lows. In this case, we are seeking out new price lows with a downside price rotation. Price structure, which is normally discussed in Elliot Wave structures is the process of setting up new higher high or lower low waves as price rotates in a defined wave structure. Keep in mind the broader wave structure that is currently unfolding.
Over the past 16+ months, we’ve suggested that the price rotation in 2018 was a Wave 4 downside price rotation of a Wave C upside price structure. If our analysis is correct, the last rally we just experienced (ending near February 1, 2020) was the end of a Wave 5 upside price move that completed the Wave C upside price structure. This would indicate a very real possibility that the current downside price trend is a Wave 4 downside price move.
Be sure to opt-in to our free market trend signals newsletter before closing this page so you don’t miss our next special report!
For readers that are not familiar with the Elliot Wave process/structure, each major wave (1 through 5 or A through C) can consist of various types of minor wave structures (as you can see from the middle chart in the example above. The major wave 1 could consist of a 5 wave minor wave structure (as shown). The major wave 2 could consist of a 3 wave minor wave structure (as shown) or even a downside 5 wave structure.
Going even further, each of these minor wave structure could consist of even smaller price wave structures. These types of price rotations often populate in 1, 3, 5, 7, 9, 13 and 21 wave structures. Unlocking the major wave count and minor wave count can help us unlock swing trading and day trading opportunities.
So, to put into context what we are attempting to convey to you is that we believe the peak in early February 2020 was the end of a major wave 3 and the start of a major wave 4 (to the downside). Because the upside price wave 3 originated after the 2009-10 price bottom, we believe true support in the markets is likely the midpoint of the 2018 price rotation range or near the low price levels of 2018. These price levels represent a very clear support level and low price target level that continues to follow the price structure rules of Fibonacci and Elliot Wave. If the 2018 lows are breached and the markets continue to push lower, then we fall back to the 2016 price lows and midpoint level.
Weekly YM Chart – DOW JONES
This Weekly YM chart highlights the two lower MAGENTA lines that we believe represent clear price support for the Dow Jones (24,000 & 21,450). At this point, the YM has already moved below the 24,000 level and closed trading on Monday, March 9, near 23,900. Although this price level has breached the 24,000 level, we do not consider “support” a hard level (like concrete). It is like water in many cases and it matters what price does when it reaches this level. If price finds support near this level, it will begin to bottom out and potentially trade sideways before attempting to move higher. If not, the price may stall near this 24,000 level before breaking down to the 21,450 level (or lower).
We do believe the INDU/YM will put in a bottom before the ES and NQ do. Thus, we believe support will be found in the INDU/YM well before support is found in the other major US stock market indexes.
SPY Weekly Chart – S&P 500
This SPY Weekly chart highlights the same setup with the two MAGENTA lines we’ve drawn. The first level of support for SPY is $261~$262. We believe this midpoint of 2018 high to the low trading range will offer a fairly strong support level for the SPY to attempt to set up a price bottom. Below that, the $234 level (the lower range of the 2018 trading year) would provide very clear support for the SPY.
The same type of price theory and expectations are at play on this chart as with the YM chart above. The YM has already reached our first level of support, yet the SPY is still $12 away from this first support level. This would suggest the YM may begin to set up some type of price support while the SPY may continue to trail a bit lower over time.
If this first level of support does not hold, then we would be looking for the 2018 price low levels (near $234) to become the next target for support. Ultimately, the price must either continue to attempt to break previous low price points as it attempts to establish “new price lows” or, at some point, it will fail to break past lows and that is where it will find support. The midpoint, often called the “belt line” (a Japanese Candlestick term) is used by technicians for two reasons: first, it represents 50% of a defined price range and, second, Japanese Candlestick theory teaches us the BeltLine is “the center of control” or price. Once price breaks this level, then further trending may continue.
NQ Weekly Chart – NASDAQ
Lastly, this NQ Weekly chart with the three MAGENTA lines drawn on it. The top line is the 2018 price peak level. The middle line is the midpoint of the 2018 trading range. The lower line is the bottom of the 2018 trading range.
The NQ has been the high-flying sector in the US stock market for many months. You can see the massive rally that took place near the end of 2019 pushing the NQ up to nearly 10,000 before the recent correction. Compared to the YM and SPY charts, it is easy to see the NQ rallied much stronger than the others. This is why we believe the downside price move in the NQ could also be far greater in scope than the YM or SPY.
If the NQ falls to our midpoint level (near 6795), the NQ must call another -1100 points to reach this level. Whereas the YM has already reached this critical price level and the SPY is only about $12 away from that same level. Therefore, the NQ, in our opinion, could continue to trend broadly lower throughout Q1 and possibly into Q2 before finding any real support.
The low price range of 2018 puts final support for the NQ near 5,832. From current levels, if price falls to this support level, it would total an additional -2066 point decline (-26.11%). It would also represent a massive -40% selloff from the peak set in February 2020 (near 9763).
Where’s the bottom? What’s next? Our advice would be NOT to chase this selloff and NOT to attempt to bottom pick this move. We believe the Covid-19 virus event will last well past April/May 2020 and we believe both Q1 and Q2 results will be far below expectations. Therefore, we don’t believe any real bottom will setup before May, June or July of 2020 – after Q2 earnings are announced and contingent on the virus event subsiding and earnings starting to recover. Otherwise, we could be “searching for a bottom” for quite a while yet.
Still, massive price rotations are taking place in the major markets and various sectors. If you are a skilled trader and are able to manage risk properly, you should be able to identify multiple opportunities over the next 90+ days for incredible trades. We know we certainly are finding them.
As a technical analysis and trader since 1997, I have been through a few bull/bear market cycles. I believe I have a good pulse on the market and timing key turning points for short-term swing traders.
Visit my ETF Wealth Building Newsletter and if you like what I offer, and ride my coattails as I navigate these financial markets and build wealth while others lose nearly everything they own during the next financial crisis.
By CentralBankNews.info Mongolia’s central bank lowered its policy rate 100 basis points to 10.0 percent, saying the increased uncertainties in connection with the spread of the coronavirus had increased the risk that the economic slowdown will be worsened due to weaker external demand, lower commodity prices and sluggish external and domestic economic activities. It is the first change in rates by the Bank of Mongolia (BOM) since it raised its rate at an unscheduled policy meeting in November 2018 to bolster the exchange rate of the tughrik. In addition to the rate cut, the first since March 2018, BOM lowered the reserve requirement on banks domestic currency liabilities by 200 basis points to 8.5 percent and changed the interest rate corridor to plus/minus 1 percentage point from the policy rate. In a statement from March 11, the central bank said its monetary policy committee had decided to take the comprehensive policy measures to ease the financing costs for banks, to support financial intermediation, and to stimulate economic growth in light of the current outlook. It added the impact of the coronavirus, or Covid-19, on the country’s economy would depend on the scale of the virus’ spread, the length of containment, and policy measures to prevent the spread. “The decision is aimed at ensuring economic and financial stability while keeping the inflation rate around the target rate,” BOM said. While exports from Mongolia might decline, BOM said a continued decline in imports and a sharp fall in the price of oil would reduce any depreciation pressure on the exchange rate. Inflation in Mongolia rose to 5.6 percent in January from 5.2 percent in December while its economy has slowed in recent quarters after growing 7.2 percent in 2018 on the back of better macroeconomic and fiscal policy, favorable commodity prices and a recovery in investment. In the fourth quarter of last year, economic growth slowed to an annual 5.1 percent from 6.3 percent in the third quarter.
Occidental Petroleum’s two recent moves are reviewed and commented on in a Raymond James report.
In a March 10 research note, Raymond James analyst Pavel Molchanov reported that Occidental Petroleum Corp. (OXY:NYSE) cut both its capex and dividend in response to the recent “meltdown in the oil market.” Molchanov added, “We are emphatically not fans of the latter move, although we acknowledge that at [a] sub-$40 West Texas Intermediate [oil price], it would have been hard to avoid.”
Molchanov discussed the steps Occidental took. For one, the Texas-based company reduced its 2020 capital spend by 30% to $3.53.7 billion from $5.25.4 billion. “Our sense is that Occidental’s new level of spending will result in a low to mid single-digit production decline over the next 12 months,” he wrote.
Two, the oil & gas exploration and production company cut its quarterly dividend by 86%, to $0.11 per share from $0.79. The new yield is 3.2%. “This is genuinely frustrating and disappointing to see, especially after the repeatedly, consistently stated commitment to the dividend from management, including after the Anadarko deal and, in fact, just last week,” commented Molchanov.
Company management did say its dividend is only sustainable above a $40 WTI oil price. “However, we had thought, wrongly, that the company would hold out for a price improvement, at least for several quarters, before taking such a step,” Molchanov noted.
Taking both changes into account, Raymond James estimated “all-in 2020 cash flow neutrality at $36 WTI,” meaning Occidental Petroleum can fund the new capex and dividend amounts without borrowing. Additionally, “we expect costs are certain to decrease, for the company and indeed the entire industry. Thus, we believe the point of neutrality has room to come down further.”
Raymond James has a Strong Buy rating but no target price on Occidental Petroleum. The stock is trading now at around $11.80 per share.
Disclosure: 1) Doresa Banning compiled this article for Streetwise Reports LLC and provides services to Streetwise Reports as an independent contractor. She or members of her household own securities of the following companies mentioned in the article: None. She or members of her household are paid by the following companies mentioned in this article: None. 2) The following companies mentioned in this article are billboard sponsors of Streetwise Reports: None. Click here for important disclosures about sponsor fees. 3) Comments and opinions expressed are those of the specific experts and not of Streetwise Reports or its officers. The information provided above is for informational purposes only and is not a recommendation to buy or sell any security. 4) The article does not constitute investment advice. Each reader is encouraged to consult with his or her individual financial professional and any action a reader takes as a result of information presented here is his or her own responsibility. By opening this page, each reader accepts and agrees to Streetwise Reports’ terms of use and full legal disclaimer. This article is not a solicitation for investment. Streetwise Reports does not render general or specific investment advice and the information on Streetwise Reports should not be considered a recommendation to buy or sell any security. Streetwise Reports does not endorse or recommend the business, products, services or securities of any company mentioned on Streetwise Reports. 5) From time to time, Streetwise Reports LLC and its directors, officers, employees or members of their families, as well as persons interviewed for articles and interviews on the site, may have a long or short position in securities mentioned. Directors, officers, employees or members of their immediate families are prohibited from making purchases and/or sales of those securities in the open market or otherwise from the time of the interview or the decision to write an article until three business days after the publication of the interview or article. The foregoing prohibition does not apply to articles that in substance only restate previously published company releases.
Disclosures from Raymond James, Occidental Petroleum Corp., March 10, 2020
ANALYST INFORMATION
Analysts Holdings and Compensation: Equity analysts and their staffs at Raymond James are compensated based on a salary and bonus system. Several factors enter into the bonus determination, including quality and performance of research product, the analyst’s success in rating stocks versus an industry index, and support effectiveness to trading and the retail and institutional sales forces. Other factors may include but are not limited to: overall ratings from internal (other than investment banking) or external parties and the general productivity and revenue generated in covered stocks.
The analyst Pavel Molchanov, primarily responsible for the preparation of this research report, attests to the following: (1) that the views and opinions rendered in this research report reflect his or her personal views about the subject companies or issuers and (2) that no part of the research analyst’s compensation was, is, or will be directly or indirectly related to the specific recommendations or views in this research report. In addition, said analyst(s) has not received compensation from any subject company in the last 12 months.
RAYMOND JAMES RELATIONSHIP DISCLOSURES Certain affiliates of the RJ Group expect to receive or intend to seek compensation for investment banking services from all companies under research coverage within the next three months.
Raymond James & Associates, Inc. makes a market in the shares of Occidental Petroleum Corporation.
Additional Risk and Disclosure information, as well as more information on the Raymond James rating system and suitability categories, is available here.
Franco-Nevada’s Q4/19 and full-year 2019 numbers and 2020 guidance are reviewed in a CIBC report.
In a March 9 research note, CIBC analyst Cosmos Chiu reported that Franco-Nevada Corp. (FNV:TSX; FNV:NYSE) significantly beat earnings estimates in Q4/19 due to record sales of gold equivalent ounces and revenues.
Thus, CIBC increased its target price on the gold royalty streaming company to CA$162 per share from CA$157. In comparison, the stock, rated Outperformer by the bank, is trading now at around CA$140.45 per share.
Chiu highlighted that Franco-Nevada’s strong Q4/19 included record sales of 153,396 gold equivalent (Au eq) ounces. This led to full-year 2019 sales of 516,438 ounces. The total was well above the high end of guidance of 465,000500,000 ounces (465550 Koz) and CIBC’s forecast of 498 Koz. The high producer was the Cobre Panama mine in Panama, from which Franco Nevada received 43,554 ounces Au eq, also above guidance of 2040 Koz.
With the strong sales, Franco Nevada posted total 2019 revenue of $844 million, surpassing consensus’ estimate of $814 million, Chiu pointed out. Full-year oil and gas revenue of $115.9 million contributed about 14% to the total revenue. This was driven by oil and gas revenue in Q4/19 of $30 million, which exceeded projections.
Q4/19 adjusted earnings per share (EPS), cash flow per share (CFPS) and EBITDA all exceeded consensus and CIBC’s estimate. Adjusted EPS was $0.59 versus $0.49, CFPS was $0.98 and EBITDA was $202 million.
At the end of 2019, Franco-Nevada had $132 million in cash and $1 billion-plus in available liquidity.
Chiu also noted that Franco-Nevada’s 2020 production guidance of 550580 ounces of Au eq is solid and reflects a more than a 10% year-over-year (YOY) increase. A primary contributor will be Cobre Panama, in its first full year of operation. CIBC forecasts 555 Koz and consensus estimates 560 Koz. Guidance is expected to be offset by a YOY oil and gas underperformance of about 25%, assuming a West Texas Intermediate oil price of $45 per barrel. 2020 oil and gas revenue is forecast at $8090 million.
By 2024, Franco Nevada aims to produce 580610 Koz Au eq versus CIBC’s projection of 570 Koz.
Disclosure: 1) Doresa Banning compiled this article for Streetwise Reports LLC and provides services to Streetwise Reports as an independent contractor. She or members of her household own securities of the following companies mentioned in the article: None. She or members of her household are paid by the following companies mentioned in this article: None. 2) The following companies mentioned in this article are billboard sponsors of Streetwise Reports: None. Click here for important disclosures about sponsor fees. 3) Comments and opinions expressed are those of the specific experts and not of Streetwise Reports or its officers. The information provided above is for informational purposes only and is not a recommendation to buy or sell any security. 4) The article does not constitute investment advice. Each reader is encouraged to consult with his or her individual financial professional and any action a reader takes as a result of information presented here is his or her own responsibility. By opening this page, each reader accepts and agrees to Streetwise Reports’ terms of use and full legal disclaimer. This article is not a solicitation for investment. Streetwise Reports does not render general or specific investment advice and the information on Streetwise Reports should not be considered a recommendation to buy or sell any security. Streetwise Reports does not endorse or recommend the business, products, services or securities of any company mentioned on Streetwise Reports. 5) From time to time, Streetwise Reports LLC and its directors, officers, employees or members of their families, as well as persons interviewed for articles and interviews on the site, may have a long or short position in securities mentioned. Directors, officers, employees or members of their immediate families are prohibited from making purchases and/or sales of those securities in the open market or otherwise from the time of the interview or the decision to write an article until three business days after the publication of the interview or article. The foregoing prohibition does not apply to articles that in substance only restate previously published company releases. As of the date of this article, officers and/or employees of Streetwise Reports LLC (including members of their household) own securities of Franco-Nevada, a company mentioned in this article.
Disclosures from CIBC, Franco-Nevada Corp., Earnings Update, March 9, 2020
Analyst Certification: Each CIBC World Markets Corp./Inc. research analyst named on the front page of this research report, or at the beginning of any subsection hereof, hereby certifies that (i) the recommendations and opinions expressed herein accurately reflect such research analyst’s personal views about the company and securities that are the subject of this report and all other companies and securities mentioned in this report that are covered by such research analyst and (ii) no part of the research analyst’s compensation was, is, or will be, directly or indirectly, related to the specific recommendations or views expressed by such research analyst in this report.
Potential Conflicts of Interest: Equity research analysts employed by CIBC World Markets Corp./Inc. are compensated from revenues generated by various CIBC World Markets Corp./Inc. businesses, including the CIBC World Markets Investment Banking Department. Research analysts do not receive compensation based upon revenues from specific investment banking transactions. CIBC World Markets Corp./Inc. generally prohibits any research analyst and any member of his or her household from executing trades in the securities of a company that such research analyst covers. Additionally, CIBC World Markets Corp./Inc. generally prohibits any research analyst from serving as an officer, director or advisory board member of a company that such analyst covers.
In addition to 1% ownership positions in covered companies that are required to be specifically disclosed in this report, CIBC World Markets Corp./Inc. may have a long position of less than 1% or a short position or deal as principal in the securities discussed herein, related securities or in options, futures or other derivative instruments based thereon.
Recipients of this report are advised that any or all of the foregoing arrangements, as well as more specific disclosures set forth below, may at times give rise to potential conflicts of interest.
Important Disclosure Footnotes for Franco-Nevada Corporation (FNV.TO)
2a These companies are clients for which a CIBC World Markets company has performed investment banking services in the past 12 months: Franco-Nevada Corporation 2e CIBC World Markets Inc. has received compensation for investment banking services from these companies in the past 12 months: Franco-Nevada Corporation 2g CIBC World Markets Inc. expects to receive or intends to seek compensation for investment banking services from these companies in the next 3 months: Franco-Nevada Corporation 7 CIBC World Markets Corp., CIBC World Markets Inc., and their affiliates, in the aggregate, beneficially own 1% or more of a class of equity securities issued by these companies: Franco-Nevada Corporation
For important disclosure footnotes for companies mentioned in this report that are covered by CIBC World Markets Inc., click here: Disclaimers & Disclosures.
 Current situation: