Investors know that the main U.S. stock indexes have tumbled very quickly.
On a historical basis, some may not realize just how quickly.
A March 23 Marketwatch headline referred to a “mind-bending stat”:
The S&P 500 has dropped 30% from peak to trough faster than any other time in history. The next three fastest were all nasty pullbacks during the Great Depression era. Yes, just 22 days for this stock market to get cut by a third.
This historically swift downturn has prompted a “buy the dip” mentality.
On March 23, a prominent founder of a financial firm told CNBC:
“I’m nibbling right now, for what it is worth.”
Other professional investors have also mentioned that they were doing a little nibbling of their own.
The sentiment expressed was that the market may have a little more downside to go, but that’s about it.
These professionals might turn out to be correct in their judgments of the market. Then again, just because stocks have fallen far and fast – doesn’t mean they can’t fall way farther.
As a historical lesson, let’s take you back 19 years, when our April 2001 Elliott Wave Financial Forecast showed this chart and said:
“If there were ever a testament to the importance of market timing, the NASDAQ over the last year is it. Anyone who bought into the euphoria at the all-time high or the bull trap highs of early September and late January, would have taken successive hits of 40%, 47% and 38%. You can bet that many people followed the “buy” advice in the media on every bounce, losing even more than the “hold-only” loss of 65% from top to bottom.”
Bear in mind, the NASDAQ continued to fall into October 2002, handing even deeper losses to investors who continued to buy on the way down.
Returning to 2020, only time will tell when the bear market has bottomed, if it hasn’t already done so.
Yet, one thing’s for sure even now: The Elliott wave model is offering its own clues about what’s next for the main stock indexes.
See for yourself – 100% free.
You see, Elliott Wave International has just made available our entire “Stocks” section of our monthly Elliott Wave Financial Forecast to Club EWI members. Joining Club EWI is also free.
Elliott Wave International has been guiding investors through bull and bear markets since 1979. From that long experience, EWI’s analysts know that at certain market junctures, they can help the most by giving everyone their latest analysis free.
This article was syndicated by Elliott Wave International and was originally published under the headline Stocks: Why “Buying the Dip” is Fraught with Danger. EWI is the world’s largest market forecasting firm. Its staff of full-time analysts led by Chartered Market Technician Robert Prechter provides 24-hour-a-day market analysis to institutional and private investors around the world.
– Our research team continues to dig into underlying patterns and set up in the global markets to assist skilled technical traders in understanding the current Covid-19 virus event and other key technical data. Recently, we’ve authored a number of detailed research articles that we believe helped prepare traders for the events of the past 30 to 90+ days. If you missed them, please take a moment to review some of our critical market research posts:
Today, we are writing about a pattern our research team is seeing in the Gold/Silver ratio which is correlated to the price movement of Gold. What does this mean and how can we profit from this setup? Let’s get started trying to explain this chart pattern/setup.
Gold:Silver Ratio Chart From a New Angle
This first chart highlights the pattern we have identified and how we believe a similar pattern is setting up again in the current market. The setup of the pattern is explained in the text below, but quickly scroll down and look at the first chart and the pink shaded areas “A” to get an idea of what we are talking about.
Prior to “A” Pattern Setup
_ After a moderate price decline in Gold (1996 through 2001), a bottom sets up as the price of Gold begins to base near support.
_ The Gold/Silver ratio (BLUE), falls throughout this pattern setup as both Gold and Silver prices decline somewhat in unison.
The Setup “A”
_ Gold prices begin to rally moderately while pushing the Gold/Silver ratio higher over an extended period of time (from 1999 to 2003: about 4 years).
_ The Gold/Silver ratio peaks and begins to decline in mid-2003 as the price of Gold continues to rally at a bit more accelerated rate.
_ Gold prices begin a parabolic upside price advance in early 2006 after the Gold/Silver ratio collapses about 18% to 20% from the peak level near 82.50.
We believe a similar type of pattern is setting up right now in the metals market and we believe both Gold and Silver will engage in a price advance over the next 10+ months that may be similar to the post-A set up in mid-2003. If you are familiar with what happened in the metals market at that time, Silver began to advance at a faster rate than the price of Gold advanced. This is what caused the Gold/Silver ratio to begin to collapse.
Before you continue, be sure to opt-in to our free market trend signals before closing this page, so you don’t miss our next special report!
Silver Monthly chart from 1993 to 2004
This Silver chart from 1993 to 2004 clearly shows how the price of Silver was reacting throughout the setup prior to “A” and after “A” in the chart (above). Silver began a moderate price advance in 1993 from a level near $3.50 and advanced to a level near $7.50 in 1998. Then, it began a downside price move to reach new lows in 2002. At that point, the markets changed. Gold and Silver began to advance almost in unison with Gold still advancing slightly more than Silver until early/mid-2003. Once Silver broke dramatically higher, in late 2003-04, the Gold/Silver ratio started breaking downward instead of upward. This is the pattern we are seeing in the metals market right now.
We believe the recent rotation in the metals market and the dramatic price divergence between Gold and Silver are setting up another similar type of pattern that could prompt both Silver and Gold to rally upward from current levels by at least 200%.
Current Silver Monthly chart
The extremely deep price retracement on this Monthly Silver chart (below) highlights what we believe is a deep washout low price rotation that is setting up the “disconnect” as we have tried to explain in the Gold/Silver ratio chart and historical Silver chart (above). Yes, Gold also moved dramatically lower over the past 2+ weeks illustrating the shock to the markets that took place as the Covid-19 virus event disrupted the US and global markets. But our researchers believe this dramatic washout low in Silver is setting up a much bigger pattern, longer-term than most people understand.
Recently, news that global precious metals suppliers have received a tremendous surge of orders for the physical stock over the past 2+ weeks (source: https://www.msn.com). In fact, many global suppliers and mints are simply “out of stock” at the moment. This surge in demand changes the dynamics of the market and how we look at the washout low in Silver.
If demand continues to surge, which we have no reason to doubt at this stage of the Covid-19 virus event, and Silver begins to rally as it did in 2002~2005, then the Gold/Silver ratio will begin to collapse just as it did in 2003~2007 (see the first chart – Post “A”). This means the demand for metals is skyrocketing and Silver has suddenly become a more “in demand” physical metal than Gold.
You want a reality check on how to trade gold, silver and the stock market in this type of market condition be sure to check this out.
Current Gold Weekly Chart
We believe the next phase of price action in Gold is a move above $1990 as demand for metals continues to surge. This would represent a 100% Fibonacci price expansion of the last price rally from the lows set in September 2018 (near $1168). It would also represent a rally from the current level of at least +22.50% in Gold. Subsequently, if Silver begins to rally at a greater rate than Gold over this same span of time, Silver could rally to levels above $22 representing a +53% price rally according to our Adaptive Fibonacci Price Modeling system (the CYAN target on the chart above).
Pay attention to the Gold/Silver ratio and the price of Silver compared to Gold over the next 30 to 60+ days. If our research is correct, the current low price of Silver will be a distant memory in less than 60 days and a tandem price advance in both Gold and Silver will propel the metals much higher. How much higher? From 2003 to the peak in 2011, Gold rallied 450% (from $350 to over $1900). Over that same span of time, Silver rallied 1024% (from $4.50 to just under $50).
If we are right about this pattern setup and the future opportunities it may present, we could see Silver trading above $160 per ounce within 4 to 7 years. Can you guess where Gold would likely be trading if Silver rallied 1000% from current levels? We already have our positions established and our targets setup. Don’t miss this next big move in the metals.
As a technical analysis and trader since 1997, I have been through a few bull/bear market cycles. I believe I have a good pulse on the market and timing key turning points for short-term swing traders.
Visit my ETF Trading Newsletter and if you like what I offer, and ride my coattails as I navigate these financial markets and build wealth while others lose nearly everything they own during the next financial crisis.
By CentralBankNews.info Colombia’s central bank cut its key interest rate for the first time in almost two years and launched new measures to boost liquidity to ease the financial burden on households and business during the outbreak of the coronavirus and ensure financial markets continue to function properly. The Central Bank of Colombia (CBC) cut its benchmark interest rate by 50 basis points to 3.75 percent, the first rate cut since April 2018. CBC’s board was unanimous in its policy decision, which it said would contribute to the future recovery of domestic demand once markets begin to function normally. “The country and the economy are going through an extraordinary and unprecedented situation,” CBC said, prioritizing an ample and timely provision of liquidity, both in pesos and U.S. dollars. In addition to earlier measures, the central bank on March 30 will auction up to $1 billion in U.S. dollars, with any amount not awarded to be auctioned on the next occasion until the quota is exhausted or until the remaining amount is $25 million. On the same day, March 30, CBC will conduct currency swaps of up to $400 million in which the central bank sells U.S. dollars for cash and buys them back in 60 days. Any amounts not awarded on the first day of the auction will also be auction on the next occasion until the quota is exhausted or the amount is less than $25 billion. These new measures will raise the balance of FX swaps to $800 million and currency forwards to $2 billion, CBC said. Colombia’s peso fell sharply on March 11 and 12 in response to the fall in crude oil prices and plunging stock markets worldwide, but has rebounded slightly since then. But today the peso again fell in response to the rate cut to 4,024.1 to the U.S. dollar to be down 18.4 percent since the start of this year. At an extraordinary board meeting on March 23, CBC decided to inject around $10 billion in permanent liquidity into the financial system through the purchase of private securities issued by credit institutions, with a remaining maturity of less than three years. The first auction took place on March 24. CBC also decided to buy up to $2 billion of treasury bonds, known as TES, during the rest of March and to continue carrying out auctions of private securities for $500 billion on days when there are no scheduled auctions by private parties.
By Jameel Ahmad, Global Head of Currency Strategy and Market Research at FXTM, ForexTime
The GBPUSD suffered a fall from its highest level in close to 10 days following the breaking news that both UK Prime Minister Boris Johnson and Health Secretary Matt Hancock tested positive for the coronavirus. The drop of close to 100 pips does have a question market over it on how long it will last, considering the persistent weakness that has transpired in the USD in recent days as well as the inevitability that world leaders are at the same risk of everyone to the virus.
Boris Johnson is set to remain in his position as Prime Minister and there is no imminent change in power as he works from home, therefore questions are valid on whether the GBP move lower is justified. Some could say it is actually a surprise given the density of the global virus breakout that more senior officials and world leaders have not been announced as testing positive.
At time of writing there is a risk that the bubble of optimism and feel-good factor across world stock markets in recent days will fade. The FTSE 100 is down more than 5% and the Dow Jones 4% during trading today.
Although central bank officials and governments can be commended for the support they are providing the global economy in its time of need, this does not mean these measures will defeat the issue at hand – a disease outbreak.
Should the number of world virus cases reach 1 million over the next couple of days, investors will just request more from officials in stimulus support and that isn’t realistic considering everything that has already been provided.
Disclaimer: The content in this article comprises personal opinions and should not be construed as containing personal and/or other investment advice and/or an offer of and/or solicitation for any transactions in financial instruments and/or a guarantee and/or prediction of future performance. ForexTime (FXTM), its affiliates, agents, directors, officers or employees do not guarantee the accuracy, validity, timeliness or completeness, of any information or data made available and assume no liability as to any loss arising from any investment based on the same.
What the heck are those mysterious “exchange for physicals,” the mechanisms by which contracts to buy gold on the New York Commodities Exchange are neither fulfilled by delivery on the Comex nor settled for cash there but transported for supposed delivery elsewhere?
The mechanism long has been incorporated by the Comex trading system but was described as an “emergency” procedure undertaken upon agreement by buyer and seller – except that the use of this “emergency” procedure has exploded in the last year, involving tens of thousands of contracts and, nominally, hundreds of tonnes of gold.
In one respect this is not so surprising, since there never has been much tonnage in Comex gold vaults, with nearly all Comex contracts settled for cash. But apparently physical demand over the last year has risen enough to cause sellers to need to source gold elsewhere.
The presumption is that the EFPs shift a seller’s delivery obligations off the Comex to bullion banks in London. But this raises another issue, since so many EFPs have been issued in the last year that if delivery really was being claimed for them, unallocated metal in London – metal available for sale, rather than metal being vaulted for exchange-traded funds and other institutions – would be wiped out. In January Bullion Star researcher Ronan Manly calculated that fewer than 1,200 tonnes of gold in London were really available for trade.
Indeed, sources in the London gold market say that few EFPs ever claim delivery. Rather, these sources say, EFPs are usually cash-settled in London with their claimants paid cash bonuses that are never reflected in the gold price, which would be much higher if the bonuses were reflected.
But as the tightness of gold supply in London increasingly has been recognized in recent months, EFP claimants are said to have been demanding larger bonuses against the risk that the gold will run out, making their EFPs worthless.
Despite the “physicals” in their name, the vast increase in their use suggests that most EFPs have not been resolved by any delivery of metal. So those using and sustaining the mechanism must have other purposes – like sustaining the increasingly creaky fractional-reserve gold banking system.
Whatever is happening with the EFPs, their enormous use in the last year is new and indicates some big change in the gold market, and it must be an especially sensitive change because Comex operator CME Group, the U.S. Commodity Futures Trading Commission, and the U.S. Office of the Comptroller of the Currency – nominal regulators of the gold market and its bullion banks – refuse to explain what it means.
The Money Metals News Service provides market news and crisp commentary for investors following the precious metals markets.
The yellow metal enjoyed a much better session this week as prices rallied firmly.
The gold market has now traded back up to 1631.67 (as of writing) from last week’s 1450.13 lows. Fuelling the recovery was the broader rebound across asset markets this week.
Equities and commodities prices have been firmly lifted on the back of the slew of central bank easing we have seen in response to the coronavirus outbreak.
With nearly all G10 central banks having announced easing, and the Fed announcing that it will now run unlimited QE, the markets have finally started to stabilize following weeks of heavy selling. Gold prices are now not too far off their yearly highs around the 1700 level following this week’s recovery.
Gold prices had seen a lot of selling due to the need for traders to fund margin calls on losing equities trades. With equities markets recovering here, however, gold prices have been able to regain upside.
Gold Prices Break Back Above Bullish Channel
The rally in gold prices this week has seen the market breaking back above the top of the bullish channel, encouraging the view that further upside is likely. For now, the 1700.000 remains the key upside marker and a break of this level would be a strong bullish signal.
To the downside, the main support is down at the 1381.74 level with the bull channel low coming in beneath that.
Silver
Silver prices have enjoyed a firm rally this week also. Price recovered from last week’s lows below the 12.0000 level to trade back up to above 14.4430 (as of writing).
With US industrial stocks rallying this week, silver prices have been lifted. News that restrictions on movement in the Hubei province in China (epicentre of the coronavirus) is also helping boost sentiment.
China has reported no new cases of the coronavirus for a week now, encouraging optimism among traders.
Silver Recovers Above Major Support Level
Having traded as low as 11.6700, silver prices have now recovered above the 13.6219 2015 lows and are challenging the 14.3722 level. If price can hold above this level, a further recovery higher will be on focus, with the 16.3505 level as the next main structural zone to watch.
The move into the lows saw bearish divergence on the RSI indicator. Price action-wise, this could prove to be a point of capitulation from which the market will start to reverse higher.
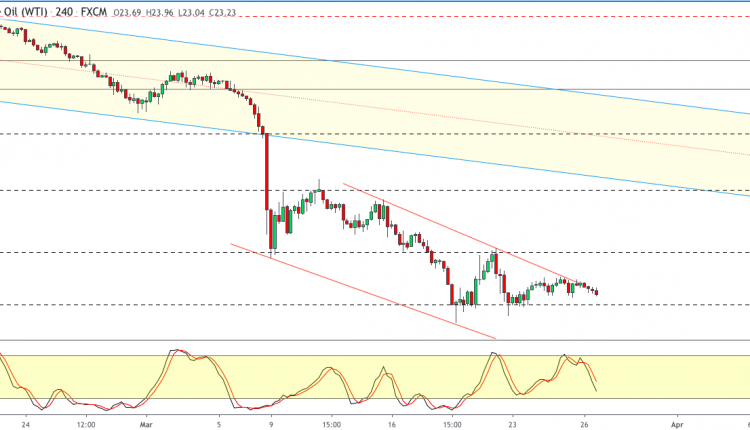
WTI Crude oil prices are trading weaker, down over 4% on the day.
This comes amid the trend line holding up as dynamic resistance.
If the declines continue, then we expect a move lower back to the 22.00 level of support.
With the lower highs forming, there is a chance that WTI crude oil will converge into a descending triangle pattern. This signals a possible breakdown further below the 22.00 level.
Gasoline demand likely to fall to levels not witnessed since Nixon era
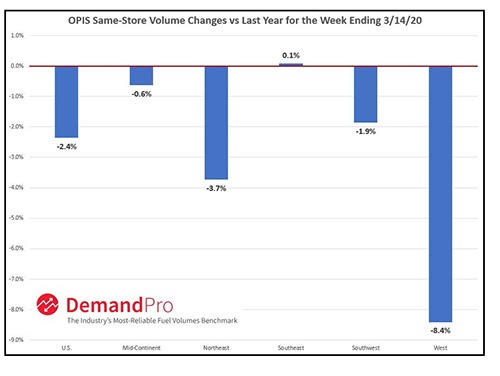
Gaithersburg, Md. (March 27, 2020) – U.S. gas station operators are bracing for the impact of COVID-19 on fuel sales, as same-store gasoline sales were down 2.4% nationwide for the week ending March 14, when compared to the same week last year, according to OPIS Demand Report, a weekly survey of more than 15,000 fuel stations nationwide*.
More troubling for the long-term, says retail experts from Oil Price Information Service (OPIS) by IHS Markit (NYSE: INFO), is the data is finally starting to hint at the potential demand destruction to come. Data collected so far on sales in the week ending March 21, shows demand destruction increasing 10-fold or more across retail chains.
“At a time when rapidly decreasing oil prices would theoretically lead to an increase of consumer demand for gasoline, much of the country is shutting down economic activity due to the COVID-19 outbreak,” said Tom Kloza, global head of energy analysis at OPIS. “We are likely to see weekly gasoline demand numbers drop to levels last witnessed in the Nixon Administration, and we’ll see those lower levels in April.”
The epicenter of the COVID-19 outbreak in the United States began initially on the West Coast, particularly in Washington state and parts of California, and according to the OPIS Demand Report, gasoline demand data seen in the West and Northeast regions early in the outbreak may be the proverbial “canary in the coal mine,” as an indicator for what is to come for the rest of U.S. as the virus spreads.
Compared to figures from the same week in 2019, average weekly gasoline demand volumes were down 8.4% in the Western part of the country alone from the same week prior year, according to the OPIS analysis.
The Northeast region, where New York and other metropolitan areas have seen a large increase in positive tests for COVID-19, saw year-on-year fuel demand decline 3.7%. Again, conversations with retailers in some of these impacted states are suggesting year-on-year volume losses of 20% to 40%, which will be chronicled in the next OPIS Demand Report.
With many states implementing social distancing regulations, and some even moving to shelter-in-place policies, Kloza expects even more significant declines in U.S. gasoline demand in the coming weeks.
“We are likely to see weekly gasoline demand numbers slide below 6 million barrels per day – volumes last witnessed during the Nixon Administration, and we’ll likely see those lower levels in April,” Kloza said.
*The OPIS Demand Report tracks same-store gasoline volumes on a national, regional, and state level (where available). OPIS Demand Report and its affiliated OPIS DemandPro products allow users to track industry trends for overall gasoline sales.
To learn more about the OPIS Demand Report or OPIS DemandPro, please contact Brian Norris, Executive Director – Retail Data and Product Management at OPIS, at [email protected].
Oil Price Information Service (OPIS) by IHS Markit (NYSE: INFO) provides accurate pricing, real-time news and expert analysis across the global fuel supply chain, including the Spot, Wholesale Rack and Retail markets. OPIS and OPIS PetroChem Wire enable customers to buy and sell oil and gas products with confidence via easy access to transparent data, expert-level customer support, educational events and energy data solutions with Axxis Software and OPIS RetailSuite.
IHS Markit (NYSE: INFO) is a world leader in critical information, analytics and solutions for the major industries and markets that drive economies worldwide. The company delivers next-generation information, analytics and solutions to customers in business, finance and government, improving their operational efficiency and providing deep insights that lead to well-informed, confident decisions. IHS Markit has more than 50,000 business and government customers, including 80 percent of the Fortune Global 500 and the world’s leading financial institutions. Headquartered in London, IHS Markit is committed to sustainable, profitable growth.