Canada’s central bank cut its benchmark interest rate for the third time in March, launched a program to purchase commercial paper to ease strains in short-term funding markets and will also begin buying government bonds in the secondary market.
The Bank of Canada (BOC) cut its target for the overnight rate by another 50 basis points to 0.25 percent and has now cut it by 150 basis points following a first cut on March 4 and then a second cut on March 13.
“This unscheduled rate decision brings the policy rate to its effective lower bound and is intended to provide support to the Canadian financial system and the economy during the COVID-10 pandemic,” BOC said.
Central banks worldwide have slashed their policy rates 98 times since the outbreak of the coronavirus began to impact financial markets in mid-January, many at emergency policy meetings.
But BOC is the first central bank to cut its rate three times in less than a month.
The latest cut follows another emergency policy meeting by BOC as central banks worldwide have now cut rates at 52 extraordinary meetings since March 3 when the U.S. Federal Reserve kicked off this month’s rapid pace of monetary easing worldwide.
The Bank of Canada issued the following press release:
“The Bank of Canada today lowered its target for the overnight rate by 50 basis points to ¼ percent. The Bank Rate is correspondingly ½ percent and the deposit rate is ¼ percent. This unscheduled rate decision brings the policy rate to its effective lower bound and is intended to provide support to the Canadian financial system and the economy during the COVID-19 pandemic.
The spread of COVID-19 is having serious consequences for Canadians and for the economy, as is the abrupt decline in world oil prices. The pandemic-driven contraction has prompted decisive fiscal policy action in Canada to support individuals and businesses and to minimize any permanent damage to the structure of the economy.
The Bank is playing an important complementary role in this effort. Its interest rate setting cushions the impact of the shocks by easing the cost of borrowing. Its efforts to maintain the functioning of the financial system are helping keep credit available to people and companies. The intent of our decision today is to support the financial system in its central role of providing credit in the economy, and to lay the foundation for the economy’s return to normalcy.
The Bank’s efforts have been primarily focused on ensuring the availability of credit by providing liquidity to help markets continue to function. To promote credit availability, the Bank has expanded its various term repo facilities. To preserve market function, the Bank is conducting Government of Canada bond buybacks and switches, purchases of Canada Mortgage Bonds and banker’s acceptances, and purchases of provincial money market instruments. All these additional measures have been detailed on the Bank’s website and will be extended or augmented as needed.
Today, the Bank is launching two new programs.
First, the Commercial Paper Purchase Program (CPPP) will help to alleviate strains in short-term funding markets and thereby preserve a key source of funding for businesses. Details of the program will be available on the Bank’s web site.
Second, to address strains in the Government of Canada debt market and to enhance the effectiveness of all other actions taken so far, the Bank will begin acquiring Government of Canada securities in the secondary market. Purchases will begin with a minimum of $5 billion per week, across the yield curve. The program will be adjusted as conditions warrant, but will continue until the economic recovery is well underway. The Bank’s balance sheet will expand as a result of these purchases.
The Bank is closely monitoring economic and financial conditions, in coordination with other G7 central banks and fiscal authorities, and will update its outlook in mid-April. As the situation evolves, Governing Council stands ready to take further action as required to support the Canadian economy and financial system and to keep inflation on target.”
Gains come for the fifth consecutive day as the US dollar is easing.
After clearing the resistance level of 1.0900, price action is likely to continue towards the 1.1055 region.
We could expect to see the gains stalling near the 1.1055 level. A reversal at this level will see a possible decline back to 1.0900 level where support will likely form.
The US dollar fell again relative to a basket of major currencies. The dollar index (#DX) closed in the negative zone (-1.53%). The US dollar was under pressure due to a record number of jobless claims. Investors expected a value of 1.65 million, but in fact, the number counted to 3.28 million. At the same time, Federal Reserve Chairman Jerome Powell assured investors that the Fed “is not going to run out of ammunition” and the regulator still has methods to maintain the economy. Also, in the United States, a record number of coronavirus cases was reported, which counted to 85,996. Thus, the United States overtook China and Italy in terms of the number of infected.
The British pound rose slightly after the Bank of England meeting. So, the regulator decided not to lower the key interest rate and left it at the level of 0.10% per annum. The £200 billion asset buyback program has also not been adjusted.
The “black gold” prices continue to consolidate. Currently, futures for the WTI crude oil are testing the $22.80 mark per barrel. At 19:00 (GMT+2:00), U.S. Baker Hughes Total Rig Count will be published.
Market indicators
Yesterday, there were aggressive purchases in the US stock market: #SPY (+5.84%), #DIA (+6.14%), #QQQ (+5.27%).
The 10-year US government bonds yield fell again. At the moment, the indicator is at the level of 0.77-0.78%.
The news feed on 2020.03.27:
– Michigan consumer sentiment and expectations at 16:00 (GMT+2:00).
– The 5G revolution, American military defense, and even time itself are dependent on this one critical metal that China monopolizes and that the U.S. is desperate to get more of.
The metal is Cesium, and it’s quite possible you’ve never even heard of it–yet, global dominance, which depends on technological superiority, can’t happen without it.
In May 2018 Cesium was added to the list of critical minerals by the United States Department of the Interior.
In fact, there are 16 metals in total that are absolutely critical to high-tech industries, military applications and telecommunications–and China controls the supply of every single one because it controls 96% of production.
That includes cesium, for which China has a monopoly on stockpiles, mines aren’t really producing anymore, and the United States has none, leaving North America’s only hope in Canada.
Of five cesium occurrences in Canada’s Ontario province, a small-cap Canadian miner called Power Metals owns 100% of three of them (West Joe, Tot Lake and Marko).
Time Is Running Out for This Most Strategic of Metals
Cesium is so secretive and obscure that it’s nearly impossible to track its real market price.
It’s strategic in and of itself, but its rarity makes it even more critical.
The supreme technological war of global dominance can’t be won without these metals, so whoever controls them has the upper hand.
Cesium is described by the German Institute for Strategic Metals (ISE) as “the most electropositive of all stable elements in the periodic table”, and the heaviest of the stable metals. Cesium is “extremely pyrophoric, ignites spontaneously when in contact with air, and explodes violently in water or ice at any temperature above -116 C”.
The strategic metal’s applications in the healthcare industry are expected to soar as laboratories already use cesium compounds in medical imaging, cancer therapy, positron emission tomography (PET) and others.
The latest market analysis by Technavio predicts the cesium market will grow by 1.66 thousand MT between 2020 and 2014, driven by everything from catalyst promoters, glass amplifiers, photoelectric cell components, crystals in scintillation counters, and getters in vacuum tubes.
Much cesium demand also comes from the oil and gas industry, which uses cesium formate brines in drilling fluids to prevent blow-outs in high-temperature, over-pressurized wells.
In terms of world dominance, the “cesium standard” is the key. This is the standard by which the accurate commercially available atomic clocks measure time, and it’s vital for the data transmission infrastructure of mobile networks, GPS and the internet.
That means it has serious defense applications as well, including in infrared detectors, optics, night vision goggles and much, much more. A cesium laser has even been invested for use in missile defense and other technological applications.
So, imagine China being able to starve manufacturers of something like cesium, which would seriously disrupt U.S. industry and hinder the development of critical military equipment.
That’s why, finally, in December 2019, the United States and Canada agreed on a strategy to reduce the need for rare-earth metals mined or controlled by China.
Wide Open Playing Field
The only company in the cesium supply chain right now is Chinese, and one of the only companies on the radar for potential commercial cesium supplies in North America is Canadian junior Power Metals, which is hoping to prove that it’s sitting on the world’s fourth deposit of the critical metal.
The company discovered the pegmatites at West Joe Dyke in August 2018, intersecting high-grade cesium mineralization in six drill holes when it was targeting lithium instead.
So, the focus now is not on what has been lost to China, but the promise of new North American critical cesium.
But Dr. Julie Selway, a key geologist for the Ontario Geological Survey during the tantalum boom of the early 2000s, and now VP of exploration for Power Metals, says the three properties the company is drilling are likely to have similar finds as the strategically important Sinclair mine in Australia.
“They are shipping their resource, which they say is higher than 10% cesium-oxide, and ours have some that are between 12% and 14% of cesium-oxide,” Selway–one of the world’s most renowned experts on pegmatites–told Oilprice.com.
Power Metals has intersected cesium (Cs) mineralization in 6 drill holes on West Joe Dyke, with “exceptionally high-grade” Li and Ta intervals. They also found Cs mineralization in drill core in the first new dyke below Main Dyke, as well as in the drill core in Northeast Dyke.
On February 20th, Power Metals announced its exploration plans, and will begin stripping and channel sampling on West Joe Dyke in the Q2 of this year already. That’s when they’ll expose, sample and assay the cesium mineralization on surface outcrops to find more cesium-bearing pegmatite dykes nearby.
This is one big chance to one-up Beijing, which, according to the Wall Street Journal, has tried to manipulate the market so critical metals such as Cesium are cheaper in China than outside the country. What this did was prompt some major manufacturers and tech industries to set up shop in China, where they could get supplies at a lower cost.
You might not have heard of cesium before, but you will hear about it soon because North America needs its own supply if it’s going to win the war for global technological dominance–and the front line of defense could end up being West Joe Dyke, and a junior explorer that not only thinks strategically, but may be sitting on one of the only deposits that China doesn’t control.
Other companies shaking up China’s rare-earth dominance:
Teck Resources (NYSE:TECK, TSX:TECK)
Teck could be one of the best-diversified miners out there, with a broad portfolio of Copper, Zinc, Energy, Gold, Silver and Molybdenum assets. Its free cash flow and a lower volatility outlook for base metals in combination with a potential trade war breakthrough could send the stock higher in H2 of this year.
Teck’s share price stabilized last year and many investment banks now see the stock as undervalued. Low prices for Canadian crude and disappointing base metals prices weighed on Q4 earnings.
Despite its struggles, however, Teck Resources recently received a favorable investment rating from Fitch and Moody’s, and will likely benefit from its upgraded score. “Having investment grade ratings is very important to us and confirms the strong financial position of the company,” said Don Lindsay, President and CEO. “We are very pleased to receive this second credit rating upgrade.”
Turquoise Hill Resources (NYSE:TRQ ,TSX:TRQ)
Turqouise is a mid-cap Canadian mineral exploration and development company headquartered in Vancouver, British Columbia. Its focus is on the Pacific Rim where it is in the process of developing several large mines.
The company mines a diversified set of metals/minerals including Coal, Gold, Copper, Molybdenum, Silver, Rhenium, Uranium, Lead and Zinc. One of the fortes of Turquoise hill is its good relationship with mining giant Rio Tinto.
Turquoise has seen its share price languish last year, and the successful development of its world-class Oyu Tolgoi project in Mongolia is of utmost important to the future of this miner.
Pretium Resources (NYSE:PVG, TSX:PVG)
This impressive Canadian company is engaged in the acquisition, exploration and development of precious metal resource properties in the Americas. Pretium has an impressive portfolio and if you can catch the stock while the price is right, there could be huge opportunity for upside. Additionally, construction and engineering activities at its top location continue to advance, and commercial production is targeted for this year.
With Pretium’s variety of assets, this mining giant is a key figure in Canada’s resource realm. Investors know a good thing when they see it and have definitely taken note of this company’s ambitious and forward-looking drive.
Magna International (NYSE:MGA, TSX:MG)
Based in Aurora, Ontario, Magna is a global automotive supplier is gutsy and innovative–and definitely tuned to the obvious future–clean transportation. A great catalyst is its development of a combo electric/hydrogen vehicle–a fuel cell range-extended EV (FCREEV). It’s not going to produce them (for now, at least) but plans to use the model to show off its engineering and design prowess and produce elements of the electric drivetrain and contract manufacturing. It’s insightful, forward-thinking and smart value/low cost for shareholders.
Agnico Eagle Mines Ltd (NYSE:AEM, TSX:AEM)
Canadian based gold producer, Agnico Eagle Mines is an especially noteworthy company for investors. Why? Between 1991-2010, the company paid out dividends every year. With operations in Quebec, Mexico, and Finland, the company also is taking place in exploration activities in Europe, Latin America, and the United States.
While Agnico primarily focuses on gold, it made this list because it’s a prime example of sustainability and environmental consciousness, and that means everything in a world rapidly shifting away from traditional mining.
**IMPORTANT! BY READING OUR CONTENT YOU EXPLICITLY AGREE TO THE FOLLOWING. PLEASE READ CAREFULLY**
Forward-Looking Statements
This news release contains forward-looking information which is subject to a variety of risks and uncertainties and other factors that could cause actual events or results to differ from those projected in the forward-looking statements. Forward looking statements in this release include that prices for cesium will retain value in future as currently expected; that PWM can fulfill all its obligations to maintain its properties; that PWM’s property can successfully mine commercial quantities of cesium; that the three properties the company is drilling are hoped to have similar finds as the strategically important Sinclair mine in Australia; that occurrences and indications of a commercially sized deposit become reality; that high grades found in samples are indicative of a high grade deposit; and that PWM will be able to carry out its business plans. These forward-looking statements are subject to a variety of risks and uncertainties and other factors that could cause actual events or results to differ materially from those projected in the forward-looking information. Risks that could change or prevent these statements from coming to fruition include that aspects or all of the properties’ development may not be successful, mining of the cesium may not be cost effective, the price of cesium may not stay high and it may never be profitable to mine cesium; PWM may not raise sufficient funds to carry out its plans, changing costs for mining and processing; increased capital costs; the timing and content of upcoming work programs; geological interpretations and technological results based on current data that may change with more detailed information or testing; potential process methods and mineral recoveries assumptions based on limited test work with further test work may not be viable; competitors may offer cheaper cesium; more production of Cesium could reduce its price; alternatives could be found for cesium; the availability of labour, equipment and markets for the products produced; and despite the current expected viability of its projects, that the minerals cannot be economically mined on its properties, or that the required permits to build and operate the envisaged mines cannot be obtained. The forward-looking information contained herein is given as of the date hereof and the Company assumes no responsibility to update or revise such information to reflect new events or circumstances, except as required by law.
DISCLAIMERS
ADVERTISEMENT. This communication is not a recommendation to buy or sell securities. Oilprice.com, Advanced Media Solutions Ltd, and their owners, managers, employees, and assigns (collectively “the Company”) may in the future be paid by PWM to disseminate future communications if this communication proves effective. In this case the Company has not been paid for this article. But the potential for future compensation is a major conflict with our ability to be unbiased, more specifically:
This communication is for entertainment purposes only. Never invest purely based on our communication. We have not been compensated by PWM but may in the future be compensated to conduct investor awareness advertising and marketing for TSXV: PWM.V; OTC:PWRMF. Therefore, this communication should be viewed as a commercial advertisement only. We have not investigated the background of the company. Frequently companies profiled in our alerts experience a large increase in volume and share price during the course of investor awareness marketing, which often end as soon as the investor awareness marketing ceases. The information in our communications and on our website has not been independently verified and is not guaranteed to be correct.
SHARE OWNERSHIP. The owner of Oilprice.com owns shares of this featured company and therefore has an additional incentive to see the featured company’s stock perform well. The owner of Oilprice.com will not notify the market when it decides to buy more or sell shares of this issuer in the market. The owner of Oilprice.com will be buying and selling shares of this issuer for its own profit. This is why we stress that you conduct extensive due diligence as well as seek the advice of your financial advisor or a registered broker-dealer before investing in any securities.
NOT AN INVESTMENT ADVISOR. The Company is not registered or licensed by any governing body in any jurisdiction to give investing advice or provide investment recommendation. ALWAYS DO YOUR OWN RESEARCH and consult with a licensed investment professional before making an investment. This communication should not be used as a basis for making any investment.
RISK OF INVESTING. Investing is inherently risky. Don’t trade with money you can’t afford to lose. This is neither a solicitation nor an offer to Buy/Sell securities. No representation is being made that any account will or is likely to achieve profits similar to those discussed.
The coronavirus pandemic and its economic fallout will trigger a ‘skyward surge’ in sustainable, responsible and impactful investing over the next 12 months, affirms the CEO of one of the world’s largest independent financial advisory organizations.
The prediction from the boss of deVere Group, which has more than $12bn under advisement, comes as Bloomberg analysis reveals that the average Environmental, Social and Governance (ESG) fund fell by half the decrease registered by the S&P 500 Index over the same period during the Covid-19 crisis.
ESG refers to a class of investing also known as “sustainable investing.” The umbrella term covers three main factors. ‘E’ is for ‘environment’ and includes issues such as climate change policies, carbon footprint, and use of renewable energies. ‘S’ is for ‘social’ and includes workers’ rights and protections. ‘G’ is for ‘governance’ and includes diversity of the board and corporate transparency.
Mr Green comments: “The coronavirus pandemic will trigger a ‘skyward surge’ in sustainable, responsible and impactful investing over the next 12 months for three key reasons.
“First, before the pandemic, research has revealed that investments that score well in terms of ESG credentials often outperform the market and have lower volatility over the long-run.
“Since the Covid-19 public health emergency up-ended the world, the latest broad analysis shows that ESG funds have typically continued to outperform others.”
He continues: “Second, the coronavirus pandemic has underscored the vulnerability and fragility of societies and the planet.
“It has underscored that increasingly companies will only survive and thrive if they operate with a nod from the wider court of public approval.
“It has underscored the complexity and interconnectedness of our world in terms of demand and supply, in trade and commerce – and how these can be under threat if not sustainable.”
Mr Green goes on to add: “Third, demographic shifts will support the trend. Millennials – those who were born in the time period ranging from the early 1980s to the mid-1990s and early 2000s – cite ESG investing as their top priority when considering investment opportunities.
“This is crucial because the biggest-ever generational transfer of wealth – likely to be around $30trn – from baby boomers to millennials will take place in the next few years.”
In January, deVere Group carried out a global survey that revealed 77% of millennials said that Environmental, Social and Governance (ESG) investing was their top priority when considering investment opportunities.
This survey highlighted that whilst traditional factors – such as anticipated returns (10%), past performance (7%), risk tolerance (4%) and tactical allocation (2%) – are important factors in millennial respondents’ investment decision-making, they are no longer enough by themselves.
Nigel Green concludes: “ESG investing was already going to reshape the investment landscape in this new decade – but the coronavirus will quicken the pace of this reshaping.
“Investors are increasingly aware that it is possible – and increasingly necessary – to make a profit while positively and proactively protecting people and the planet.
“As such, they will be making investment decisions after measuring the sustainability and societal impact of a sector or company as these criteria help to better determine their future financial performance, or in other words their risk and return.”
About:
deVere Group is one of the world’s largest independent advisors of specialist global financial solutions to international, local mass affluent, and high-net-worth clients. It has a network of more than 70 offices across the world, over 80,000 clients and $12bn under advisement.
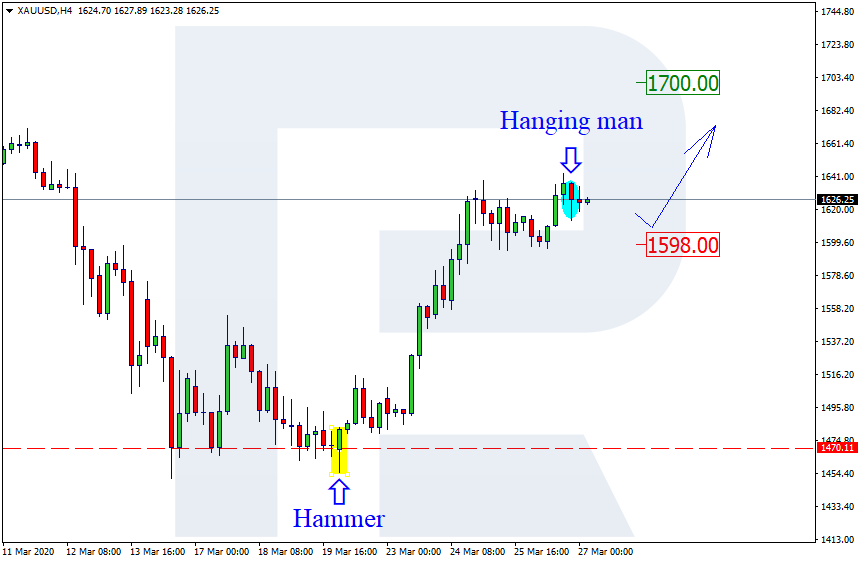
As we can see in the H4 chart, Gold is still growing from the support level. After forming several reversal patterns, such as Hammer, the pair is reversing. At the moment, the price is testing another resistance level not far from a Hanging Man pattern. The current situation implies that the pair may reverse to start a slight correction and then continue forming the rising tendency. The correctional target may be at 1598.00. in the future, the next upside target may be at 1700.00.
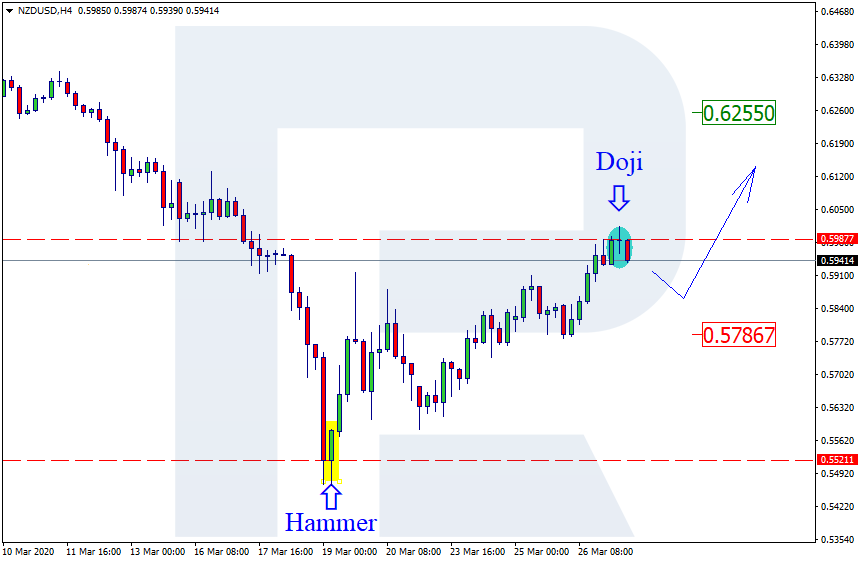
NZDUSD, “New Zealand vs. US Dollar”
As we can see in the H4 chart, after forming a Doji reversal pattern not far from the resistance level, the pair continues growing. At the moment, NZDUSD is reversing. The correctional target may be at 0.5786. After finishing the correction, the price may resume trading upwards. In this case, the upside target will be at 0.6255.
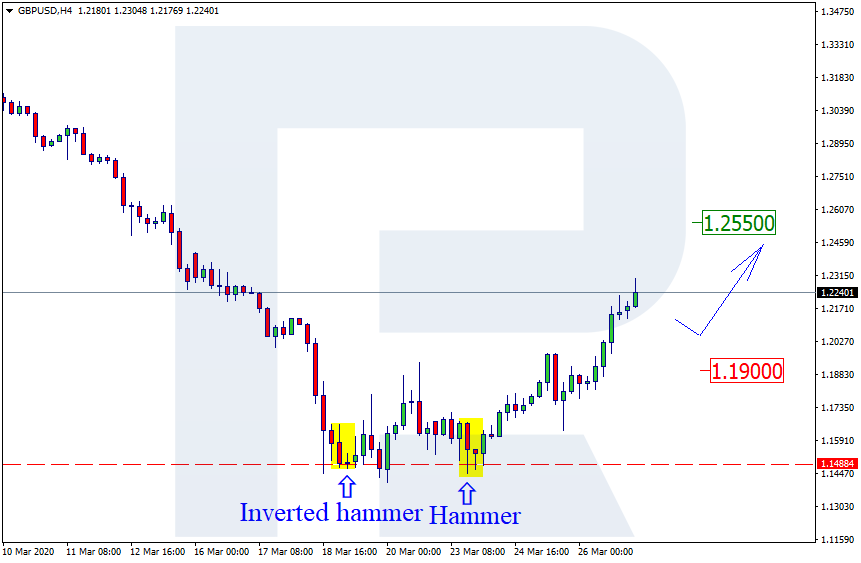
GBPUSD, “Great Britain Pound vs US Dollar”
As we can see in the H4 chart, the rising tendency continues. By now, GBPUSD has formed several reversal patterns, such as Hammer and Inverted Hammer, close to the support level. At the moment, the pair is reversing and testing the resistance level. There are no reversal patterns close to this level but the price may yet start a correction before further growth towards 1.2550. However, there is another scenario, which implies that the instrument may rebound from the resistance level and fall towards 1.1900.
Attention! Forecasts presented in this section only reflect the author’s private opinion and should not be considered as guidance for trading. RoboForex LP bears no responsibility for trading results based on trading recommendations described in these analytical reviews.
Note: This overview has an informative and tutorial character and is published for free. All the data, included in the overview, are received from public sources, recognized as more or less reliable. Moreover, there is no guarantee that the indicated information is full and precise. Overviews are not updated. The whole information in each overview, including opinion, indicators, charts and anything else, is provided only for familiarization purposes and is not financial advice or а recommendation. The whole text and its any part, as well as the charts cannot be considered as an offer to make a deal with any asset. IFC Markets and its employees under any circumstances are not liable for any action taken by someone else during or after reading the overview.
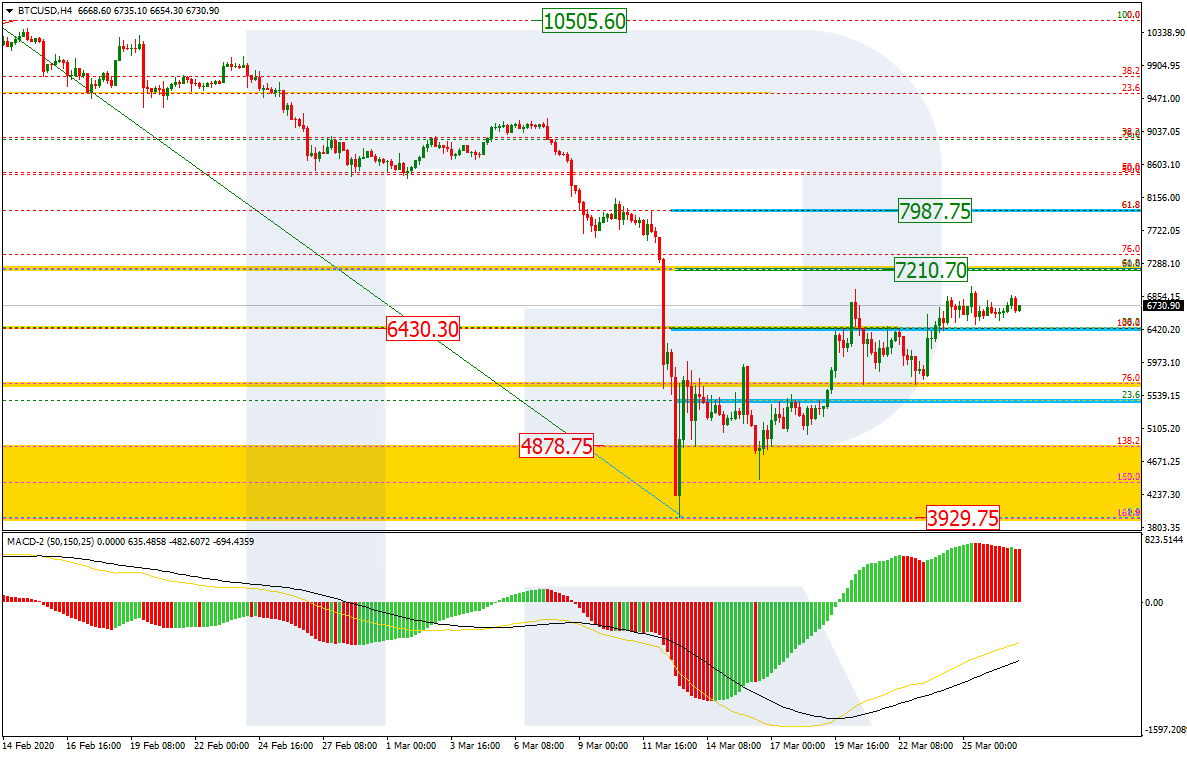
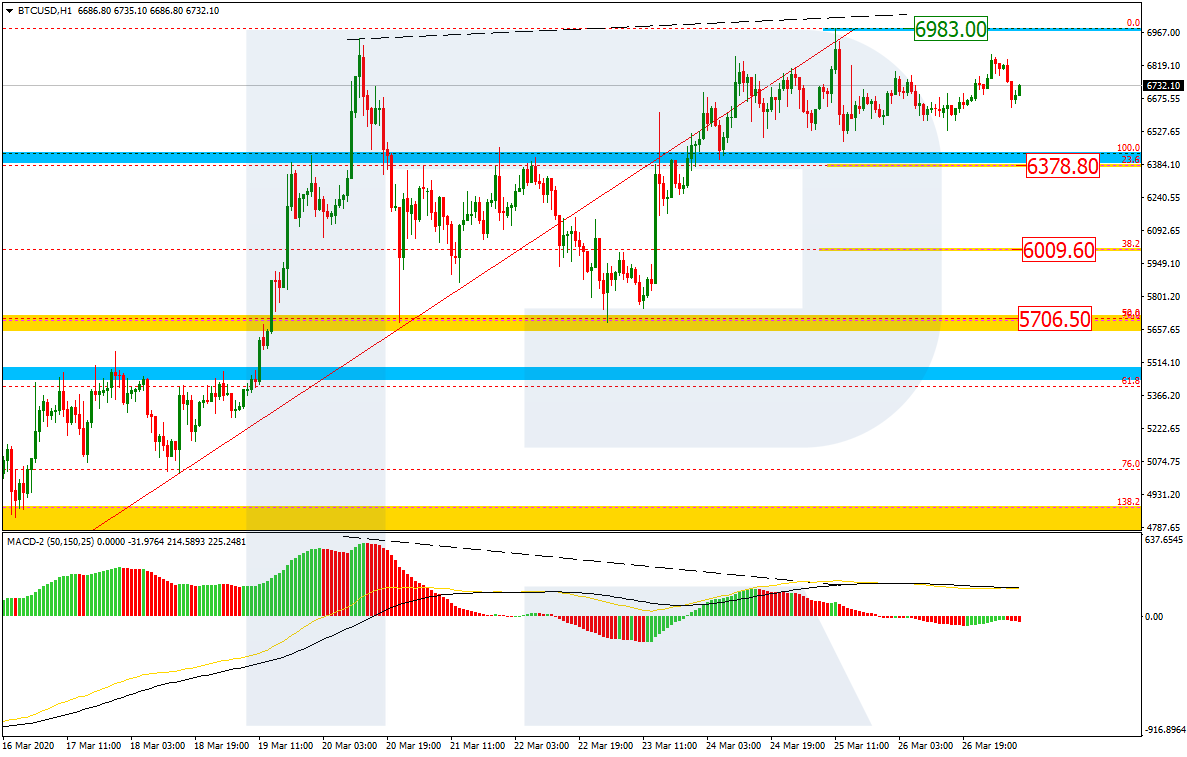
As we can see in the H4 chart, after reaching the post-correctional extension area between 138.2% and 161.8% fibo at 4878.75 and 3929.75 respectively, BTCUSD is still correcting upwards. By now, it has slowed down a bit at 38.2% fibo but after a short pause may continue growing towards 50.0% and 61.8% fibo at 7210.70 and 7987.75 respectively. The support is the low at 3929.75.
In the H1 chart, there is a divergence on MACD, which may indicate a new pullback. The targets may be 23.6%, 38.2%, and 50.0% at 6378.80, 6009.60, and 5706.50 respectively. The resistance is the high at 6983.00.
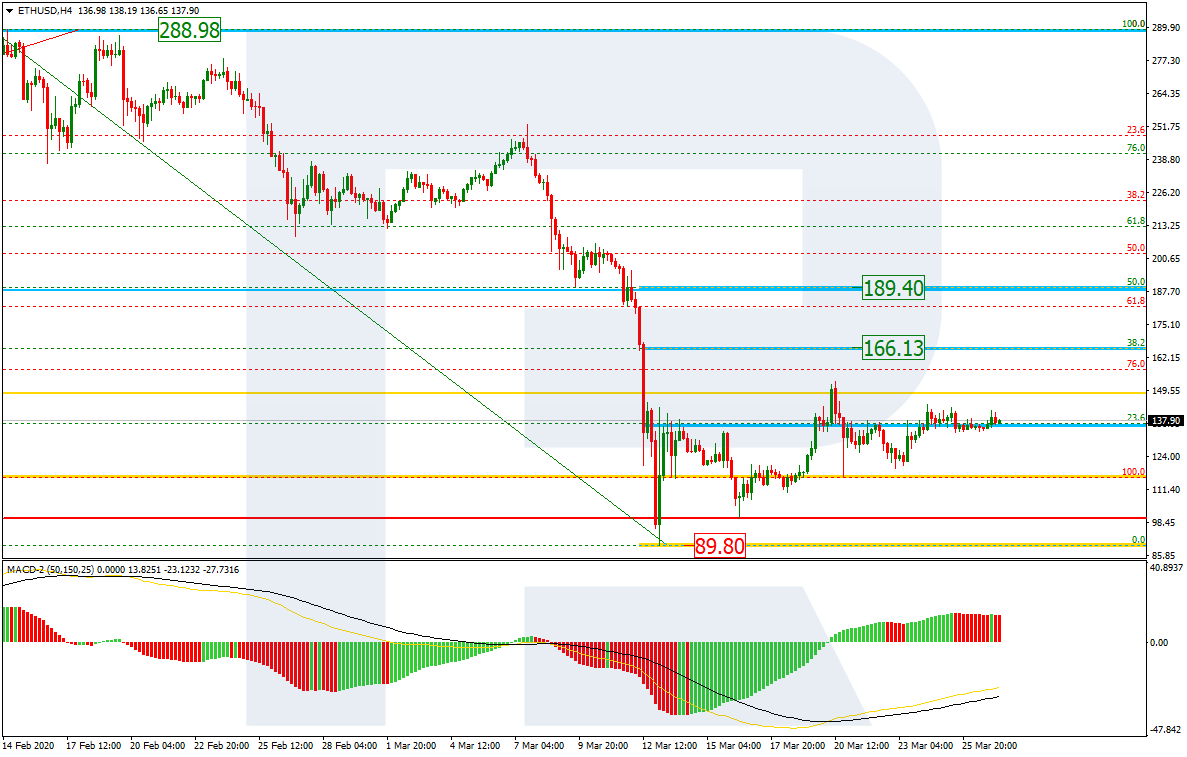
ETHUSD, “Ethereum vs. US Dollar”
As we can see in the H4 chart, after rebounding from the psychologically important level at 100.00, the pair is correcting. The first correctional wave has already reached 23.6% fibo; right now, the instrument is consolidating. The next correctional targets may be at 38.2% and 50.0% fibo at 166.13 and 189.40 respectively. The support is the low at 89.80.
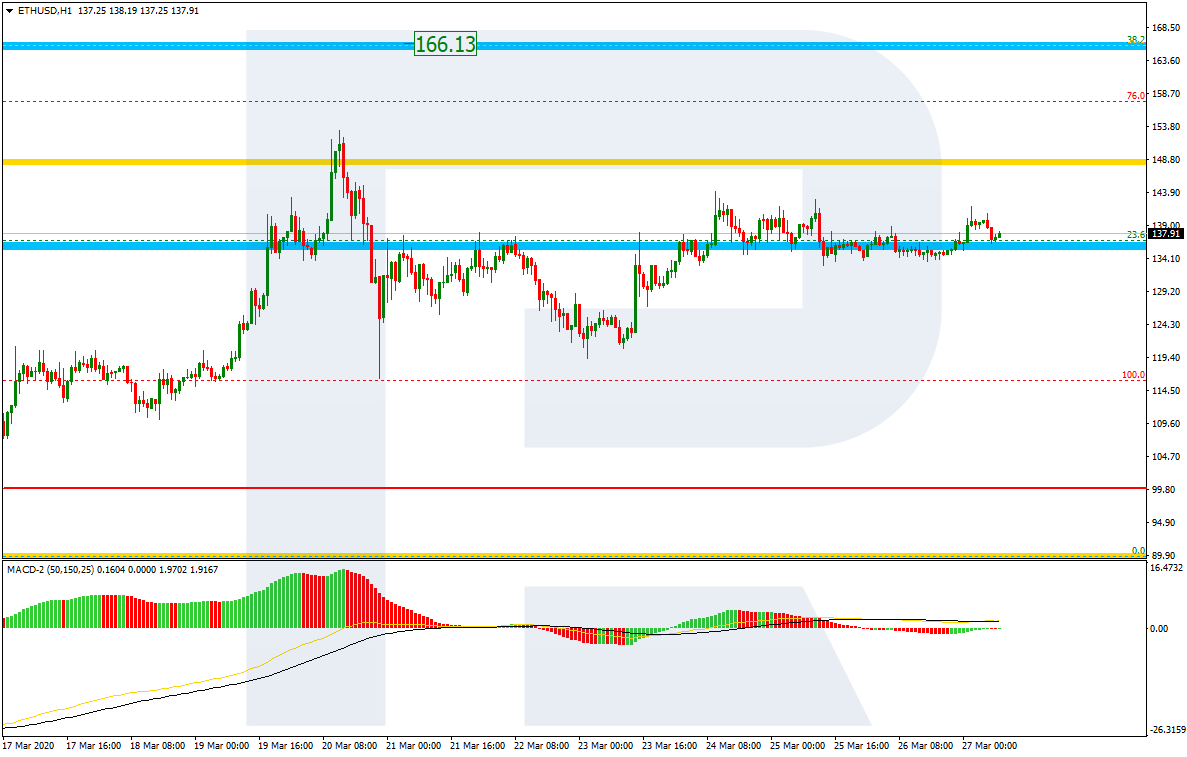
The H1 chart shows more detailed structure of the current consolidation around 23.6% fibo.
Attention! Forecasts presented in this section only reflect the author’s private opinion and should not be considered as guidance for trading. RoboForex LP bears no responsibility for trading results based on trading recommendations described in these analytical reviews.
United States goods trade deficit fell in February: it dropped to $59.9 billion from $65.9 billion in January, when a decline to $64.5 billion was forecast. This is bullish for USDCHF.
Greenback significantly weakened relative to its main competitors. During yesterday’s and today’s trading, the growth of EUR/USD quotes exceeded 180 points. The COVID-19 virus epidemic continues to negatively impact the global economy. The US Department of Labor reported that the number of initial applications for unemployment benefits reached a record high and exceeded 3 million. Currently, the EUR/USD currency pair is consolidating in the range of 1.09800-1.10800. The trading instrument can recover further. Open positions from key levels.
The Economic News Feed for 27.03.2020:
— data on personal expenses (US) – 14:30 (GMT+2:00).
Indicators signal the power of buyers: the price has fixed above 50 MA and 100 MA.
The MACD histogram is in the positive zone, indicating bullish sentiment.
The Stochastic Oscillator is in the neutral zone, the %K line is below the %D line, which gives a signal to sell EUR/USD.
Trading recommendations
Support levels: 1.09800, 1.08800, 1.08000
Resistance levels: 1.10800, 1.11800
If the price consolidates above the level of 1.10800, the quotes can grow toward 1.11500-1.12000.
Alternatively, the quotes could descend toward 1.09000-1.08500.
The GBP/USD currency pair
Technical indicators of the currency pair:
Prev Open: 1.18744
Open: 1.21546
% chg. over the last day: +2.66
Day’s range: 1.21313 – 1.23058
52 wk range: 1.1466 – 1.3516
The GBP/USD currency pair shows a pronounced upward trend. Since the beginning of this week, quotes growth exceeded 550 points. Yesterday, the Bank of England, as expected, kept the basic parameters of monetary policy at the same level. The pound is currently consolidating in the range 1.21300-1.23000. Greenback demand has weakened significantly. The trading instrument can grow further. Open positions from key levels.
The Economic News Feed for 27.03.2020 is calm.
Indicators signal the power of buyers: the price has fixed above 50 MA and 100 MA.
The MACD histogram is in the positive zone, indicating bullish sentiment.
The Stochastic Oscillator is in the neutral zone, the% K line is below the% D line, which indicates a bearish sentiment.
Trading recommendations
Support levels: 1.21300, 1.19750, 1.18750
Resistance levels: 1.23000, 1.24200
If the price consolidates above the round level of 1.23000, expect the quotes to grow toward 1.24000-1.24500.
Alternatively, the quotes could descend toward 1.12000-1.19500.
The USD/CAD currency pair
Technical indicators of the currency pair:
Prev Open: 1.41904
Open: 1.40466
% chg. over the last day: -1.23
Day’s range: 1.39887 – 1.40936
52 wk range: 1.2949 – 1.4668
The USD / CAD currency pair is dominated by a bearish sentiment. USD/CAD quotes again updated local lows. The trading tool found support at 1.39900. 1.41500 is already a mirror resistance. Demand for the US dollar has weakened significantly. USD/CAD quotes can descend further. We recommend you to pay attention to the dynamics of prices of “black gold”. Open positions from key levels.
The Economic News Feed for 27.03.2020 is calm.
Indicators signal the power of sellers: the price has fixed below 50 MA and 100 MA.
MACD is in the negative zone, indicating a bearish sentiment.
The Stochastic Oscillator is in the neutral zone, the %K line is above the %D line, which gives a signal to buy USD/CAD.
Trading recommendations
Support levels: 1.39900, 1.38700
Resistance levels: 1.41500, 1.42750, 1.43800
If the price consolidates below 1.39900, expect a descend toward 1.39000-1.38000.
Alternatively, the quotes could grow toward 1.42500-1.43500.
The USD/JPY currency pair
Technical indicators of the currency pair:
Prev Open: 111.155
Open: 109.458
% chg. over the last day: -1.45
Day’s range: 108.237 – 109.471
52 wk range: 101.19 – 112.41
The USD/JPY currency pair shows a negative dynamic. During yesterday’s and today’s trading, the drop in quotations exceeded 250 points. The trading instrument has set new local lows. At the moment, USD/JPY quotes are consolidating in the range of 108.200-109.300. The yen can descend further. We recommend you to pay attention to the dynamics of yield on US government bonds. Open positions from key levels.
The Economic News Feed for 27.03.2020 is calm.
Indicators signal the power of sellers: the price has fixed below 50 MA and 100 MA.
MACD is in the negative zone, indicating a bearish sentiment.
The Stochastic Oscillator is in the neutral zone, the %K line is above the %D line, which gives a signal to buy USD/JPY.
Trading recommendations
Support levels: 108.200, 107.000
Resistance levels: 109.300, 110.000, 110.750
If the price consolidates below 108.200, expect the quotes to correct toward 107.500-107.000.
Alternatively, the quotes could grow toward 110.000-110.700