Will XAUUSD Breakout From The Ascending Wedge?

By Orbex

Gold prices consolidated into the close of last week with an ascending wedge pattern.

With price action below the 1655 handle, this suggests a possible pullback to the gains made in the past few days. But the bias remains mixed, however.

Only a close above 1655 will confirm further upside. Given the ascending wedge pattern, there is scope for a move back to the 1594 level of support.

But eventually, gold prices might have to slip back to the 1534 level to establish support more firmly.

By Orbex


Forex Technical Analysis & Forecast 30.03.2020

Article By RoboForex.com

EURUSD, “Euro vs US Dollar”

After finishing the ascending structure at 1.1146 and almost completing the third ascending wave, EURUSD is trading downwards. Possibly, the pair may start a new correction towards 1.0980, at least. Later, the market may form one more ascending structure with the target at 1.1236.

EURUSD
Risk Warning: the result of previous trading operations do not guarantee the same results in the future

GBPUSD, “Great Britain Pound vs US Dollar”

After completing the ascending structure at 1.2470, GBPUSD is moving downwards. Today, the pair may correct towards 1.2185 and then form one more ascending structure with the target at 1.2650.

GBPUSD
Risk Warning: the result of previous trading operations do not guarantee the same results in the future

USDCHF, “US Dollar vs Swiss Franc”

USDCHF has finished the descending wave at 0.9500; right now, it is growing to reach 0.9656, at least. Later, the market may resume trading downwards with the target at 0.9470.

USDCHF
Risk Warning: the result of previous trading operations do not guarantee the same results in the future

USDJPY, “US Dollar vs Japanese Yen”

USDJPY is still falling towards 106.80. Possibly, today the pair may reach this level and then start another correction towards 109.04. After that, the instrument may resume trading inside the downtrend with the target at 106.77.

USDJPY
Risk Warning: the result of previous trading operations do not guarantee the same results in the future

AUDUSD, “Australian Dollar vs US Dollar”

AUDUSD has reached its upside target at 0.6138; right now, it is forming a narrow consolidation range at the top of this wave. Possibly, the pair may grow towards 0.6220 and then resume trading downwards to reach 0.5822.

AUDUSD
Risk Warning: the result of previous trading operations do not guarantee the same results in the future

USDRUB, “US Dollar vs Russian Ruble”

USDRUB is still consolidating around 78.00; right now, it is growing towards 79.75. Possibly, the pair may reach this level and then resume trading downwards to break 77.10. Later, the market may continue falling with the target at 75.20.

USDRUB
Risk Warning: the result of previous trading operations do not guarantee the same results in the future

USDCAD, “US Dollar vs Canadian Dollar”

USDCAD continues falling. Today, the pair may correct to reach 1.4140. Later, the market may form a new descending structure with the target at 1.3755.

USDCAD
Risk Warning: the result of previous trading operations do not guarantee the same results in the future

XAUUSD, “Gold vs US Dollar”

Gold is falling towards 1597.50. Possibly, the pair may reach this level and then start another growth towards 1612.50. After that, the instrument may form a new descending structure with the first target at 1590.50.

GOLD
Risk Warning: the result of previous trading operations do not guarantee the same results in the future

BRENT

Brent is falling. Possibly, today the pair may reach 23.55 and then form one more ascending structure towards 25.25. Later, the market may fall to reach 23.23 and then resume trading upwards with the target at 25.95.

BRENT
Risk Warning: the result of previous trading operations do not guarantee the same results in the future

BTCUSD, “Bitcoin vs US Dollar”

BTCUSD has broken 6150.00 to the downside. The main scenario implies that the instrument may correct towards 5300.00 and then start a new growth with the target at 7500.00.

BITCOIN

Article By RoboForex.com

Attention!
Forecasts presented in this section only reflect the author’s private opinion and should not be considered as guidance for trading. RoboForex LP bears no responsibility for trading results based on trading recommendations described in these analytical reviews.

The Analytical Overview of the Main Currency Pairs on 2020.03.30

by JustForex

The EUR/USD currency pair

Technical indicators of the currency pair:
  • Prev Open: 1.10279
  • Open: 1.11161
  • % chg. over the last day: +1.02
  • Day’s range: 1.10608 – 1.11441
  • 52 wk range: 1.0777 – 1.1494

The coronavirus pandemic continues to negatively impact the global economy. The U.S. president on Sunday extended the recommendation for self-isolation until the end of April. Earlier, Donald Trump signed a bill, granting financial support to the US economy in the amount of $2 trillion. Currently, the EUR/USD currency pair is consolidating in the range of 1.10400-1.11450. The trading instrument has the potential for further growth. We recommend opening positions from key levels.

At 17:00 (GMT+3:00) the US will publish an index of unfinished sales in the real estate market.

EUR/USD

Indicators signal the power of buyers: the price has fixed above 50 MA and 100 MA.

The MACD histogram is in the positive zone, indicating bullish sentiment.

The Stochastic Oscillator is in the neutral zone, the %K line began to cross the %D line. There are no signals at the moment.

Trading recommendations
  • Support levels: 1.10400, 1.09600, 1.08850
  • Resistance levels: 1.11450, 1.12000

If the price consolidates above 1.11450, expect further growth to 1.12000.

Alternatively, the quotes could reduce toward 1.09700-1.09400.

The GBP/USD currency pair

Technical indicators of the currency pair:
  • Prev Open: 1.21546
  • Open: 1.24262
  • % chg. over the last day: +2.09
  • Day’s range: 1.23176 – 1.24666
  • 52 wk range: 1.1466 – 1.3516

On the GBP/USD currency pair, bullish sentiment still prevails. The pound reached key extremes. At the moment, GBP/USD quotes are testing the mirror support level of 1.23000. 1.24800 is the nearest resistance. Demand for USD remains at a fairly low level. We do not exclude further growth of the GBP/USD currency pair. Open positions from key levels.

The Economic News Feed for 30.03.2020 is calm.

GBP/USD

Indicators signal the power of buyers: the price has fixed above 50 MA and 100 MA.

The MACD histogram is in the positive zone, indicating a bullish sentiment.

The Stochastic Oscillator is in the neutral zone, the %K line crossed the %D line. There are no signals at the moment.

Trading recommendations
  • Support levels: 1.23000, 1.21450, 1.20150
  • Resistance levels: 1.24800, 1.25500

If the price consolidates above 1.24800, expect further growth toward 1.25500-1.26000.

Alternatively, the quotes could descend toward 1.22000-1.21000.

The USD/CAD currency pair

Technical indicators of the currency pair:
  • Prev Open: 1.40446
  • Open: 1.40170
  • % chg. over the last day: +0.50
  • Day’s range: 1.40076 – 1.40973
  • 52 wk range: 1.2949 – 1.4668

The USD / CAD currency pair has stabilized. Looney is currently trading in a flat without a defined trend. The key support and resistance levels are: 1.39900 and 1.41450, respectively. Participants in financial markets expect additional drivers. We recommend you to pay attention to the dynamics of oil prices and open positions from key levels.

The Economic News Feed for 30.03.2020 is calm.

USD/CAD

The indicators do not give accurate signals: the price crossed 50 MA.

The MACD histogram is near the 0 mark.

The Stochastic Oscillator is in the neutral zone, the %K line is above the %D line, which gives a signal to buy USD/CAD.

Trading recommendations
  • Support levels: 1.39900, 1.39250, 1.38700
  • Resistance levels: 1.41450, 1.42750, 1.43750

If the price consolidates below 1.39900, expect further descend toward 1.39000-1.38000.

Alternatively, the quotes could grow toward 1.42400-1.43000.

The USD/JPY currency pair

Technical indicators of the currency pair:
  • Prev Open: 109.458
  • Open: 107.644
  • % chg. over the last day: -1.54
  • Day’s range: 107.191 – 108.244
  • 52 wk range: 101.19 – 112.41

USD/JPY quotes show a steady downtrend. The trading instrument has again set new local lows. At the moment, the USD/JPY currency pair is consolidating in the range 107.200-108.250. Demand for safe haven currencies has grown significantly. The yen can grow further against the greenback. We recommend you to pay attention to the dynamics of yield on US government bonds. Open positions from key levels.

The Economic News Feed for 30.03.2020 is calm.

USD/JPY

Indicators signal the power of sellers: the price has fixed below 50 MA and 100 MA.

MACD is in the negative zone, indicating a bearish sentiment.

The Stochastic Oscillator is in the overbought zone, the% K line crossed the% D line. There are no signals at the moment.

Trading recommendations
  • Support levels: 107.200, 106.000.
  • Resistance levels: 108.250, 109.000, 110.000

If the price consolidates below 107.200, expect a drop toward 106.500-106.000.

Alternative ly, the quotes could grow toward 109.000-109.500.

by JustForex

US oil hits a 17-year low as investors await new economic data

By Hussein Sayed, Chief Market Strategist (Gulf & MENA), ForexTime

This week has kicked off with a new precedent. It isn’t the volatile performance of stocks, bonds, or currencies that are grabbing all the attention, but the moves in oil prices. US crude has tested levels below $20 for the first time in more than 17 years, with traders continuing to bet that the combination of widespread lockdowns across the globe and the breakdown of OPEC+ will continue to weigh on prices.

It is widely believed that the oil surplus will reach 25 million barrels a day by April, a level that could even make it difficult to find storage for this excess supply. While it’s becoming unprofitable to higher cost producers, many of them are still hoping others shut off production first. This game of attrition is likely to drag prices even lower and even a price of $10 per barrel is no longer unimaginable. At such a level, higher cost producers will have no choice but to shut production. However, long-term demand is what will determine where prices will be by year-end, and that will depend widely on how deep the recession will be and the shape of the recovery afterwards.

This time, the impact of plunging oil prices on equities and other asset classes is not going to be strong, as it’s no longer acting as a measure of risk. US stocks future indices were trading higher despite WTI sitting at a 17-year low.

Investors are likely assuming that in a matter of several weeks or a couple of months, we may return to normal, but that may prove to be a very risky bet. Over the previous 10 days, the growth rate of coronavirus infections was standing at 11.4%, and if infections continue to grow at the current pace, this will hit a figure of more than two million in the next 10 days. Unless we see a major decline in these numbers, any rally in risk assets may prove to be temporary.

While the Federal Reserve and other central bank actions, together with fiscal policy measures have to a large extent contained the economic damage, it’s the health situation and easing of the virus case count curve that will dictate the severity of the upcoming recession. Currently, we would expect asset prices to remain volatile until we have a better understanding of this.

Data wise, we’ll get snapshot of revised global PMI figures this week. Despite being ugly in Europe when first released, expect them to be even worse as more data has now been collected. While manufacturing in Europe had already been deteriorating even before the virus spread, the new figures won’t have much impact on markets. However, it will be interesting to see what the ISM data tells us about the US economy.

Friday’s US nonfarm payrolls will be under investors’ and traders’ microscopes after more than three million Americans filed claims for unemployment last week. Given that most lockdown policies were not in place until late March, the jobs report will not reflect the full impact of the virus outbreak, so we will probably have to wait until April to see the true impact. However, every piece of economic data is going to be closely monitored to have a better understanding of the pandemic impact on the global economy.

Disclaimer: The content in this article comprises personal opinions and should not be construed as containing personal and/or other investment advice and/or an offer of and/or solicitation for any transactions in financial instruments and/or a guarantee and/or prediction of future performance. ForexTime (FXTM), its affiliates, agents, directors, officers or employees do not guarantee the accuracy, validity, timeliness or completeness, of any information or data made available and assume no liability as to any loss arising from any investment based on the same.


Forex-Time-LogoArticle by ForexTime

ForexTime Ltd (FXTM) is an award winning international online forex broker regulated by CySEC 185/12 www.forextime.com

DAX bulls fail to recapture 10,000 points – end of the bear market rally?

By Admiral Markets

Forex Calender

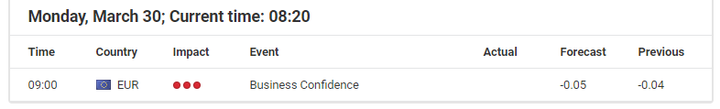
Source: Economic Events March 30, 2020 – Admiral Markets’ Forex Calendar

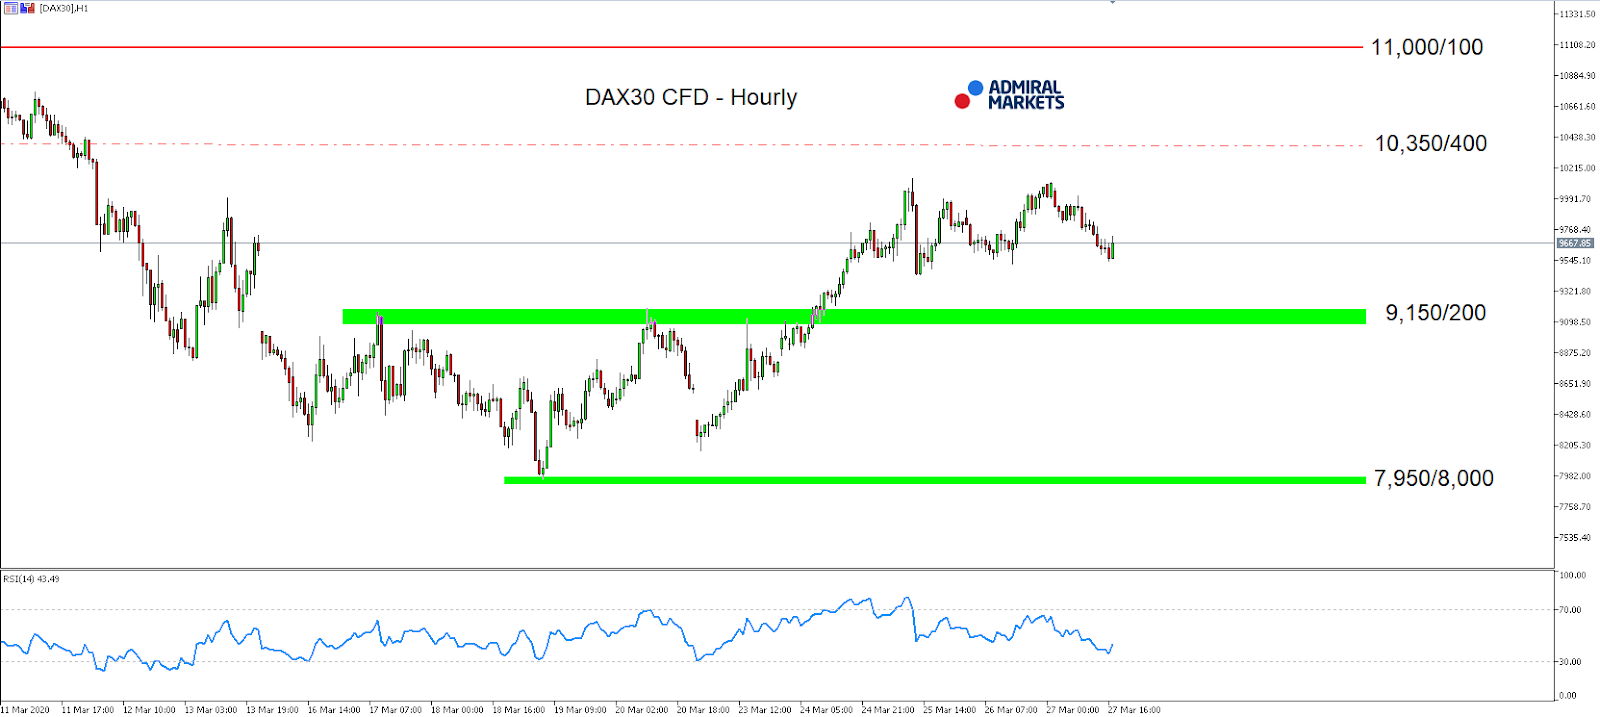
After the DAX30 CFD failed to recapture 10,000 points over the last week, and had a relatively weak weekly close, it appears that both its biggest daily gain in points (+959.42), and the third biggest last Tuesday with 10.98%, has been nothing more than a bear market rally.

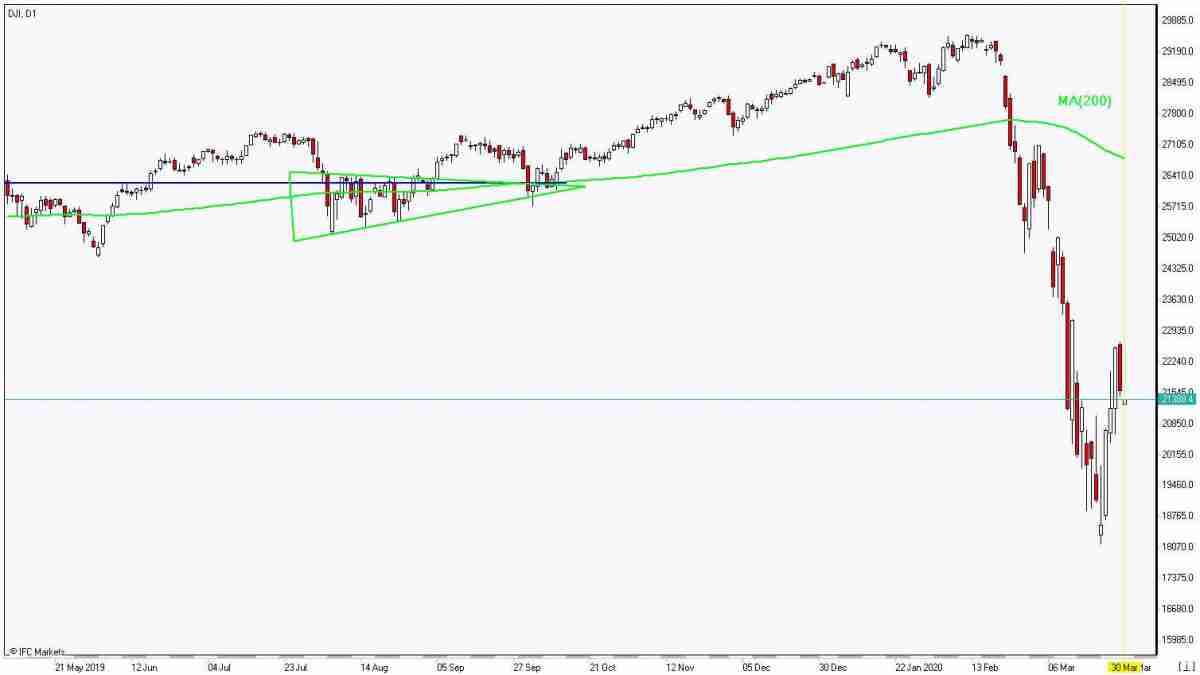
Bear market rallies everywhere have been just as sharp as what we saw over the last week. In US Equity markets, the Dow Jones extended its surge to 21% in three days by Thursday, bringing it back into bull market territory, but is only relevant from a “technical” standpoint.

Overall, we stay bearish with a potential trigger of a next leg down being potentially coming from the developments around the Coronavirus, particularly in the US, and if signs of an extended shutdown of the US economy intensify.

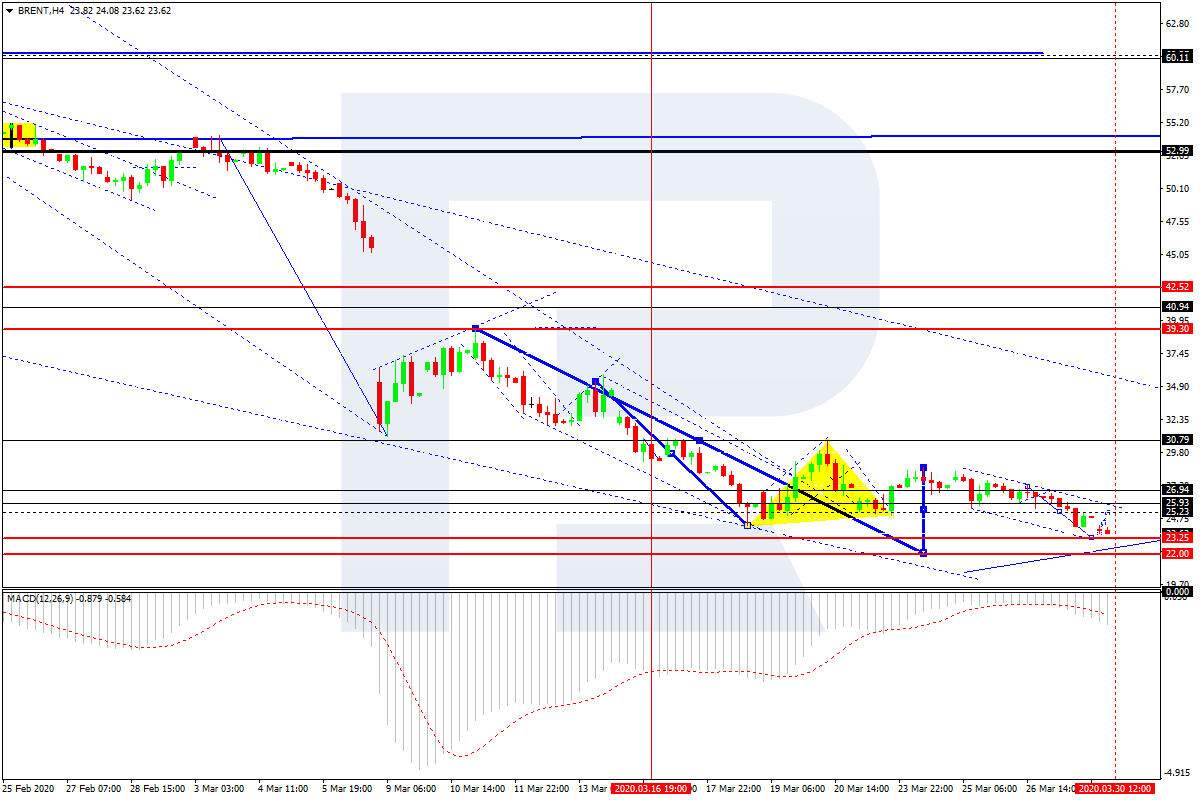
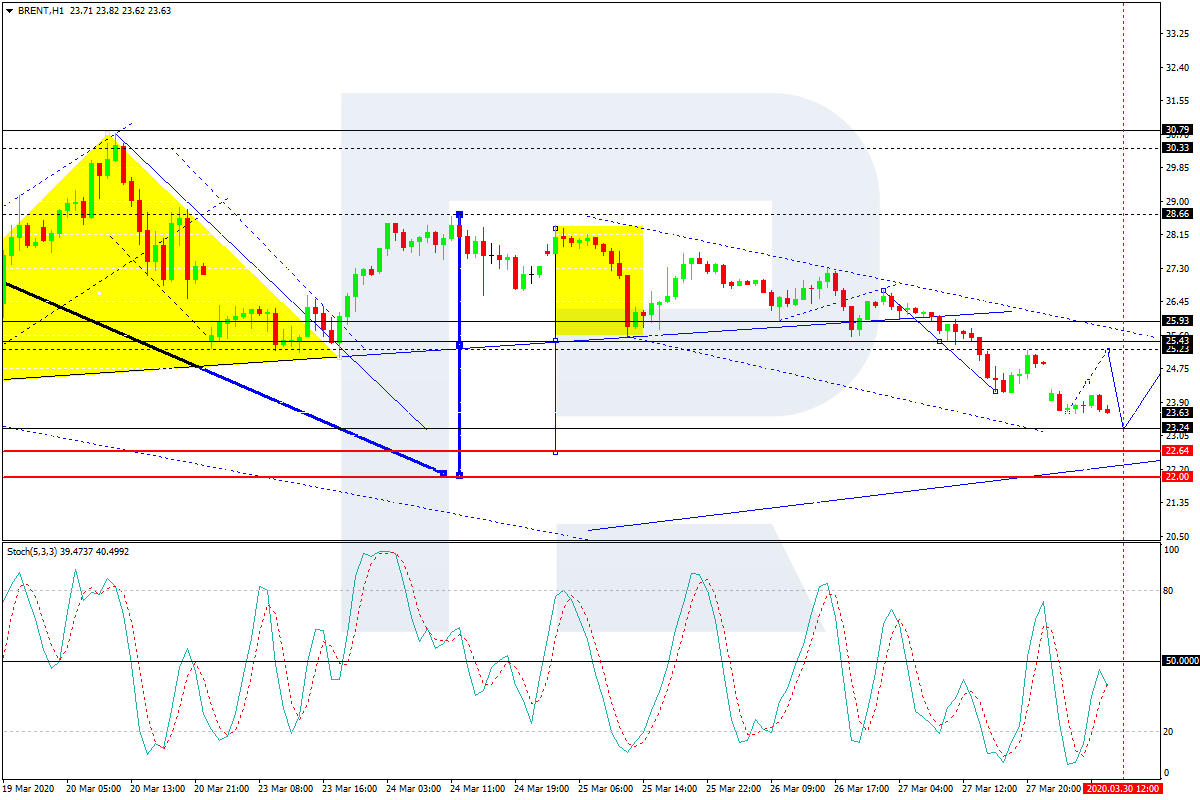
Technically, the main focus in the DAX30 CFD lies in the region around 9,150/200 points, where a sustainable break lower could trigger a next wave of selling down to 8,000 points and even lower in the days to come.

Above 9,150/200 points, another push up to and above 10,000 points stays on the table with a break above the pre-weekly highs around 10,150 points levelling the path to a deeper corrective move (still a bear market rally in the higher Daily time-frames) and bringing the mark around 11,000 points back into play.

Hourly chart

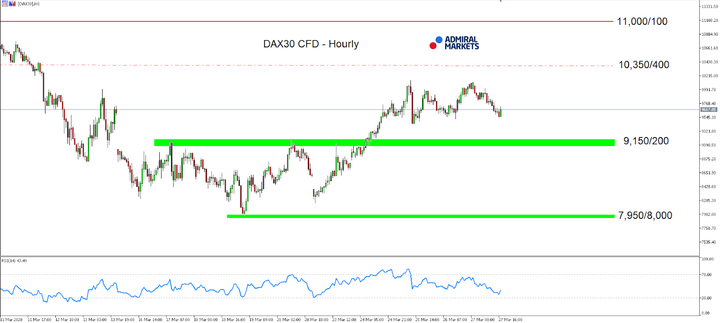
Source: Admiral Markets MT5 with MT5-SE Add-on DAX30 CFD Hourly chart (between March 11, 2020, to March 27, 2020). Accessed: March 27, 2020, at 10:00pm GMT

Daily chart

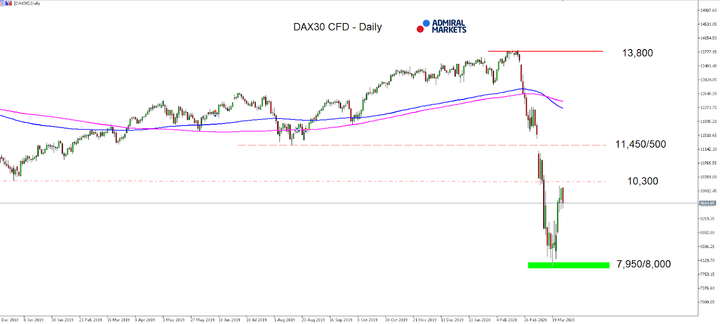
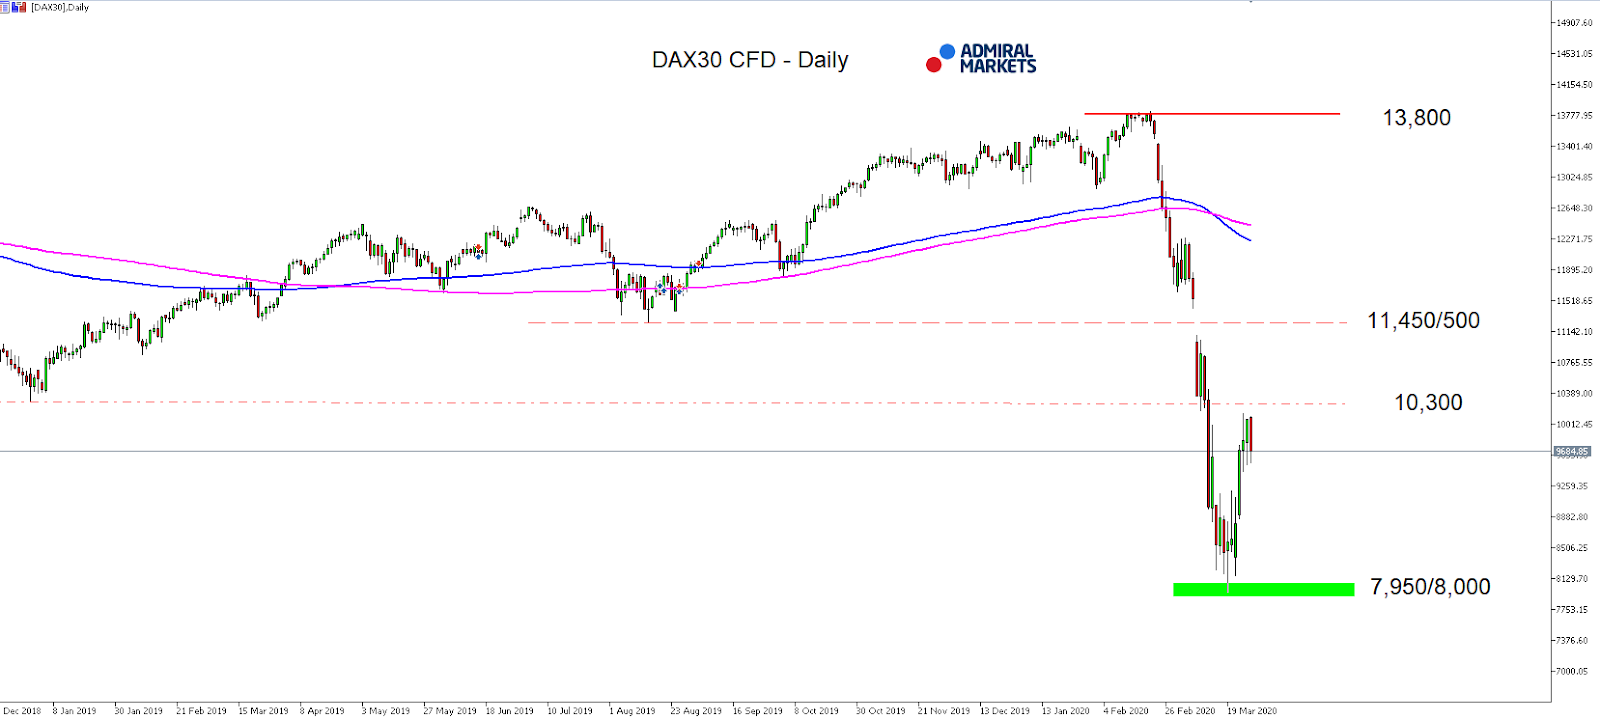
Source: Admiral Markets MT5 with MT5-SE Add-on DAX30 CFD Daily chart (between December 7, 2018, to March 27, 2020). Accessed: March 27, 2020, at 10:00pm GMT – Please note: Past performance is not a reliable indicator of future results, or future performance.

In 2015, the value of the DAX30 CFD increased by 9.56%, in 2016, it increased by 6.87%, in 2017, it increased by 12.51%, in 2018, it fell by 18.26%, in 2019, it increased by 26.44% meaning that after five years, it was up by 34.2%.

Discover the world’s #1 multi-asset platform

Admiral Markets offers professional traders the ability to trade with a custom, upgraded version of MetaTrader 5, allowing you to experience trading at a significantly higher, more rewarding level. Experience benefits such as the addition of the Market Heat Map, so you can compare various currency pairs to see which ones might be lucrative investments, access real-time trading data, and so much more. Click the banner below to start your FREE download of MT5 Supreme Edition!

Download MetaTrader 5 and begin trading today!

Disclaimer: The given data provides additional information regarding all analysis, estimates, prognosis, forecasts or other similar assessments or information (hereinafter “Analysis”) published on the website of Admiral Markets. Before making any investment decisions please pay close attention to the following:

  1. This is a marketing communication. The analysis is published for informative purposes only and are in no way to be construed as investment advice or recommendation. It has not been prepared in accordance with legal requirements designed to promote the independence of investment research, and that it is not subject to any prohibition on dealing ahead of the dissemination of investment research.
  2. Any investment decision is made by each client alone whereas Admiral Markets shall not be responsible for any loss or damage arising from any such decision, whether or not based on the Analysis.
  3. Each of the Analysis is prepared by an independent analyst (Jens Klatt, Professional Trader and Analyst, hereinafter “Author”) based on the Author’s personal estimations.
  4. To ensure that the interests of the clients would be protected and objectivity of the Analysis would not be damaged Admiral Markets has established relevant internal procedures for prevention and management of conflicts of interest.
  5. Whilst every reasonable effort is taken to ensure that all sources of the Analysis are reliable and that all information is presented, as much as possible, in an understandable, timely, precise and complete manner, Admiral Markets does not guarantee the accuracy or completeness of any information contained within the Analysis. The presented figures refer that refer to any past performance is not a reliable indicator of future results.
  6. The contents of the Analysis should not be construed as an express or implied promise, guarantee or implication by Admiral Markets that the client shall profit from the strategies therein or that losses in connection therewith may or shall be limited.
  7. Any kind of previous or modeled performance of financial instruments indicated within the Publication should not be construed as an express or implied promise, guarantee or implication by Admiral Markets for any future performance. The value of the financial instrument may both increase and decrease and the preservation of the asset value is not guaranteed.
  8. The projections included in the Analysis may be subject to additional fees, taxes or other charges, depending on the subject of the Publication. The price list applicable to the services provided by Admiral Markets is publicly available from the website of Admiral Markets.
  9. Leveraged products (including contracts for difference) are speculative in nature and may result in losses or profit. Before you start trading, you should make sure that you understand all the risks.

By Admiral Markets

Bears are Attacking Brent Again

By Dmitriy Gurkovskiy, Chief Analyst at RoboForex

Crude Oil prices are falling on Monday. The most serious bearish attack took place early in the morning during the Asian trading session when WTI broke 20 USD for the first time since 2002. A barrel of Brent is now trading at 23.52 USD.

Four correctional waves couldn’t help Brent fix above 30 USD. Obviously, market players are not sure about the future outlook: starting from April 1st, oil-producing countries, members of the OPEC+, will not be bound by any agreement to limit the daily output, which means that by the middle of April cheap oil from Saudi Arabia may flood the market and make crude oil prices plummet much lower.

In addition to that, even if the capacity utilization rate of the Chinese industry reaches 98%, no one can be sure that the demand for energy commodities will be more or less stable. This is a fundamental factor that drags oil prices down.

In the H4 chart, after breaking 25.25 to the downside, Brent may continue falling to reach 22.00. Later, the market may start another growth to test 25.25 from below and then form a new descending structure towards 21.50. Later, the market may resume trading upwards with the first target at 30.00. From the technical point of view, this scenario is confirmed by MACD Oscillator: its signal line is moving below 0 inside the histogram area, thus indicating further decline on the price chart.

As we can see in the H1 chart, Brent has broken 24.00 downwards; right now, it is still falling with the short-term downside target at 23.23. After reaching this level, the pair may correct towards 25.25, at least, and then resume trading inside the downtrend to reach the target from the H1 chart at 22.00. From the technical point of view, this scenario is confirmed by Stochastic Oscillator: its signal line is moving below 50. Later, the line may fall to break 20 and then resume moving upwards, thus indicating a correction on the price chart.

Disclaimer

Any predictions contained herein are based on the authors’ particular opinion. This analysis shall not be treated as trading advice. RoboForex shall not be held liable for the results of the trades arising from relying upon trading recommendations and reviews contained herein.

Israel cuts reserve requirement to ensure flow of credit

By CentralBankNews.info

Israel’s central bank, one of the few central banks to have kept interest rates steady this year, lowered its capital requirement for regulatory purposes by 1 percentage point “to ensure the banks’ ability to continue offering credit” during the coronavirus crises.
The Bank of Israel (BOI), which has kept its key rate steady since raising it in November 2018, said its banking supervision department lowered the requirement for large banks to maintain a minimum Common Equity Tier 1 (CET1) ratio of 9 percent from 10 percent and to 8 percent from 9 percent for midsized and small banks.
Israel’s banks entered the coronavirus crises in a strong position, BOI said, adding they have large capital surpluses, strong liquidity ratios and high-quality credit portfolios.

     “Since the outbreak of the crises, demand for credit has increased sharply, and the risk level in credit provision has increased in parallel in view of the impact to the to the financial state of businesses and households,” BOI said, adding it expects to use the capital that has been released to increase credit to businesses and households.

Given their central role in societies, banks have always been required to hold certain amounts of capital to absorb unexpected losses. Years ago, capital meant gold or silver but today it comprises a many forms of stock or equity invested by its owners and shareholders, government and private securities and loans that generate interest.
The requirements and methods of measuring capital has changed over the decades, with the most recent changes following the global financial crises. Banking regulators worldwide, grouped under the Basel Committee, tightened the requirements significantly to ensure banks would remain financially sound even during an economic or financial crises.
CET1 is the most basic form of liquid assets that a bank can hold, such cash and stock.
Another measure of reserve requirements is based on deposits at a bank. BOI has for many years set a 6 percent reserve requirement against demand deposits but the bank’s statement did not say whether this ratio was changed.
BOI said its decision to lower the capital requirement was in line with similar decisions in other countries and would be valid for six months and would be extended if necessary.
In response to the crises, central banks worldwide have been slashing both reserve requirements and countercyclical capital buffers.
The buffer was created after the global financial crises to ensure banks raise their capital during economic booms as an anti-cyclical measure so they can draw it down during a crises.
BOI said the today’s reduction of the capital requirement was based on the 2 percent capital buffer of each bank’s total risk assets, an excess demand that went beyond the Basel standards to protect the country’s banking system and the economy from unforeseen developments.
BOI also instructed boards at banks to “re-examine their dividend and share buyback policies,” in light of the material change in economic conditions, freeing up additional sources that can be used to provide credit and absorb losses, if necessary.
This is similar to a move by the Czech National Bank (CNB).
On March 16, when CNB cut its rate for the first of two times this month, it also cut the countercyclical capital buffer for its banks and said it expected banks to “refrain from a any dividend payouts or any other steps that might jeopardize individual bank’s resilience.”
BOI’s monetary policy committee is scheduled to meet on April 6. At its last meeting on Feb. 24, it maintained is key interest rate at 0.25 percent and confirmed its guidance that it expected to maintain the rate at this level for “a prolonged period.”
On March 15 the policy committee decided to carry out open market operations, offer repo transactions to financial institutions and purchase government bonds of various types and maturities “in necessary quantities” to ensure smooth functioning of the bond market.
On March 23 BOI then said it would purchase 50 billion shekel of government bonds in the secondary market to ease the volatility in bond yields from a lack of liquidity and lower the cost of longer-term credit for firms and households as a complement to its low interest rate policy.

www.CentralBankNews.info


The Week Ahead: Herd Immunity

By Orbex

EURAUD Struggles to Keep High Ground

The euro is facing strong headwinds as the block struggles to come up with a concerted rescue plan. Calls for joint bonds to finance coronavirus-related policies have met resistance from Berlin, which deems it too early to be effective.

This week’s German inflation, jobs, and manufacturing data may shed some light on the extent of the adversity. Negative readings could add pressure on the single currency, though there could be a silver lining in the form of an EU-wide package sooner than later.

The euro is making a pullback towards the 30-day moving average (1.7600), where trend-followers are likely to add positions.

GBPCAD Rallies Amid Improved Sentiment

The pound sterling extended its rally across the board after the Bank of England steadied the ship in its latest policy meeting. The central bank kept interest rates unchanged at 0.1% after two emergency cuts earlier this month.

This came as a sign that the situation might soon come under control. Markets also found relief in the government’s fiscal stimulus after Finance Minister Rishi Sunak threw a lifeline to hard-hit businesses. The pound now has to test the 61.8% (1.7500) Fibonacci retracement level from the March sell-off.

USDJPY Meets Tough Resistance

The US dollar came to a halt as the world’s largest economy became the epicenter of the global pandemic. Economic repercussions can already be felt across the country. Last week’s jobless claims surged to record 3.3 million and investors fret that the worst is yet to come.

In the meantime, central banks’ efforts to boost the supply of dollars have eased the liquidity squeeze. This means that the greenback could see more downside in the coming days. The pair stopped short of the key resistance of 112.00. The 50% (106.50) Fibonacci retracement level is the immediate support in sight.

NZDUSD recovers as markets stabilize

The New Zealand dollar rallies as investor appetite for ‘risk-on’ assets makes a comeback. Unswerving commitment from major central banks has helped lift liquidity and keep sentiment afloat.

With China gradually going back to work, there is some kind of consolation across developed markets. Nevertheless, grim economic news still lags behind and policies will need time to have effects on the real economy.

This makes one wonder how sustainable the latest rally can be. The kiwi could face increasing selling pressure and the bearish trend line (0.6200) is the major level to cap its advance.

By Orbex

Recession fears to keep Dollar supported, Oil depressed

By Han Tan, Market Analyst, ForexTime

The Dollar index (DXY) is halting its slump, after registering losses in six consecutive daily sessions to now test the 98.35 support level. With the Dollar-funding crunch easing, given that the Federal Reserve has worked with other central banks to improve the global financial markets’ access to the Greenback, the DXY’s declines appear to have fizzled out.

Demand for King Dollar should remain elevated, as the global economy enters a recession due to the Covid-19 pandemic. This suggests that the easy gains enjoyed by other currencies vs. the USD over recent sessions may have run their course. The US non-farm payrolls due this Friday, along with other global economic indicators to be released this week, will be used by investors to ascertain the potential severity of the economic contraction.


OPEC+ could flood markets on April 1

Brent prices began the week by sliding below the $27/bbl psychological level, while Crude is testing the $22/bbl mark and is trading around its lowest levels in 17 years. Global markets risk being flooded with cheap Oil supply on Wednesday, April 1, after OPEC+ producers are released from their existing supply cuts deal. The quarantine measures across major economies have resulted in an unprecedented plummet in demand, and the global recession should snuff out hopes of a swift recovery in the markets, barring any supply-side interventions by major producers.


Disclaimer: The content in this article comprises personal opinions and should not be construed as containing personal and/or other investment advice and/or an offer of and/or solicitation for any transactions in financial instruments and/or a guarantee and/or prediction of future performance. ForexTime (FXTM), its affiliates, agents, directors, officers or employees do not guarantee the accuracy, validity, timeliness or completeness, of any information or data made available and assume no liability as to any loss arising from any investment based on the same.


Forex-Time-LogoArticle by ForexTime

ForexTime Ltd (FXTM) is an award winning international online forex broker regulated by CySEC 185/12 www.forextime.com

Futures down while Trump extends social distancing to April 30

By IFCMarkets

US stocks end week higher as House approves second bailout package

US stock market ended sharply lower on Friday despite approval by the House of Representatives of a second bailout package exceeding $2 trillion. The S&P 500 fell 3.4% to 2541.47, erasing most of previous week’s 15% loss as it booked a 10.3% weekly gain. Dow Jones industrial dropped 4.1% to 21636.78. The Nasdaq ended 3.8% lower at 7502.38. The dollar weakening slowed as consumer spending increased an expected 0.2% in February. The live dollar index data show the ICE US Dollar index, a measure of the dollar’s strength against a basket of six rival currencies, lost 1.1% to 98.29 but is higher currently. President Trump on Sunday extended the voluntary national social-distancing guidelines through April 30. Futures point to lower market openings today.

DJI rebounds below MA(200) 3/30/2020 Market Overview IFC Markets chart

FTSE 100 led European stock indexes pullback

European stocks pulled back on Friday. EUR/USD reversed its climbing while GBP/USD added to its gains on Friday with both pairs lower currently. The Stoxx Europe 600 Index lost 3.2% led by autos and travel/leisure shares. The DAX 30 slid 3.7% to 9632.52 Friday. France’s CAC 40 dropped 4.2% and UK’s FTSE 100 tumbled 5.5% to 5510.33.

Australia’s All Ordinaries Index jumps while Asian indexes fall

Asian stock indices are mostly lower today. Nikkei lost 1.6% to 19084.97 despite resumed yen slideing against the dollar. China’s markets are falling: the Shanghai Composite Index is down 0.9% while Hong Kong’s Hang Seng Index is 1.5% lower. Australia’s All Ordinaries Index however jumped 7% as Australian dollar resumed its sliding against the greenback, and the government announced an additional A$1.1 billion ($680 million) will be spent on health and law services (besides earlier measures which equaled to about 10% of Australia’s annual gross domestic product) and decreed a moratorium on evictions of people from their rentals in the next six months.

Brent accelerates declines

Brent futures prices accelerated their plunge today following a 7.6% drop last week. Prices fell on Friday despite Baker Hughes report the number of active US rigs drilling for oil dropped by 40 to 624 last week. Brent for May settlement lost 5.4% to $24.93 a barrel Friday.

Gold rebound persists

Gold prices are inching higher today. Prices rose on Friday as dollar weakening continued. Gold for April delivery gained 1.6% to $1625 on Friday.

Market Analysis provided by IFCMarkets

Note:
This overview has an informative and tutorial character and is published for free. All the data, included in the overview, are received from public sources, recognized as more or less reliable. Moreover, there is no guarantee that the indicated information is full and precise. Overviews are not updated. The whole information in each overview, including opinion, indicators, charts and anything else, is provided only for familiarization purposes and is not financial advice or а recommendation. The whole text and its any part, as well as the charts cannot be considered as an offer to make a deal with any asset. IFC Markets and its employees under any circumstances are not liable for any action taken by someone else during or after reading the overview.