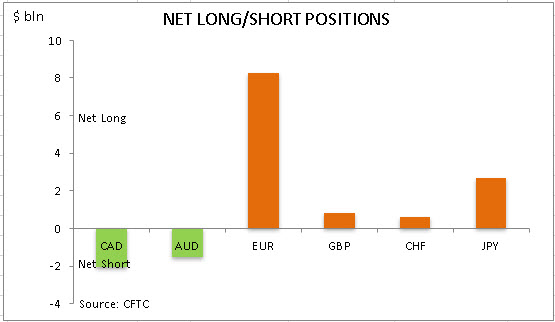
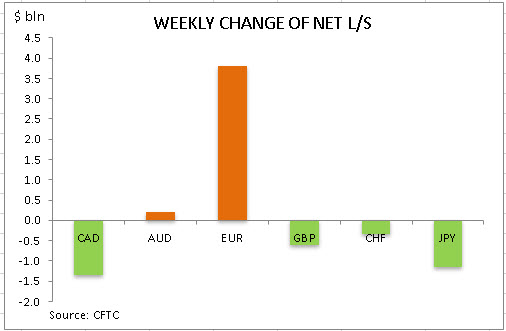
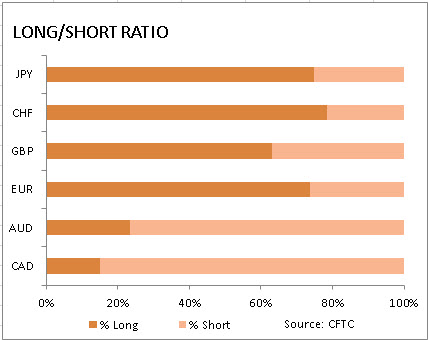
US dollar net short bets rose to $8.86 billion from $8.28 billion against the major currencies during the one week period, according to the report of the Commodity Futures Trading Commission (CFTC) covering data up to March 24 and released on Friday March 27. The change in overall dollar position was due to increase in bullish bets on euro while bullish bets on British Pound, Swiss franc and Japanese yen were cut. Australian and Canadian dollars maintained net short positions against the dollar. Bearish dollar bets rose as the Federal Reserve announced it would buy unlimited amount of Treasurys and mortgage-backed securities, and bolster emergency lending facilities. Before that the European Central Bank announced the start of a new stimulus program to buy bonds worth 1.1 trillion euros throughout this year.
Note: This overview has an informative and tutorial character and is published for free. All the data, included in the overview, are received from public sources, recognized as more or less reliable. Moreover, there is no guarantee that the indicated information is full and precise. Overviews are not updated. The whole information in each overview, including opinion, indicators, charts and anything else, is provided only for familiarization purposes and is not financial advice or а recommendation. The whole text and its any part, as well as the charts cannot be considered as an offer to make a deal with any asset. IFC Markets and its employees under any circumstances are not liable for any action taken by someone else during or after reading the overview.
Gold is struggling for direction after having its best week since 2008 as investors await new economic data to access the damage caused by the novel coronavirus outbreak.
The precious metal should remain confined in a narrow range until a fresh directional catalyst is brought into the picture. Should the Dollar regain footing on risk aversion and global recession fears, this may obstruct Gold’s upside potential. Looking at the technical picture, prices could jump higher towards $1675 if a solid daily close above $1630 is achieved. Alternatively, sustained weakness below may pave open the doors back towards $1600.
GBPUSD pushes back above 1.2450
A depreciating Dollar propelled the GBPUSD to a fresh two week high above 1.2450 last week.
Given how this move was heavily based around the Dollar’s valuation, the upside will be limited if the Greenback recovers in the week ahead. The fundamentals weighing heavily on the Pound remain intact and this should promote further weakness in the future.
Focusing on the technical picture, the GBPUSD is experiencing a technical rebound on the daily charts with prices trading around 1.2400 as of writing. A breakdown below the 50% Fibonacci level, could trigger a decline towards 1.2200 and 1.2050.
Dollar enters the week with a smile
The mighty Dollar entered the week with a spring in its step as risk aversion sent investors rushing towards the world’s most liquid currency.
Appetite towards the Greenback should remain supported by coronavirus fears and global recession fears. Expect the currency to push higher ahead of the US jobs report on Friday which could spark volatility across financial markets.
In regards to the technical picture, the Dollar Index is experiencing a rebound on the daily charts. A solid daily close above 99.00 could trigger a move towards 99.90. If 99.00 proves to be strong resistance, prices could decline back towards 98.40.
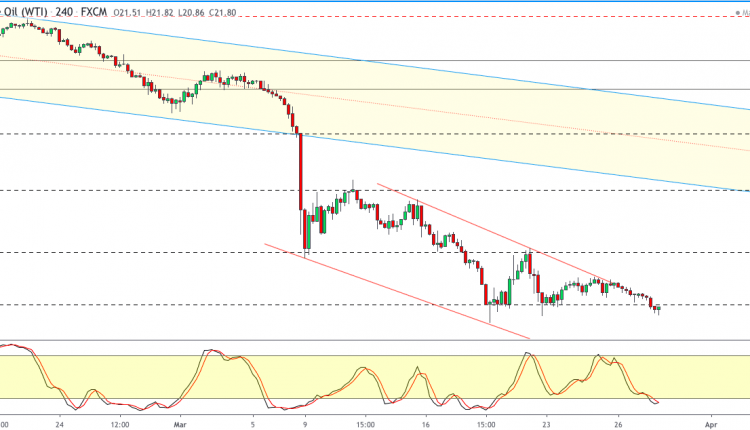
At this point in time, it is difficult to predict any floor on Oil with further downside expected if the supply and demand dynamic do not change.
Focusing on the technical, a picture is worth one thousand words. Is WTI Crude approaching $15 on the monthly timeframe? Time will tell.
Disclaimer: The content in this article comprises personal opinions and should not be construed as containing personal and/or other investment advice and/or an offer of and/or solicitation for any transactions in financial instruments and/or a guarantee and/or prediction of future performance. ForexTime (FXTM), its affiliates, agents, directors, officers or employees do not guarantee the accuracy, validity, timeliness or completeness, of any information or data made available and assume no liability as to any loss arising from any investment based on the same.
The state of Côte d’Ivoire is located in West Africa and is the world’s largest cocoa producer with a market share of 35%. Cocoa deliveries to the ports of Côte d’Ivoire in the agricultural season 2019/20 from October 1 to March 22 decreased by 1.2% compared to the same period of the previous season and amounted to 1,623 million tons. Let us note that since the beginning of February, cocoa has fallen in price by 13%, as chocolate producers were afraid of a reduction in demand for their products amid the coronavirus epidemic. Nestle, the world’s largest producer of confectionery products, announced that it will exclude from its purchases cocoa beans grown in protected forests in West Africa. Previously, the Western companies Ferrero, Lindt, Mondelez, Olam and Cargill committed themselves to the Cocoa and Forests initiative (CFI) program. Theoretically, this may contribute to the seizure of part of illegal cocoa beans from the world market.
The outbreak of coronavirus this year has had a devastating impact across the globe, inflicting severe human and economic damage.
In China, the place where the virus originated, the economic situation is drawing great attention and concern.
China suffered the first economic hit from the virus as its government rushed to address the situation by announcing widespread shutdowns and travel restrictions in order to stop the spread of the virus.
Chinese Economic Indicators Plummeting
With factories and offices around the country closed for weeks, the economic toll became clear in the first economic data released for February.
The manufacturing sector fell to its lowest level on record over February as a result of the drop-in activity. The industrial output reading highlighted weakness too, falling 13.5% over January and February.
The economic toll of COVID-19 in China has been widespread. Retail sales have fallen 20.5% across the first two months of the year. Fixed asset investment has also fallen by 24.5% over the first two months of the year. Services production has also suffered, falling 13% over January and February.
The overall performance of the Chinese economy, or rather underperformance, is now a major source of concern. With a nominal GDP of $14.14 trillion, China is the second-largest economy in the world, behind America only.
Furthermore, measured on a purchasing power parity basis, it is the largest economy with a GDP of $27.31 trillion. As of last year, China contributed nearly 17% to the global economy.
Fitch Predicts China GDP Slump
With these figures in mind, expectations of a severe drop in Chinese GDP pose a serious threat to the health of the global economy.
Rating agency Fitch estimates that China will suffer a 4% fall in GDP over Q1. Chinese GDP was already weak coming into Q1 on the back of the two-year-long trade war between itself and the US which saw GDP falling to 6.1% in the final quarter of 2019, its lowest level for 30 years.
Incoming Chinese data will now draw much more trader focus and pose a much greater risk of volatility. Signs of further weakness are likely to weigh heavily on risk sentiment and also put further pressure on President Trump to roll back many of the tariffs and restrictions which are still in place on as much as $375 billion of Chinese goods entering the US annually.
Shanghai Composite Holds Above Key Support Level
The Shanghai Composite has fallen 15% over the year (highs to lows) but has found demand just ahead of the 2634.42 support level. For now, price remains within a broader descending triangle pattern, which keeps the bias bearish for now. If price breaks down below the 2634.42 level, the 2442.82 level is the next support level to watch.
– The novel coronavirus is exploding in the US and Europe, due to complacency and inadequate preparedness. The escalation will translate to debt explosion, which will further complicate and prolong the fight against the virus globally.
As the COVID-19 challenge moved from imported cases to local transmissions, I warned in the briefing of March 9 that the rise of local transmissions was a game-changer in the coronavirus escalation. Here’s what I projected then:
“Even though many observers expected virus challenges to ease toward April, the acceleration of new cases outside China is only beginning and likely grossly under-reported. The number of confirmed cases worldwide is set to climb in the future – even faster as tests are broadened in major affected countries.”
So, what has actually happened in the past three weeks?
Explosion of new virus cases in the US and Europe
On January 9, the few known cases were in Wuhan. On February 9, the number of cases exceeded 40,000, most of them were in China. During the subsequent critical month, when China contained the virus, major countries outside China – especially North America and Europe – failed to mobilize against the virus.
The net effect? On March 9, there were almost 315,000 cases, but most of them outside China. And if these cases continue to soar by 40,000-60,000 daily – nearly 4-6 times faster than 1-2 weeks ago, then by April 9 they could exceed 1.3 million. If the acceleration still intensifies, that figure will be even higher. If it decelerates, it will be lower (Figure).
Figure“Current acceleration” scenario (through April 9, 2020)
Source: Difference Group; data from WHO
In the worst phase of the Chinese outbreak, the comparable acceleration was barely 4,000; that is, less than 7% (!) of the current acceleration.
Over time, this acceleration may translate to huge collateral damage not just in North America and Europe, but particularly in emerging and developing economies of the Middle East, Latin America, Asia and Africa – through plunges in world finance, trade, investment, and migration.
Explosion of new sovereign debt
The early economic defense has been by the major central banks to cut down the rates, inject liquidity and re-start major asset purchases. But as the post-2008 decade has shown, monetary responses cannot resolve fiscal challenges.
The early damage has focused on a set of key sectors, such as healthcare, transportation, retail, tourism, among others. As a result, ultra-low rates, liquidity injections and asset purchases will be coupled with targeted fiscal stimuli in affected economies. Yet, current measures to restrict the infection and economic damage will contribute to further debt erosion in major advanced and emerging economies.
Recently, the White House signed the $2 trillion coronavirus bill, the largest ever US stimulus. In the Trump era, US sovereign debt has increased record fast and now exceeds $23.5 trillion (107% of GDP). Thanks to the bill, it will soar faster than ever before. Yet, unemployment rates and business defaults could prove devastating.
In view of the US Federal Reserve, there is no reason for concern because it can support the economy. As the only central bank in the world, the Fed can print more dollars to reduce the severity and limit the duration of the coronavirus economic crisis. That will ease the US crisis in the short-term, while worsening the severity and extending the duration of the coronavirus contraction in the rest of the world.
In other words, we are back in the post-2008 territory, but now, after a decade of ultra-low rates, rounds of quantitative easing and liquidity injections, the situation is potentially much worse.
Before the virus, Washington’s debt burden was expected to increase to 110% of GDP, which the stimulus bill (9% of GDP) will dramatically increase – to a level where that ratio was in Italy during its sovereign debt crisis in the early 2010s.
In Italy, the level of sovereign debt is today significantly higher (135%) and in Japan outright alarming (240%). In Europe, the Maastricht Treaty deems that member states should not have excessive government debt (60%+ of GDP). Today, no major European economy fulfills that criteria.
Nevertheless, to overcome their short-term challenges, the major European countries will take more debt, which will further erode their debt to GDP ratios.
Multipolar cooperation to deter nightmare scenarios
In advanced economies, the coronavirus contraction has potential to wipe out much of the past decade’s recovery, which the US tariff wars have already undermined for two years. Meanwhile, developing countries, which have weaker healthcare systems, already suffer from financial and debt vulnerabilities and may not be able to withstand still another external shock.
Moreover, supply-side measures alone cannot resolve pandemic challenges. If containment measures fail, or subsequent mitigation proves inadequate, or new virus clusters emerge after containment and mitigation, markets will remain volatile and economies will suffer further damage, particularly with multiple waves of secondary infections after the current restrictive measures.
Worse, current virus scenarios are based on the assumption that the virus won’t return and won’t mutate. Yet, increasing numbers of cases could raise the probability of both scenarios.
What is needed to avoid further nightmare scenarios is multipolar cooperation among major economies and across political differences. President Xi Jinping’s call on Trump to cooperate against the virus is a good start – but far more is needed in the US and Europe to defuse the virus acceleration.
About the Author:
Dr. Dan Steinbock is an internationally recognized strategist of the multipolar world and the founder of Difference Group. He has served at the India, China and America Institute (USA), Shanghai Institutes for International Studies (China) and the EU Center (Singapore). For more, see https://www.differencegroup.net
Based on Dr Steinbock’s briefing of March 29, 2020.
This week – March 29 through April 4 – central banks from 6 countries or jurisdictions are scheduled to decide on monetary policy: Kyrgyz Republic, Lesotho, Chile, Bulgaria, Egypt and Romania.
Following table includes the name of the country, the date of the next policy decision, the current policy rate, the result of the last policy decision, the change in the policy rate year to date, and the rate one year ago.
The table is updated when the latest decisions are announced and can always accessed by clicking on This Week.
The British pound is in a strong rally as price action continues to close with daily gains over the last four days.
GBP is up nearly 7.80% from the 23rd March close of 1.1540. As price action increasingly looks bullish, it is possible that GBPUSD will be back near the 1.2858 handle.
Given that this level previously acted as support, the reversal off the 1.1540 lows will see this being retested for resistance.
It would also mark a complete recovery since GBPUSD broke below the support level of 1.2858 on 11th March 2020. Watch for support to emerge near 1.2277.
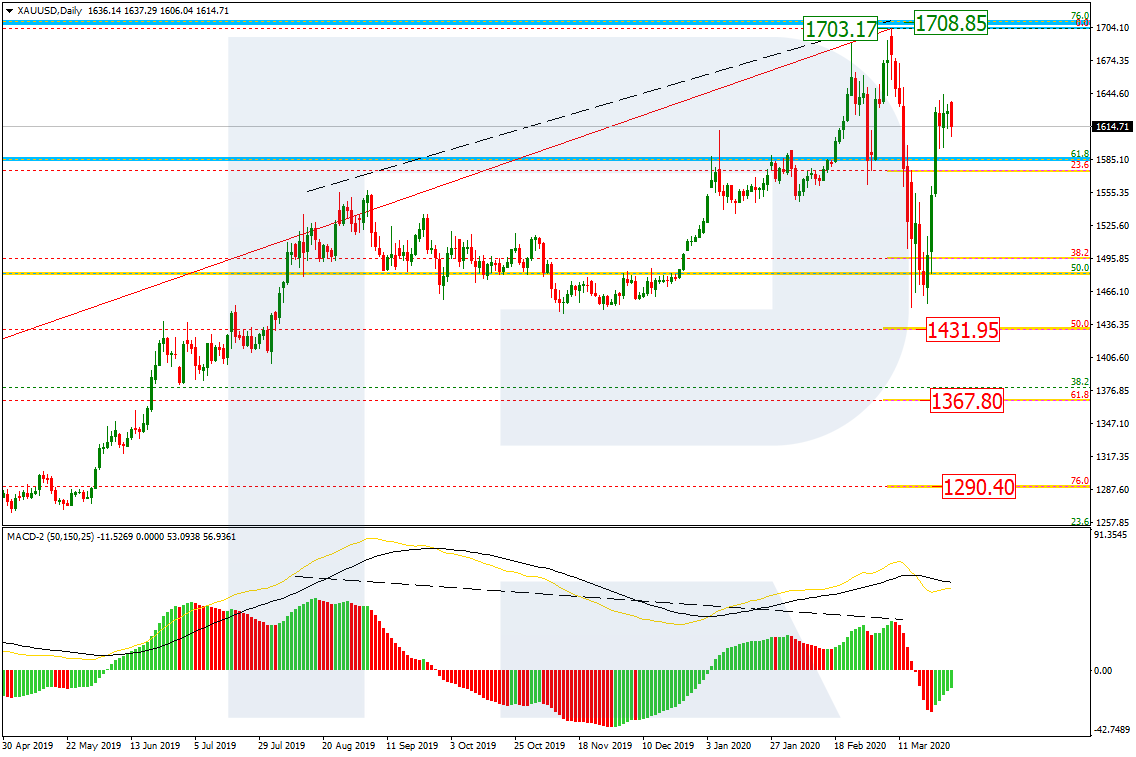
As we can see in the daily chart, after falling and reaching 38.2% fibo, the pair has returned to its highs. There is a strong possibility that the price may break the high at 1703.13 and reach 76.0% fibo at 1708.85 but the main scenario implies a new wave to the downside with the targets at 50.0% (1431.95), 61.8% (1367.80), and 76.0% (1290.40).
In the H1 chart, there is a local divergence, which may indicate a new descending wave soon. In this case, the downside targets may be 23.6%, 38.2%, and 50.0% fibo at 1598.53, 1571.25, and 1549.10 respectively. However, the key downside target is the low at 1451.18. The resistance is the high at 1643.07.
USDCHF, “US Dollar vs Swiss Franc”
In the daily chart, the rising impulse has corrected the previous descending wave by 61.8%. The descending wave may be considered a short-term pullback before a new wave to the upside, which may head towards 76.0% fibo at 0.9982 and the fractal high at 1.0236. The key pressure on the market is coming from 1.0344.
In the H1 chart, the convergence made the pair stop falling at 50.0%, Possibly, the pair may form one more descending impulse to reach 61.8% fibo at 0.9453. However, the main scenario implies a new rising wave towards the high at 0.9901.
Attention! Forecasts presented in this section only reflect the author’s private opinion and should not be considered as guidance for trading. RoboForex LP bears no responsibility for trading results based on trading recommendations described in these analytical reviews.