GBP Rallies Despite Fitch Credit Downgrade

By Orbex

UK Under Pressure

In the latest development to highlight the severity of the economic damage being caused by the ongoing coronavirus outbreak, rating agency Fitch has downgraded the UK’s credit rating from AA to AA-.

This is the latest in a series of downgrades from Fitch over recent years. It started in 2016 when the UK was downgraded to AA. This came following the unexpected Brexit referendum result. In February 2019, Fitch then put the UK on negative watch. This was due to the economic damage caused by Brexit uncertainty as negotiations stumbled on.

Fitch Was Concerned Before Coronavirus Crisis

Given the sharp repercussions from the coronavirus outbreak, the announcement by Fitch won’t come as too much of a surprise to many. What is interesting though are the reasons they include. Much of the commentary released with the decision refers to the damage from coronavirus. However, Fitch also highlights pre-coronavirus weaknesses in the UK economy as the main factors which fuelled a change in outlook.

Fitch noted that “timely and targeted” policies to counter the crisis were appropriate. Here they are referring to BOE rate cuts and QE. However, Fitch expressed concern over the UK government’s handling of the situation. He is referring specifically to the widening of the budget deficit. Fitch notes that it is not convinced that once the crisis passes, the government will be able to shrink the deficit and new debt accrued.

Trade Talks Creating Uncertainty

On the other hand, Fitch did note that some increases in investment spending could be beneficial for productivity and growth. Despite some positive signs, however, Fitch’s outlook was mostly bleak with the agency also noting the negative impact of trade deal uncertainty. With EU/UK trade talks side-lined while the UK and EU leaders combat the coronavirus crisis, there is a growing fear that the UK will walk away from talks at year-end without a deal being achieved. The UK PM is so far yet to change his position on his refusal to extend the deadline for the talks.

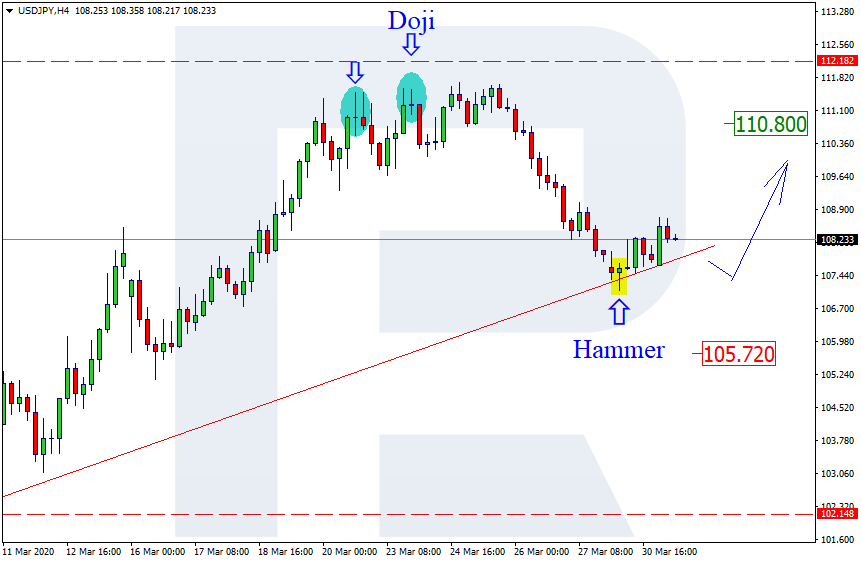
Despite news of the downgrade, GBP remains well supported this week. This comes following a strong rally last week in response to the BOE’s latest policy adjustment. With rates at record lows of 0.10% and with the BOE having approved £200 billion in QE, the sell-off in GBP has stalled for now.

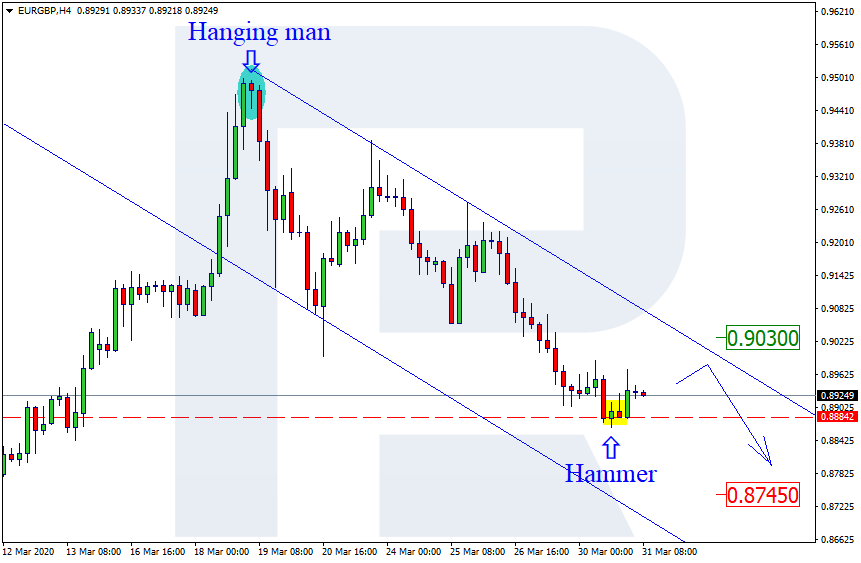
GBPUSD Bullish Reversal Risks

Looking at GBPUSD on the monthly chart we can see an interesting setup. Price has been moving in a large descending triangle over the last five years, underpinned by the 1.1929 support level. Following a break below this level earlier in the month, price has since reversed sharply and is now back above that level.

The RSI indicator has highlighted clear bullish divergence on the last two tests of that level. While price holds above the 1.1929 level, the downside move can be viewed as a false break. This is putting focus on the potential for a reversal higher in the medium-long term.

By Orbex


AUDUSD – Correction Continues Higher

By Orbex

– The bigger picture is the loss of 0.6705 base support and the plunge thereafter. The pair printed a low of 0.5510, losing almost 1,200 pips.

Currently, the pair is up on a bounce which is likely to continue this week.

The daily chart above highlights the break of support structures earlier. Now, it is on a corrective bounce. As with any correction, a retest to those levels is the likely scenario. The current momentum on the price action also indicates that we can have further run higher.

The 0.6300 handle comes in as an initial modest corrective target (marked with the blue line) on the run higher, as the level is congested with a bottom, a high, a close and an open on daily candles.

Once the price starts holding higher to it, we can look forward to better testing grounds to the 0.6410 region. A fuller correction can leap towards the 0.6660 zone test.

The 2-hour chart below provides a visual display of the current price action. Namely, we are within a bull channel (blue trendlines), but this could potentially turn out to be a bear flag.

The price is hovering at a very immediate resistance to 0.6215 with the channel top still residing a tad higher to 0.6250.

At present, pull-back towards the dotted mid-section support within this channel is probable, considering we see a halt to around 0.6215-20.

The main support lies around 0.5950-55, which is a must-hold for momentum to tick to the higher side. A break of this channel support would imply we were dealing with a bear flag.

An initial break of the 0.6220 will make way for a 0.6250-55 test. A successive break of the latter could increase bullish momentum further and could send prices to the 0.6300 handle. In case momentum remains at elevated levels, this move could even get us to 0.6410-20.

Momentum beyond 0.6420-30 would put focus on a full corrective target at or around the 0.6650-70 zone.

By Orbex


XAUUSD Consolidating After A Strong Recovery

By Orbex

Gold prices are trading rather flat on the day following last week’s gains.

Price action is trading near the ascending wedge pattern amid some choppy trading.

If XAUUSD fails to breakout above the previous highs of 1643, then we expect a move lower.

The initial support at 1594 will be the initial support of interest.

By Orbex


Ichimoku Cloud Analysis 31.03.2020 (BTCUSD, XAUUSD, AUDUSD)

Article By RoboForex.com

BTCUSD, “Bitcoin vs US Dollar”

BTCUSD is trading at 6372.00; the instrument is moving inside Ichimoku Cloud, thus indicating a sideways tendency. The markets could indicate that the price may test the cloud’s upside border at 6555.00 and then resume moving downwards to reach 4365.00. Another signal to confirm further descending movement is the price’s rebounding from the rising channel’s downside border. However, the scenario that implies further decline may be canceled if the price breaks the cloud’s upside border and fixes above 6955.00. In this case, the pair may continue growing towards 7805.00. After breaking the support area and fixing below 5665.00, the price may resume moving downwards and finish a Head & Shoulders pattern.

BITCOIN
Risk Warning: the result of previous trading operations do not guarantee the same results in the future

XAUUSD, “Gold vs US Dollar”

XAUUSD is trading at 1615.00; the instrument is moving above Ichimoku Cloud, thus indicating an ascending tendency. The markets could indicate that the price may test Tenkan-Sen and Kijun-Sen at 1605.00 and then resume moving upwards to reach 1715.00. Another signal to confirm further ascending movement is the price’s rebounding from the downside border of a Triangle pattern. However, the scenario that implies further growth may be canceled if the price breaks the cloud’s downside border and fixes below 1525.00. In this case, the pair may continue falling towards 1495.00.

GOLD
Risk Warning: the result of previous trading operations do not guarantee the same results in the future

AUDUSD, “Australian Dollar vs US Dollar”

AUDUSD is trading at 0.6206; the instrument is moving above Ichimoku Cloud, thus indicating a bullish tendency. The markets could indicate that the price may test Tenkan-Sen and Kijun-Sen at 0.6135 and then resume moving upwards to reach 0.6545. Another signal to confirm further ascending movement is the price’s rebounding from the rising channel’s downside border. However, the scenario that implies further growth may be canceled if the price breaks the cloud’s downside border and fixes below 0.5805. In this case, the pair may continue falling towards 0.5720.

AUDUSD

Article By RoboForex.com

Attention!
Forecasts presented in this section only reflect the author’s private opinion and should not be considered as guidance for trading. RoboForex LP bears no responsibility for trading results based on trading recommendations described in these analytical reviews.

GBPUSD Continues To Maintain A Bullish Position

By Orbex

The British pound is retracing some of the gains from Friday’s session. However, price action looks bullishly positioned.

There is scope for a decline to 1.2277 where support could be forming.

This will position the currency pair toward further gains to 1.2858.

In the event that price action slips below this level, then the declines will test the lower support at 1.1878.

By Orbex


Japanese Candlesticks Analysis 31.03.2020 (EURUSD, USDJPY, EURGBP)

Article By RoboForex.com

EURUSD, “Euro vs. US Dollar”

As we can see in the H4 chart, after returning to the rising channel’s downside border, EURUSD has formed a Harami reversal pattern there. At the moment, the pair is reversing. We may assume that later the price may correct to reach 1.0930 and then resume the ascending tendency. In this case, the upside target may be at 1.1320.

EURUSD
Risk Warning: the result of previous trading operations do not guarantee the same results in the future

USDJPY, “US Dollar vs. Japanese Yen”

As we can see in the H4 chart, USDJPY is still recovering after the fall. Right now, the pair is testing the support level, where it has formed several reversal patterns, such as Harami and Hammer. Possibly, the price may reverse and reach 110.80. The current situation implies that the instrument may yet resume falling towards 105.72 but this scenario is rather unlikely.

USDJPY
Risk Warning: the result of previous trading operations do not guarantee the same results in the future

EURGBP, “Euro vs. Great Britain Pound”

As we can see in the H4 chart, after reaching the support level, EURGBP has formed a Hammer reversal pattern there. At the moment, the pair started reversing. We may assume that later the market may rebound towards 0.9300 and continue the descending tendency. However, one shouldn’t exclude an opposite scenario, which implies that the instrument may continue falling towards 0.9030 without any pullbacks. In this case, the target may be at 0.8745.

EURGBP

Article By RoboForex.com

Attention!
Forecasts presented in this section only reflect the author’s private opinion and should not be considered as guidance for trading. RoboForex LP bears no responsibility for trading results based on trading recommendations described in these analytical reviews.

WTI Crude Oil Slips To Fresh Lows

By Orbex

Oil prices are down over 6% on the day as price broke past the previous support of 22.00.

On an intraday basis, oil prices fell to lows of 19.85 before pulling back modestly.

The breached support area of 22.00 will now turn to resistance if price fails to breakout above the level.

This will open the downside bias with further declines likely. In the event that oil pulls above the 22.00 handle then we could see some short term correction.

By Orbex


The Analytical Overview of the Main Currency Pairs on 2020.03.31

by JustForex

The EUR/USD currency pair

Technical indicators of the currency pair:
  • Prev Open: 1.11161
  • Open: 1.10430
  • % chg. over the last day: -0.80
  • Day’s range: 1.09847 – 1.10527
  • 52 wk range: 1.0777 – 1.1494

The EUR / USD currency pair stabilized after a significant rally last week. Quotes are currently being consolidated. The local support and resistance levels are 1.09750 and 1.10550, respectively. Investors continue to evaluate the impact of the coronavirus pandemic on the global economy. In the near future, technical correction of the trading instrument is not ruled out. We expect important reports today.

The Economic News Feed for 31.03.2020:

  • – Labour Market Report (GER) – 10:55 (GMT+3:00);
  • – Consumer Price Index (EU) – 12:00 (GMT+3:00);
  • – Consumer Confidence Index (US) – 17:00 (GMT+3:00);
EUR/USD

Indicators do not give accurate signals: the price has fixed between 50 MA and 100 MA.

The MACD histogram has moved into the negative zone, which indicates a possible correction of the EUR/USD currency pair.

The Stochastic Oscillator is in the neutral zone, the %K line is below the %D line, which indicates a bearish sentiment.

Trading recommendations
  • Support levels: 1.09750, 1.08850, 1.08000
  • Resistance levels: 1.10550, 1.11450

If the price consolidates below 1.09750, expec the quotes to correct toward 1.09000.

Alternatively, they can rise toward 1.11200-1.11500.

The GBP/USD currency pair

Technical indicators of the currency pair:
  • Prev Open: 1.24262
  • Open: 1.23978
  • % chg. over the last day: -0.27
  • Day’s range: 1.22421 – 1.24051
  • 52 wk range: 1.1466 – 1.3516

An ambiguous technical picture has developed on the GBPUSD currency pair. Sterling is currently consolidating. GBP/USD quotes are testing a round level of 1.23000. The 1.24800 mark is a key resistance. Participants in financial markets expect additional drivers. In the near future, technical correction of the trading instrument is not ruled out. Open positions from key levels.

In the fourth quarter of 2019, UK GDP growth met market expectations and amounted to 1.1% (yoy).

GBP/USD

Indicators do not give accurate signals: the price crossed 50 MA.

The MACD histogram is near the 0 mark.

The Stochastic Oscillator is in the neutral zone, the %K line is below the %D line, which indicates a bearish sentiment.

Trading recommendations
  • Support levels: 1.23000, 1.21450, 1.20150
  • Resistance levels: 1.24800, 1.25500

If the price consolidates below the round level of 1.23000 expect a fall to 1.22000-1.21000.

Alternatively, the quotes could grow toward 1.25500-1.26000.

The USD/CAD currency pair

Technical indicators of the currency pair:
  • Prev Open: 1.40170
  • Open: 1.41624
  • % chg. over the last day: +0.87
  • Day’s range: 1.41496 – 1.42079
  • 52 wk range: 1.2949 – 1.4668

The USD / CAD currency pair has moved up. The trading tool has updated local highs. Pressure on CAD is caused by a significant collapse in the oil prices yesterday. At the moment, USD/CAD quotes are testing a round level of 1.42000. 1.41000 is already a mirror support. We do not exclude further growth of the USD/CAD currency pair. Open positions from key levels.

At 15:30 (GMT+3:00), Canada will release a GDP report.

USD/CAD

Indicators do not give accurate signals, the price fixed between 50 MA and 200 MA.

The MACD histogram is in the positive zone, which indicates an increase in the USD/CAD quotes.

The Stochastic Oscillator is in the neutral zone, the %K line crossed the %D line. There are no signals at the moment.

Trading recommendations
  • Support levels: 1.41000, 1.39900, 1.39250
  • Resistance levels: 1.42000, 1.42750, 1.43750

If the price consolidates above 1.42000, expect a rise to 1.42750-1.43500.

Alternatively, the quotes could descend toward 1.40500-1.39500.

The USD/JPY currency pair

Technical indicators of the currency pair:
  • Prev Open: 107.644
  • Open: 107.694
  • % chg. over the last day: +0.03
  • Day’s range: 107.692 – 108.714
  • 52 wk range: 101.19 – 112.41

USD/JPY quotes stabilized after a significant drop. At the moment, the trading instrument is in lateral movement. There is no defined trend. The local support and resistance levels are: 107.800 and 108.600, respectively. Demand for the currency of the safe haven is still at a high level. We do not exclude the further strengthening of the yen against the greenback. Open positions from key levels.

Positive reports on industrial production and retail sales in Japan were published during the Asian trading session.

USD/JPY

Indicators do not give accurate signals: the price has fixed between 50 MA and 100 MA.

The MACD histogram has moved into the positive zone, which indicates a possible correction of the USD/JPY currency pair.

The Stochastic Oscillator is in the neutral zone, the %K line crossed the %D line. There are no signals at the moment.

Trading recommendations
  • Support levels: 107.800, 107.150
  • Resistance levels: 108.600, 109.200, 110.000

If the price consolidates below 107.800, expect the quotes to drop toward 107.400-106.500.

Alternatively, the quotes could grow toward 109.000-109.500.

by JustForex

Euro Likely To Position For Further Gains

By Orbex

The euro currency slipped, losing more than 0.50% on the day. However, price is being supported off the lower median line.

If price follows through above the previous highs of the 1.1133 region, then we expect further gains above the 1.1200 psychological resistance.

Further gains are expected which could see a move toward the 1.1300 region.

Alternately, if price fails to breakout higher, then we anticipate a move lower. The declines could see a move toward the 1.0787 where support will be tested.

By Orbex


Currency Majors Have Become Stable

by JustForex

The greenback has recovered part of the losses relative to its main competitors. Yesterday, the dollar index (#DX) closed in the green zone (+0.76%). Currency majors are currently consolidating. Financial market participants continue to assess the impact of the COVID-19 pandemic on the global economy. According to the World Bank, the coronavirus pandemic will significantly slow down the growth of developing economies in East Asia and the Pacific.

The loonie remains under pressure after a significant collapse in oil prices during yesterday’s trading session. Demand for the “safe haven” currencies is still high. Investors expect a report on the US labor market for March, which will be published on Friday. Last week’s jobless claims data show how severely the coronavirus pandemic is affecting the US economy.

At the moment, the “black gold” prices are recovering after a sharp decline. Futures for the WTI crude oil are testing the $21.20 mark per barrel.

Market indicators

Major US stock indices continue to recover after a prolonged fall: #SPY (+3.25%), #DIA (+3.12%), #QQQ (+3.64%).

The 10-year US government bonds yield has moved away from multi-year lows. At the moment, the indicator is at the level of 0.70-0.71%.

The news feed on 2020.03.31:
  • – Report on the labor market in Germany at 10:55 (GMT+3:00);
  • – Eurozone’s consumer price index at 12:00 (GMT+3:00);
  • – Canada’s GDP data at 15:30 (GMT+3:00);
  • – CB consumer confidence index in the US at 17:00 (GMT+3:00).

by JustForex