Asian stocks are mixed while US futures are now lower, as investors struggle to justify recent gains amid the ominous global economic outlook. Still, equity markets have calmed down noticeably, with the VIX having declined by 35 percent since its March 16 peak, although it is still more than three times the average over the past five years. That said, investors must remain vigilant against another spike in volatility, as equity markets may be triggered into another sell-off on any signs that the Covid-19 crisis is worsening.
Considering the relatively elevated levels of safe-haven assets, it’s abundantly clear that investors remain cautious over the virus fallout. The Dollar index is not straying far from the psychologically-important 99 level, Gold is trading around the upper-$1500 range, while USDJPY is keeping to sub-108 levels for the time being. Risk sentiment appears to be in a holding pattern at present, awaiting the next major development in the coronavirus outbreak.
Markets cannot afford to ignore warning signs
President Trump’s warning to America to brace for a “very, very painful” two weeks, coupled with his administration’s estimate that as many as 240,000 Americans may lose their lives to Covid-19, is a stark reminder that the coronavirus-induced crisis is still raging in major economies. Although China’s PMI figures released this week mark a return to expansion, investors are still treating such data with caution as the gains in Chinese stocks are not echoed across the rest of Asia. As the saying goes, ‘one month does not make a trend’. With a global recession now being the overarching theme for the year, investors are expected to endure a bumpy ride before they can place firm hopes on the eventual recovery.
Stocks yet to find equilibrium amid expected earnings downgrades
The quest in finding that floor for stocks appears to still have some way to go, given that valuations remain relatively elevated compared to how corporate earnings typically fare amid a recession. Although the S&P 500’s P/E ratio has now moderated to its 50-year average of 17, it’s still higher than the reading of 10 that was registered after the Great Financial Crisis in 2009.
What remains of the stubborn optimism in equities will likely be tested when the next US earnings season gets under way in two weeks. A one-two punch of negative surprises in earnings and a still-rising death toll Stateside should eviscerate misplaced hopes that the recent monetary and fiscal support measures can immediately repair the economic damage left in the wake of the coronavirus.
Disclaimer: The content in this article comprises personal opinions and should not be construed as containing personal and/or other investment advice and/or an offer of and/or solicitation for any transactions in financial instruments and/or a guarantee and/or prediction of future performance. ForexTime (FXTM), its affiliates, agents, directors, officers or employees do not guarantee the accuracy, validity, timeliness or completeness, of any information or data made available and assume no liability as to any loss arising from any investment based on the same.
Shares of Abbott Laboratories opened 11% higher after the company reported that its ID NOW molecular point-of-care test to detect novel coronavirus will be available starting this week with plans to quickly ramp up production to deliver 50,000 tests per day.
Abbott Laboratories (ABT:NYSE)announced Friday that “the U.S. Food and Drug Administration has issued Emergency Use Authorization for the fastest available molecular point-of-care test for the detection of novel coronavirus (COVID-19), delivering positive results in as little as five minutes and negative results in 13 minutes.” The company advised that the test will run on its proprietary ID NOW platform and will be able to deliver very quick results in a complete range of healthcare provider locations including field emergency checkpoints, urgent care clinics, hospital emergency departments and doctors’ offices.
The firm noted that the ID NOW platform is small, lightweight and portable device that utilizes molecular technology to produce test results with high degrees of accuracy. The company indicated that the device is about the size of a toaster and only weighs about 6.6 pounds and added that its ID NOW platform is presently the most widely available molecular point-of-care testing platform in the U.S.
The company’s President and COO Robert B. Ford commented, “The COVID-19 pandemic will be fought on multiple fronts and a portable molecular test that offers results in minutes adds to the broad range of diagnostic solutions needed to combat this virus…With rapid testing on ID NOW, healthcare providers can perform molecular point-of-care testing outside the traditional four walls of a hospital in outbreak hotspots.”
The firm advised that it is working with the government to deploy tests to areas where they can have the greatest impact and it will be making ID NOW COVID-19 tests available this week to U.S. healthcare providers in urgent care settings where the majority of ID NOW instruments are currently in use.
The firm described its ID NOW molecular platform, which it first introduced in 2014, as “the leading molecular point-of-care platform for Influenza A & B, Strep A and RSV testing in the U.S.” The company stated that “the ID NOW COVID-19 test comes a week after the company launched its Abbott m2000 RealTime SARS-CoV-2 EUA test, which runs on the m2000 RealTime System located in hospital and reference labs around the world.” The company indicated that together for both platforms combined it expects to manufacture around 5 million tests per month.
Abbott is headquartered in Abbott Park, Ill., and is a global healthcare provider of diagnostics, medical devices, consumer nutritionals and branded generic medicines. The company employs more than 107,000 people and distributes its products to more than 160 countries.
Abbott Labs has a market capitalization of around $131.5 billion with approximately 1.763 million shares outstanding. ABT shares opened 11% higher today at $82.83 (+$8.27, +11.09%) over Friday’s $74.56 closing price. The stock has traded today on more than three times average volume between $78.47 and $84.40 per share and is currently trading at $80.33 (+$5.77, +7.74%).
Disclosure: 1) Stephen Hytha compiled this article for Streetwise Reports LLC and provides services to Streetwise Reports as an independent contractor. He or members of his household own securities of the following companies mentioned in the article: None. He or members of his household are paid by the following companies mentioned in this article: None. 2) The following companies mentioned in this article are billboard sponsors of Streetwise Reports: None. Click here for important disclosures about sponsor fees. 3) Comments and opinions expressed are those of the specific experts and not of Streetwise Reports or its officers. The information provided above is for informational purposes only and is not a recommendation to buy or sell any security. 4) The article does not constitute investment advice. Each reader is encouraged to consult with his or her individual financial professional and any action a reader takes as a result of information presented here is his or her own responsibility. By opening this page, each reader accepts and agrees to Streetwise Reports’ terms of use and full legal disclaimer. This article is not a solicitation for investment. Streetwise Reports does not render general or specific investment advice and the information on Streetwise Reports should not be considered a recommendation to buy or sell any security. Streetwise Reports does not endorse or recommend the business, products, services or securities of any company mentioned on Streetwise Reports. 5) From time to time, Streetwise Reports LLC and its directors, officers, employees or members of their families, as well as persons interviewed for articles and interviews on the site, may have a long or short position in securities mentioned. Directors, officers, employees or members of their immediate families are prohibited from making purchases and/or sales of those securities in the open market or otherwise from the time of the interview or the decision to write an article until three business days after the publication of the interview or article. The foregoing prohibition does not apply to articles that in substance only restate previously published company releases. 6) This article does not constitute medical advice. Officers, employees and contributors to Streetwise Reports are not licensed medical professionals. Readers should always contact their healthcare professionals for medical advice.
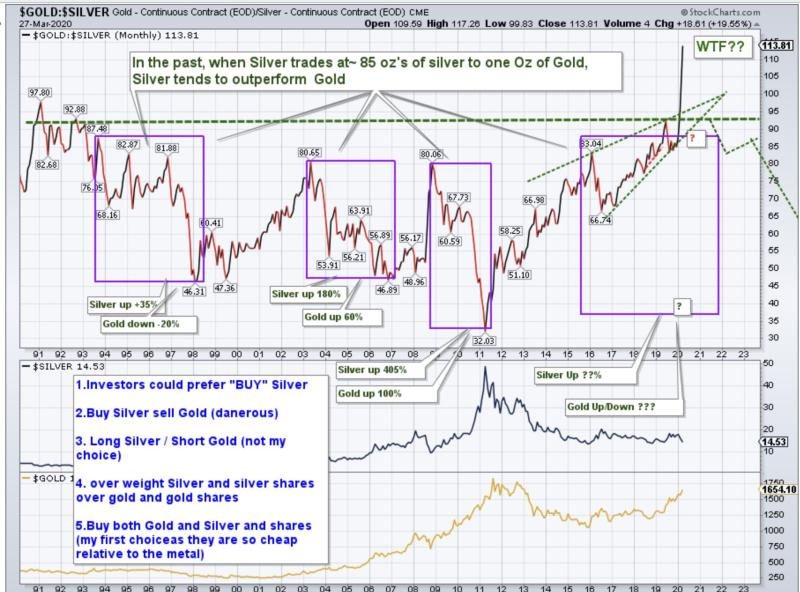
Technical analyst John Newell looks back at the gold to silver ratio through history.
When we don’t understand the present, we can turn to the past. It is believed the natural ratio in the earth’s crust is ~10 ounces of silver for one ounce of gold.
Back in 3000 BC in Mesopotamia (modern day Turkey, Iraq, Iran), silver and gold were used to enable trade at a rate of 5 ounces of silver to 1 ounce of gold. For about 2,000 years, from 1670 B.C. to 432 AD, the rate was between a low of 9 to 1 in 59-44 BC to a high of 18 to 1 in 422 AD.
For the next 1,000 years from 527 to1453, the price was roughly 15 to 1. For the next three centuries the ratio was a low of 10.75 to 1 to a high of 15.52 to 1.
When the United States passed its first coinage law in 1792, the ratio was fixed at 15 to 1 but at that rate gold was considered undervalued and disappeared from circulation, so to correct the situation Congress moved the ratio to 16 to 1 in 1834.
At that rate gold was slightly overvalued and silver undervalued and silver coins began to disappear and were dropped from the list of coins by the Act of February 12, 1873, or the “Crisis of 1873,” and so thereafter the U.S. was on the Gold Standard, which became law in the Gold Act of March 14, 1900. (Hint: two 60 year cycles to today).
In 1919 the ratio was 15.20 to 1; by 1932 the ratio was up to 72.27 to 1 or about five times.
John Newell is a portfolio manager at Fieldhouse Capital Management and president and CEO of Golden Sky Minerals Corp. He has 38 years of experience in the investment industry acting as an officer, director, portfolio manager and investment advisor with some of the largest investment firms in Canada. Newell is a specialist in precious metal equities and related commodities and is a registered portfolio manager in Canada (advising representative).
Disclosure: 1) Statements and opinions expressed are the opinions of John Newell and not of Streetwise Reports or its officers. John Newell is wholly responsible for the validity of the statements. Streetwise Reports was not involved in the content preparation. John Newell was not paid by Streetwise Reports LLC for this article. Streetwise Reports was not paid by the author to publish or syndicate this article. 2) This article does not constitute investment advice. Each reader is encouraged to consult with his or her individual financial professional and any action a reader takes as a result of information presented here is his or her own responsibility. By opening this page, each reader accepts and agrees to Streetwise Reports’ terms of use and full legal disclaimer. This article is not a solicitation for investment. Streetwise Reports does not render general or specific investment advice and the information on Streetwise Reports should not be considered a recommendation to buy or sell any security. Streetwise Reports does not endorse or recommend the business, products, services or securities of any company mentioned on Streetwise Reports. 3) From time to time, Streetwise Reports LLC and its directors, officers, employees or members of their families, as well as persons interviewed for articles and interviews on the site, may have a long or short position in securities mentioned. Directors, officers, employees or members of their immediate families are prohibited from making purchases and/or sales of those securities in the open market or otherwise from the time of the interview or the decision to write an article until three business days after the publication of the interview or article. The foregoing prohibition does not apply to articles that in substance only restate previously published company releases.
Additional Disclosures and Disclaimer from John Newell, Fieldhouse Capital Management
Legal Notice / Disclaimer:
This document is not and should not be construed as an offer to sell or the solicitation of an offer to purchase or subscribe for any investment.
John Newell has based this document on information obtained from sources he believes to be reliable, but which has not been independently verified.
John Newell makes no guarantee, representation or warranty and accepts no responsibility or liability as to its accuracy or completeness. Expressions of opinion are those of John Newell only and are subject to change without notice. John Newell assumes no warranty, liability or guarantee for the current relevance, correctness or completeness of any information provided within this Report and will not be held liable for the consequence of reliance upon any opinion or statement contained herein or any omission.
Furthermore, I, John Newell, assume no liability for any direct or indirect loss or damage or for lost profit, which you may incur because of the use and existence of the information provided within this Report.
It should not be assumed that the methods, techniques, or indicators presented in these pages will be profitable or that they will not result in losses. Past results are not necessarily indicative of future results. Examples presented on these pages are for educational purposes only. These set-ups are not solicitations of any order to buy or sell. The authors, the publisher, and all affiliates assume no responsibility for your trading results. There is a high degree of risk in trading. Hypothetical and historical performance results have many inherent limitations, some of which are described below. No representation is being made that any account will or is likely to achieve profits or losses similar to those shown. In fact, there are frequently sharp differences between hypothetical and historical performance results and the actual results subsequently achieved by any trading program. One of the limitations of hypothetical and historical performance results is that they are generally presented with the benefit of hindsight. In addition, hypothetical and historical trading may not present the financial risks and returns for future trading. For example, the ability to withstand losses or to adhere to a particular trading program in spite of trading losses are material points which can also adversely affect trading results. There are numerous other factors related to the markets in general or to the implementation of any specific trading program which cannot be fully accounted for in the preparation of hypothetical performance results and all which can adversely affect actual trading results. Disclaimer: This Publication is protected by Canadian and International Copyright laws. All rights reserved. No license is granted to the user except for the user’s personal use. No part of this publication or its contents may be copied, downloaded, stored in a retrieval system, further transmitted, or otherwise reproduced, stored, disseminated, transferred, or used, in any form or by any means without prior written permission. This publication is proprietary. Neither the information, nor any opinion expressed constitutes a solicitation for the purchase of an investment program.
Item: March 16, 2020. A huge poly-metallic (gold, silver, copper) mining operation in Mongolia “has suspended operations” after authorities “restricted the movement of goods and people within the country.”
Item: March 17. In Peru, one of the world’s largest primary silver-gold producers has its 4 mines “temporarily suspended” following the Government’s Declared State of Emergency.
Item: March 18. A Canadian mining major suspends construction of a $4.7b copper mine upgrade in Chile affecting 15,000 workers.
Item: March 20. Argentina declares a state of emergency and imposes “a nationwide mandatory quarantine starting today.” Silver and gold mines across the country move to halt operations, except for “a reduced workforce to ensure appropriate safety, security and environmental systems are maintained.”
Item: March 30. Peruvian authorities extend their halt of transportation until at least April 13.
This list could be much longer, but you get the idea. Miners and explorers around the world are being told to stop production, move to “care and maintenance” or “disperse the workforce” – all due to the C-Factor. Which of course refers to the rapidly – spreading global pandemic known as novel coronavirus, or COVID-19.
Being a new strain that has not been previously identified in humans, earns this virus the moniker of “novel.” Enough is still unknown about how it spreads and what it takes to halt the contagion, that even the experts still search for answers.
These unknowns – along with the government and public response to it – means this is slated to become the most costly financial crisis in modern history. Asset classes crater across the board, with mining shares diving alongside S&P 500 stalwarts.
What’s surprising to those who do not remember 2008 is initially both silver and gold tanked. In part it’s because when funds – some of whom are leveraged 30:1 – get a margin call, they sell what they can. That includes precious metals, further depressing the price.
The Paper Price Is Not the Physical Price
Beneath the surface, recent massive demand by the public for physical silver and gold makes it apparent that the quoted “paper metals” price bears little reality to what a person pays – if they can find the “hold in your hand” product at all.
An example: Although the COMEX shows roughly a $14/ounce paper silver price, physical metal – other than 1000 oz bars – is going for 30-80% over spot. In other words, this supposed $14 silver could cost you upwards of $20 the ounce. And, at some dealers, you should expect to pay as much as $2,000 or more for that $1,650 1-oz gold piece.
The U.S. Mint has nearly run out of American Silver Eagles (ASEs) and extended back orders are the norm. Premiums have risen from about $3 to $8 or even $10 over spot.
This Situation Is Novel in More Ways Than One
At this writing, most mines remain open. But the suspension-of-production list steadily grows.
It’s safe to say that operations in every country on the globe have been, or soon will be affected. Projected downtimes assume 2-3 weeks, but some places are expecting a 6-week-plus hiatus.
The reality is that no one really knows how long this state of affairs will last, let alone return to normal. Even when a mill temporarily shuts down, it’s not just a matter of flipping a switch and returning to full-scale production.
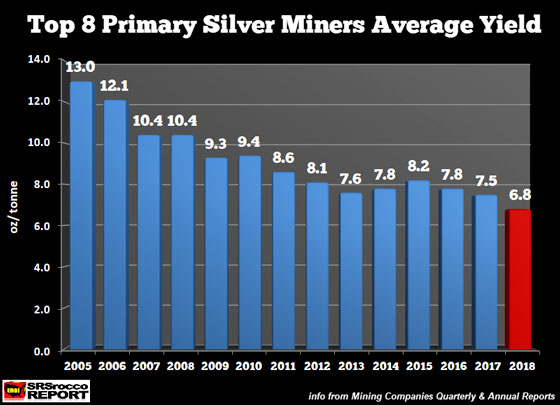
The metals, especially silver, may have seen their best production levels for some time. Yields have steadily declined for the last decade.
Fewer large discoveries, increased regulations, costly infrastructure and longer lead times, have conspired to just about double the number of years it takes from discovery to production.
Being an industrial metal, silver consumption will probably decline this year, but… as David Morgan has long noted, “Important price changes occur on the margin.” He means that investment demand is the big driver for silver prices. And lately, has that demand ever been robust!
Metals’ dealers report the strongest buying they’ve witnessed in recent years – some for as long as they’ve been in business. Selection is down, premiums are way up and delivery dates pushed out from days to somewhere on the horizon.
Silver Is Finding Important New Uses
Readers in this space are aware of the almost daily new uses for which silver is being employed in industry and commerce. Now there are two new ones – difficult to quantify initially, but unwise to ignore on the demand side.
An evolving silver-backed digital coin. First, is the build out of a new monetary vehicle called AGX Pay designed around a vaulted silver-backed digital coin, enabled by the blockchain.
Its ultimate level of acceptance is yet to be determined, but the coin’s numerous uses, including spending it for merchandise and services, or simply holding as an investment bet on rising silver, make this an intriguing consideration.
Silver is a COVID-19 Killer. Second, it appears that more locales are using decontaminants to disinfect city streets, public buildings, and airport terminals.
One effective and non-toxic solution of which I’m aware is made up of potassium iodide, water… and silver. How much silver? Hard to say right now, but as it becomes more widely used?
The Tectonic Plate Collision of High Demand and Declining Production Means That “Houston, We Have a Problem”
Few investors have considered that, as the ripple effect of mines shutting down spreads (if only for a few weeks but possibly much longer), 2020 gold, copper, and silver production are set to fall off a cliff.
Let’s say there is only a 4-week period between when most mines “go offline” and return to normal output. It’s possible that 10% or more annual silver production may not take place at all!
2020 was already set to become the fourth straight year of declining silver production. Last year, the total was about 1 billion ounces.
Ask yourself what’s going to happen if the demand spike runs up against say, 100 million ounces less silver than was available the year before?
I would suggest the result will include skyrocketing premiums, and an even greater disconnect between the paper quote and the actual physical sales price.
The Removal or Destruction of One-Tenth of Silver Production
My use of the word “decimate” in this article’s title was intentional. Derived from the Latin word “decimates,” it meant “the removal or destruction of one-tenth.”
Depending on how much the C-Factor impacts mining in 2020, the premise assuming “the destruction of one-tenth” of this year’s silver production could turn out to be conservative by half.
If for some inexplicable reason you’re still waiting to acquire the silver (or gold) you hope to purchase, the question right now is, “How lucky to you feel?”
The Money Metals News Service provides market news and crisp commentary for investors following the precious metals markets.
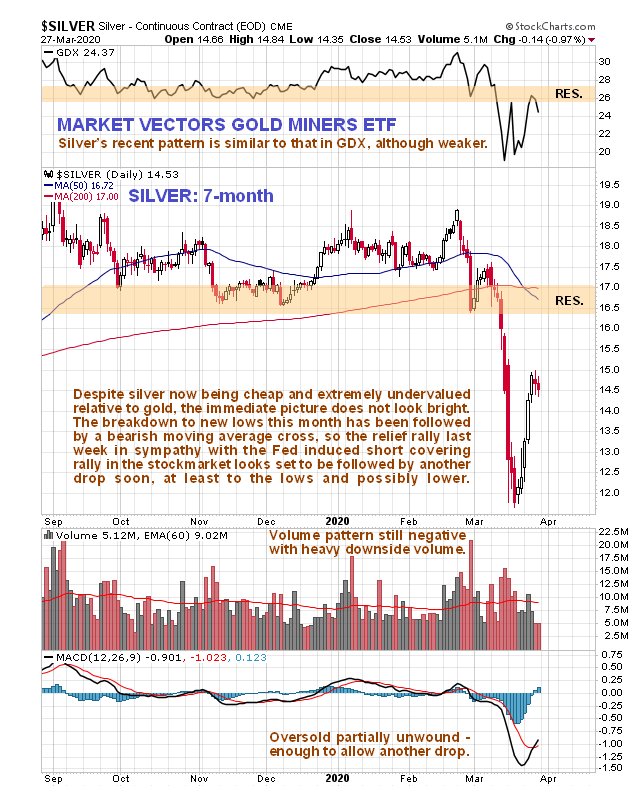
Whichever way you cut it, silver’s chart looks bearish for the short to medium term, but against this we must set its rapidly improving COT structure and the mega-bullish silver to gold ratio (by all past standards).
Silver’s 7-month chart is a rather grim picture. On it we see that key support failed this month, leading to a dramatic plunge to new lows, and this support has now become resistance. In addition we see that moving averages have swung into bearish alignment, with a bearish “death cross” having occurred about a week ago. The relief rally of the past week or so in sympathy with the relief rally in the broad stock market fueled by Fed intervention, that we predicted and played via leveraged silver ETFs and Calls, is therefore thought to be petering out and set to be followed by another probably steep selloff, congruent with another decline in the broad stock market, and a potentially heavy decline in the precious metals sector.
This month’s dramatic failure of key support at the lows was a hammer blow to investors in the sector and it’s easy to see why on the latest 11-year chart for silver. This support failure crashed multi-year lows dating back to early 2016, and aborted the potential giant Double Bottom pattern it is precisely the sort of development that would lead silver bugs to give up in disgust and disgorge their holdings in despair to Smart Money waiting patiently to scoop them up at rock bottom prices.
For as we can see on the latest silver COT chart, the faithful are giving up in droves and heading for the hills with the Large Specs’ holdings ebbing away steadily. With the shorter-term charts for silver pointing to further losses dead ahead, we can expect to see considerable further improvement in this COT structure which will finally set the stage for the expected humongous silver bull market.
Why humongous? here’s why: the silver to gold ratio has dropped to a record low by a wide margin this month, and is way below lows that in the past have been the precursor to major sector bull markets. This is why, after the stock market crash phase is done, and maybe even a little before, silver is expected to reverse to the upside in a spectacular manner and take off like a rocket, and there is a precedent for this behavior, for this is what happened near to the bottom of the 2008 market crash. The difference this time is that the situation is much more extreme and the upside potential much greater than it was back then. So we will be keeping a very close eye on silver going forward.
The conclusion is that silver looks set to drop hard over a short to medium-term time horizon with the broad stock market but in the larger scheme of things it is setting up for a massive and probably spectacular bull market that is likely to commence with a screaming rally when the time is right that will probably blow straight through the failed support, now resistance, shown on our 7-month chart . This should not come as a surprise when you consider what is set to be done and is already being done – to fiat currencies going forward.
Originally posted on clivemaund.com on March 29, 2020.
Clive Maund has been president of www.clivemaund.com, a successful resource sector website, since its inception in 2003. He has 30 years’ experience in technical analysis and has worked for banks, commodity brokers and stockbrokers in the City of London. He holds a Diploma in Technical Analysis from the UK Society of Technical Analysts.
Disclosure: 1) Statements and opinions expressed are the opinions of Clive Maund and not of Streetwise Reports or its officers. Clive Maund is wholly responsible for the validity of the statements. Streetwise Reports was not involved in any aspect of the article preparation. Clive Maund was not paid by Streetwise Reports LLC for this article. Streetwise Reports was not paid by the author to publish or syndicate this article. 2) This article does not constitute investment advice. Each reader is encouraged to consult with his or her individual financial professional and any action a reader takes as a result of information presented here is his or her own responsibility. By opening this page, each reader accepts and agrees to Streetwise Reports’ terms of use and full legal disclaimer. This article is not a solicitation for investment. Streetwise Reports does not render general or specific investment advice and the information on Streetwise Reports should not be considered a recommendation to buy or sell any security. Streetwise Reports does not endorse or recommend the business, products, services or securities of any company mentioned on Streetwise Reports. 3) From time to time, Streetwise Reports LLC and its directors, officers, employees or members of their families, as well as persons interviewed for articles and interviews on the site, may have a long or short position in securities mentioned. Directors, officers, employees or members of their immediate families are prohibited from making purchases and/or sales of those securities in the open market or otherwise from the time of the interview or the decision to write an article until three business days after the publication of the interview or article. The foregoing prohibition does not apply to articles that in substance only restate previously published company releases.
Charts provided by the author.
CliveMaund.com Disclosure: The above represents the opinion and analysis of Mr Maund, based on data available to him, at the time of writing. Mr. Maund’s opinions are his own, and are not a recommendation or an offer to buy or sell securities. Mr. Maund is an independent analyst who receives no compensation of any kind from any groups, individuals or corporations mentioned in his reports. As trading and investing in any financial markets may involve serious risk of loss, Mr. Maund recommends that you consult with a qualified investment advisor, one licensed by appropriate regulatory agencies in your legal jurisdiction and do your own due diligence and research when making any kind of a transaction with financial ramifications. Although a qualified and experienced stock market analyst, Clive Maund is not a Registered Securities Advisor. Therefore Mr. Maund’s opinions on the market and stocks can only be construed as a solicitation to buy and sell securities when they are subject to the prior approval and endorsement of a Registered Securities Advisor operating in accordance with the appropriate regulations in your area of jurisdiction.
The first quarter of 2020 will be remembered as one of the most volatile periods across financial markets since 2008 as chaos surrounding the coronavirus outbreak fostered panic, gloom and doom.
In the FX space there were many casualties of the virus pandemic but some currencies were able to shine through the market mayhem.
The biggest winner was the mighty Dollar which appreciated against every single G10 currency excluding the Swiss Franc and Japanese Yen. Investors from all four corners of the world rushed for a sweet piece of the Dollar as global recession fears became a key theme.
As we head into the second quarter of 2020, the Dollar Index (DXY) could push higher if global sentiment fails to improve. Looking at the technical picture, a solid daily close above 99.90 could open a path toward 101.00 and 102.00, respectively.
Japanese Yen eyes Dollar’s throne
Another champion in the FX arena was the Japanese Yen.
In times of uncertainty, investors tend to rush to safety with the Yen acting as one of the hotspots of safety over the past few months.
The USDJPY remains a battleground for the Dollar and Yen as risk aversion supports appetite for both currencies. A breakdown below 107.00 could trigger a decline towards 106.60 and 106.00. Alternatively, a breakout above 109.00 should open the doors towards 111.60.
Euro posts a mixed performance but volatile against USD
The Euro has displayed explosively levels of volatility against the Dollar since the start of 2020. At one point the EURUSD tumbled over 850 pips before rebounding 500+ pips as the coronavirus swept through markets.
Unprecedented measures have been enforced by the European Central Bank to cushion the painful blows inflicted by the coronavirus outbreak. The question is whether this will boost attraction towards the Euro in the second quarter of 2020.
Sustained weakness below 1.1000 could trigger a decline towards 1.0780 and 1.0650. Should 1.1000 act as a reliable support, prices could test 1.1220.
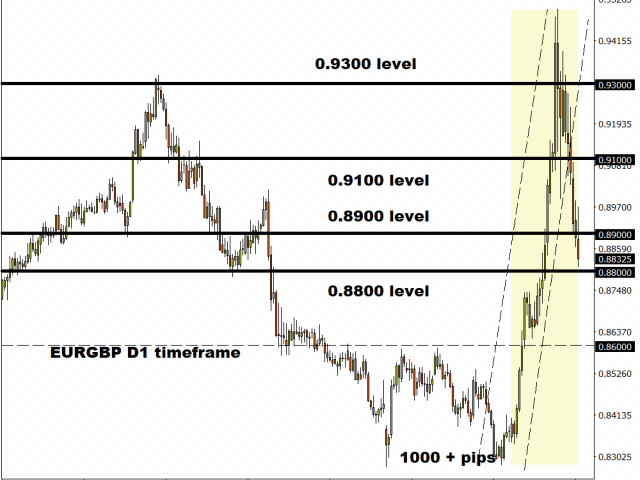
EURGBP tumbles below 0.8900
A tug of war is taking place on the EURGBP as investors grapple with weakness in both the Euro and Pound.
A solid daily close below 0.8800 could open a clean path towards 0.8600. If prices break above 0.8900, the EURGBP could rebound towards 0.9100.
South African Rand tumbles to all-time low
The South African Rand is sulking near all-time lows as investors digest Moody’s latest decision to downgrade the country’s last investment-grade rating.
The local currency has weakened against every single G10 currency year-to-date and shed almost 30% against the Dollar. With investors adopting a cautious stance amid the coronavirus outbreak and global recession fears draining confidence, emerging market currencies like the Rand are positioned to weaken further.
One key question is how much further can the Rand depreciate as we enter the second quarter of 2020? Should the Dollar appreciate on risk aversion, this could compound to the Rand’s woes. Technical traders will continue to observe how the USDZAR behaves above 18.00.
Disclaimer: The content in this article comprises personal opinions and should not be construed as containing personal and/or other investment advice and/or an offer of and/or solicitation for any transactions in financial instruments and/or a guarantee and/or prediction of future performance. ForexTime (FXTM), its affiliates, agents, directors, officers or employees do not guarantee the accuracy, validity, timeliness or completeness, of any information or data made available and assume no liability as to any loss arising from any investment based on the same.
The U.S. Federal Reserve took another step to ensure global financial markets operate smoothly during the coronavirus crises by setting up a repurchase agreement facility for foreign central banks so they can obtain U.S. dollars that can be used by banks in their own countries.
The Fed, which has already taken several other initiatives this month to ensure U.S. dollars are readily available worldwide, established a temporary repurchase agreement facility for foreign and international monetary authorities (FIMA Repo Facility) that enables other central banks to temporarily exchange their U.S. Treasury securities for U.S. dollars.
In addition to making U.S. dollars available abroad, the facility will also help stabilize the U.S. market by ensuring foreign central banks are not selling their holdings of treasuries on the market.
“This facility should help support the smooth functioning of the U.S. Treasury market by providing an alternative temporary source of U.S. dollars other than sales of securities in the open market,” said the Fed. The FIMA Repo Facility will be available from April 6 for at least 6 months.
Given the dominant role of the U.S. dollar in the global financial system, the Fed has taken several other actions this month to ensure funding is available.
On March 15, when the Fed cut its benchmark fed funds rate for the second time to effectively zero percent, it also cut the price of standing U.S. dollar liquidity swaps b 25 basis points in coordination with the central banks of the euro area, Canada, the UK, Japan and Switzerland.
On March 19 it then established temporary swap lines with the central banks of Australia, Brazil, Denmark, South Korea, Mexico, Norway, New Zealand, Singapore and Sweden to help ease any strains in dollar funding markets.
The following day, March 20, the Fed, the Bank of Canada, the Bank of England, the Bank of Japan, the European Central Bank and the Swiss National Bank increased the frequency of their standing dollar swap funding operations to daily from weekly, continuing through April.
The Board of Governors of the Federal Reserve System released the following statement:
“The Federal Reserve on Tuesday announced the establishment of a temporary repurchase agreement facility for foreign and international monetary authorities (FIMA Repo Facility) to help support the smooth functioning of financial markets, including the U.S. Treasury market, and thus maintain the supply of credit to U.S. households and businesses. The FIMA Repo Facility will allow FIMA account holders, which consist of central banks and other international monetary authorities with accounts at the Federal Reserve Bank of New York, to enter into repurchase agreements with the Federal Reserve. In these transactions, FIMA account holders temporarily exchange their U.S. Treasury securities held with the Federal Reserve for U.S. dollars, which can then be made available to institutions in their jurisdictions. This facility should help support the smooth functioning of the U.S. Treasury market by providing an alternative temporary source of U.S. dollars other than sales of securities in the open market. It should also serve, along with the U.S. dollar liquidity swap lines the Federal Reserve has established with other central banks, to help ease strains in global U.S. dollar funding markets.
The Federal Reserve provides U.S. dollar-denominated banking services to FIMA account holders in support of Federal Reserve objectives and in recognition of the U.S. dollar’s predominant role as an international currency. The FIMA Repo Facility, which adds to the range of services the Federal Reserve provides, will be available beginning April 6 and will continue for at least 6 months.”
Euro-zone inflation fell in March: the consumer price index growth slowed to 0.7% over year after 1.2% growth in February, when a decline to 0.8% was expected. This is bearish for EURUSD.
As a rule, the high-tech Nasdaq100 index possesses increased volatility and is the first to respond to news. Earlier, the largest international banks announced very pessimistic forecasts of a decline in the US GDP, which were taken into account in stock prices. In particular, JPMorgan Bank expects the US economic downturn in the 1st quarter up to 10.5% in annual terms and another 25% in the 2nd quarter. The amount of government assistance of $ 2 trillion is just about 10-11% of the annual US GDP and can help corporations survive the crisis caused by the coronavirus epidemic. Theoretically, the 2nd quarter for the US economy may not be as bad as previously expected. An additional positive factor may be a decrease in world oil prices. The value of West Texas Intermediate (WTI) dropped to $ 20 per barrel, the lowest since 2002. This will help reduce the costs of the American economy. Another good factor is the Fed’s policy of lowering rates and an almost unlimited supply of liquidity. US GDP data for the 1st quarter will be released only at the end of April. Non-farm Payrolls employment rate for March, which may affect the dynamics of the Nd100, will be published this Friday.
– Many traders become very emotional when the markets turn Bearish and fail to properly understand that price structure is still driving market price movement. This morning, I highlighted this structure to my subscribers attempting to alert them to the possibility that the markets could recover moderately over the next 3 to 5+ days attempting to set up the next “waterfall” downside price event.
On January 29, 2020, I posted a research article detailing my belief that a “waterfall” type of event was setting up in the markets. This article was nearly 30 days prior to the peak in the markets. It explained how events take place and how markets tend to develop a moderate recovery phase between selloff price declines.
Skilled traders should notice the size and levels of each selloff event in the chart (above) and pay very close attention to how price initially collapsed from the peak, then recovered nearly 50% in early and late November before finally setting up a deeper waterfall price collapse in early December.
Our research team believes the US stock markets may attempt something similar over the next 3 to 5+ days as the Covid-19 economic outcome continues to process through the global markets.
The US and other Central Banks have taken broad steps to attempt to overcome the negative economic outcomes related to the Covid-19 global shutdown. Their biggest concern is that consumer activity could diminish and banking/credit firms could come under severe pressures because of a consumer collapse.
There are over 35 million US low-wage jobs that may become at-risk because of the Covid-19 virus event. We believe the true economic contagion of the global virus event may now be known until well into April or May 2020. Yet we believe these at-risk, low-wage jobs are prevalent throughout the globe and foreign nations, such as Asia and Europe, may experience a similar consumer economic contagion over the next 6+ months.
Before you continue, be sure to opt-in to our free market trend signals before closing this page, so you don’t miss our next special report!
We believe the data related to the Covid-19 economic crisis will not fully be known until well into April or May 2020. Because of this, we believe the US stock markets may recover to levels near the 50% Fibonacci Retracement levels on these charts before attempting a series of further downside price moves. Skilled traders should not become overly emotional right now and pay attention to the structure of the price action as well as other technical conditions in play at the moment. Our objective is to execute trades with a highly targets success rate – not to trade on emotions.
SPY Daily Chart
This SPY Daily chart shows the SPY would only need to rally 18.70 points to reach the 50% Fibonacci retracement level on this chart. This could happen very quickly given how close the price actually is to this key Fibonacci level. If that were to happen over the next 3 to 5+ trading days, the downward sloping price channels from our TTCharger modeling system would move lower to meet price near 278 – which would set up a new resistance zone and possibly a new wave of selling.
INDU Daily Chart
This INDU Daily chart shows the Dow Jones would have to rally about 2025 points (to levels near 23,886) to reach the 50% Fibonacci Retracement target. If this were to happen, the sloping price channels on this chart would likely move lower to meet price near this 50% target level – presenting a very clear resistance zone for a new wave of selling to begin.
Remember, it is not about emotions or attempting to try to force the markets to adopt your “belief”. Skilled traders attempt to identify risks, opportunities and realistic technical setups that allow them to objectively determine where and when the markets are providing a real opportunity for success.
We may be just a few days away from the next major wave of selling, yet any trader who jumped into an emotional trader over the past 5+ days expecting the markets to continue to break down is likely under a fair amount of stress right now. Learn to read the charts and the structure of price more effectively and you’ll find the answers are already on the charts in front of you.
As a technical analysis and trader since 1997, I have been through a few bull/bear market cycles. I believe I have a good pulse on the market and timing key turning points for short-term swing traders.
If you are a more active trader and swing trader visit my Active ETF Trading Newsletter. If you are a long-term investor looking for signals when to own equities, bonds, or cash, be sure to look into my Long-Term Investing Signals.
Ride my coattails as I navigate these financial markets and build wealth while others lose nearly everything they own during the next financial crisis.
Chris Vermeulen Chief Market Strategist Founder of Technical Traders Ltd. TheTechnicalTraders.com