Weakness Appears To Be Setting For This Weeks Economic Data

By TheTechnicalTraders 

– As the world reacts to the global economic slowdown because of the COVID-19 virus event and the massive stimulus programs and central bank efforts to support the global economy, investors still expect weakness in the US and foreign markets.  We believe this expected weakness will not subside until news of a proper resolution to this virus event is rooted in the minds of investors and global markets.

Hong Kong and China are currently concerned about experiencing a “third wave” of the COVID-19 virus within their society.  As the economies open back up to somewhat normal, people are very concerned that a renewed wave of new infections will suddenly appear and potentially result in another shut-down event or infectious cycle?  We believe all nations are watching what is happening in Hong Kong and China as they attempt to reopen their economies.

The rest of the world is still battling the rising infection rates and dealing with the economic shutdowns that have brought the global economy to its knees.  Europe, Japan, Canada, and the US are all experiencing vast disruptions to their economies and commodity prices and demand expectations are collapsing as a result.

Nearly a week ago, we issued a research article that suggested our proprietary Fibonacci Price Modeling tool’s key resistance levels may become a very valid ceiling for any price recovery.  It appears this is happening in the markets as the NQ Daily chart, below, shows.

Before you continue, be sure to opt-in to our free market trend signals 
before closing this page, so you don’t miss our next special report!

Daily Nasdaq (NQ) Chart

The NQ resistance level, near 7880, has acted as a soft ceiling in the NQ over the past 4+ trading days.  Today, the NQ briefly rallied above this level, then rotated downward below this level again to confirm this key resistance level.  We believe this critical Fibonacci resistance level may continue to act as a price ceiling over the next few trading days and push prices lower as economic news and expectations hit the news this week and next.

The next downside price target for the NQ is 6565 – new price lows.

If you have not seen this important technical analysis on the Nasdaq which I posted a couple of days ago, be sure to see these charts.

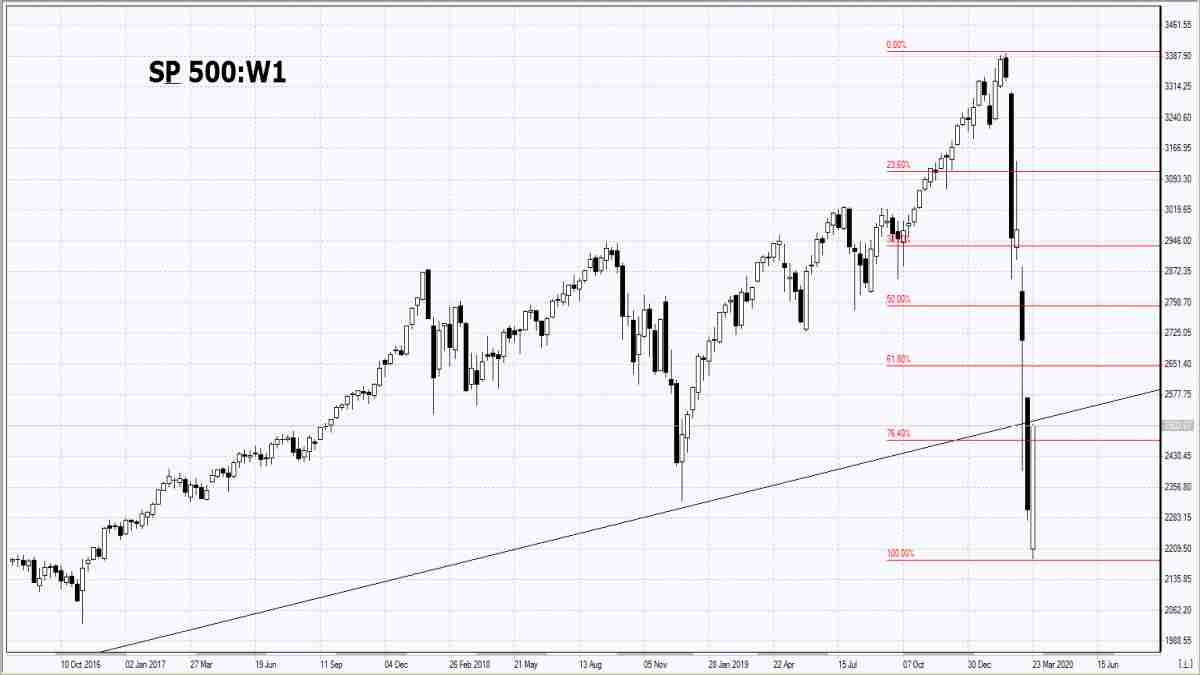
SP500 (ES) Weekly Chart

This ES Weekly chart illustrates another key resistance level near 2679.  Although the ES price has not rallied up to reach this critical Fibonacci resistance level, we still believe this level is acting as a price ceiling and that the ES will weaken as future expectations are confirmed by earnings data, economic data and other collateral damage to the global economy.

We are still very early in understanding the total scope of this virus event.  The US and other global central banks are attempting to front-run any weakened expectations as a result of this virus event.  We continue to believe the extended collateral damage to the consumer, business and other aspects of the economy are yet to come.  Most recently, consumer delinquencies have begun to skyrocket and the news is being printed about landlords and renters being unable to satisfy obligations on April 1st.

This is part of the reason why we believe further caution is warranted at this time in the markets. We issued an Important Trade and Investment Alert Yesterday.

Our research team believes a deeper price low will likely set up over the next 30+ days to establish a true price bottom.  As we’ve warned, we believe extended collateral damage to the US and global economy will soon become better understood and the extended shutdown of the US and other economies only manages to complicate any positive expectations for a bottom.

We believe a deeper price low will set up within the next 30+ days and we urge skilled traders to pay attention to the broader expectations of the markets.  Earnings data and other economic data will continue to stream into the news centers over the next 30+ days.  Don’t get too aggressive with trying to buy a bottom in the markets just yet.  Be patient and wait for the markets to show you when the bottom has really setup.

As a technical analysis and trader since 1997, I have been through a few bull/bear market cycles. I believe I have a good pulse on the market and timing key turning points for short-term swing traders.

I hope you found this informative, and if you would like to get a pre-market video every day before the opening bell, along with my trade alerts visit my Active ETF Trading Newsletter. If you are a long-term investor looking for signals when to own equities, bonds, or cash, be sure to look into my Long-Term Investing Signals.

Ride my coattails as I navigate these financial markets and build wealth while others lose nearly everything they own during the next financial crisis.

Chris Vermeulen
Chief Market Strategist
TheTechnicalTraders.com


Fibonacci Retracements Analysis 01.04.2020 (GBPUSD, EURJPY)

Article By RoboForex.com

GBPUSD, “Great Britain Pound vs US Dollar”

As we can see in the daily chart, GBPUSD is correcting the previous descending wave and trying to fix above the low at 1.1958; by now, the pair has stopped its growth not far from the resistance at 61.8% fibo (1.2550). If the price rebounds from this level, the instrument may resume falling towards the post-correctional extension area between 138.2% and 161.8% fibo at 1.1365 and 1.0996 respectively. However, if the price breaks 61.8% fibo at 1.2550, it may grow to attach the high at 1.3510.

GBPUSD_D1
Risk Warning: the result of previous trading operations do not guarantee the same results in the future

In the H1 chart, the local convergence made the pair start a new correction. The support is at 38.2% fibo (12092). After completing the pullback, the pair may resume growing to reach 61.8% and 76.0% fibo at 1.2510 and 1.2764 respectively.

GBPUSD_H1
Risk Warning: the result of previous trading operations do not guarantee the same results in the future

EURJPY, “Euro vs. Japanese Yen”

As we can see in the H4 chart, EURJPY has failed to break the highs despite an attempt to fix above the resistance at 38.2% fibo (120.19). Right now, the price is returning to towards 76.0% fibo at 117.55. If later the pair breaks this level, the instrument may continue falling to reach the low at 115.86.

EURJPY_H4
Risk Warning: the result of previous trading operations do not guarantee the same results in the future

In the H1 chart, the pair is trading downwards to reach 61.8% and 76.0% fibo at 118.03 and 117.32 respectively. At the same time, there is a convergence on MACD, which may indicate a possible pullback or reversal. The resistance is the local high at 121.14.

EURJPY_H1

Article By RoboForex.com

Attention!
Forecasts presented in this section only reflect the author’s private opinion and should not be considered as guidance for trading. RoboForex LP bears no responsibility for trading results based on trading recommendations described in these analytical reviews.

Stocks: When Grass Looks Greener on the Other Side of the … Pond

By Elliott Wave International

Let’s start by establishing that the stock market is not driven by the news. Aggregate stock prices are driven by waves of optimism and pessimism — which go from one extreme to another — as reflected by the Elliott wave model. That’s what makes the stock market predictable.

Hence, Elliott wave analysis is at the core of EWI’s stock market forecasts.

Having said that, sentiment indicators are also valuable in providing clues about “what’s next.”

For example, Robert Prechter’s book, Prechter’s Perspective, made this observation:

No crowd buys stocks of other countries intelligently. For decades, heavy foreign buying in the U.S. stock market has served as an excellent indicator of major tops.

Well, in the year 2000, that’s exactly what happened. Foreign purchases of U.S. shares spiked to a then record $402 billion in March 2000. The spike in foreign buying coincided precisely with a price peak in the S&P 500. From the month of the high in March 2000 through October 2002, the S&P declined 51%.

Fast forward to December 2019, when our Elliott Wave Financial Forecast showed two charts related to overseas buying of U.S. shares. Here’s the first one:

This chart notes our discussion about foreign buying in the year 2000 and also in August 2007: “The first five months of [2007] produced what was easily the biggest gusher of net foreign buying in history. The record suggests that falling prices lie directly ahead for the U.S. market.”

The historic stock market top of 2007 occurred just two months later.

Here’s the second chart from the December 2019 Elliott Wave Financial Forecast, along with the commentary:

The chart of foreign holdings of U.S. stocks shows a new record of $7.7 trillion in total stock holdings as of July [2019]. On November 7, The Wall Street Journal reported that the “appetite for U.S. shares among international clients has shown few signs of abating.” Foreigners are all in on the U.S. stock market rally. Our bet is that it will end in a major top just as it did in 2000 and 2007.

Plus, the Elliott wave model was also indicating that the stock market top was approaching. The Jan. 2020 Elliott Wave Financial Forecast noted:

The rally is the final [wave] of the bull market.

The February 2020 stock market top occurred just a month later.

As you know, historic stock market volatility has unfolded since then. Interestingly, during highly emotional markets — such as what investors face now — Elliott waves tend to be clear.

So, now is the ideal time to learn all you can about the Elliott wave method of analyzing and forecasting financial markets.

You can do so free!

You see, when you signup for a free Club EWI membership, you get instant, free access to the online version of the book, Elliott Wave Principle: Key to Market Behavior, by Frost & Prechter. You can have this Wall Street classic on your computer screen in just moments!

Forex Technical Analysis & Forecast 01.04.2020

Article By RoboForex.com

EURUSD, “Euro vs US Dollar”

EURUSD has almost completed the correction by finishing the descending wave towards 1.0926; right now, it is forming the second ascending impulse. After breaking 1.1060, the instrument may grow to reach 1.1100. Later, the market may break this level as well and then continue trading upwards with the short-term target at 1.1140.

EURUSD
Risk Warning: the result of previous trading operations do not guarantee the same results in the future

GBPUSD, “Great Britain Pound vs US Dollar”

GBPUSD continues consolidating around 1.2343. Possibly, today the pair may fall towards 1.2200 and then grow to return to 1.2343. If later the price breaks this range to the downside, the market may form a new descending structure towards 1.2055; if to the upside – resume trading upwards with the target at 1.2555.

GBPUSD
Risk Warning: the result of previous trading operations do not guarantee the same results in the future

USDCHF, “US Dollar vs Swiss Franc”

USDCHF has completed the correction by finishing the ascending structure at 0.9684; right now, it is forming another descending structure to break 0.9580. After that, the instrument may continue trading downwards with the target at 0.9467.

USDCHF
Risk Warning: the result of previous trading operations do not guarantee the same results in the future

USDJPY, “US Dollar vs Japanese Yen”

USDJPY has rebounded from 108.78 to the downside. Today, the pair may fall to reach 106.94 and then resume trading upwards with the target at 109.45.

USDJPY
Risk Warning: the result of previous trading operations do not guarantee the same results in the future

AUDUSD, “Australian Dollar vs US Dollar”

AUDUSD is forming a wide consolidation range around 0.6140. Possibly, today the pair may trade downwards to break 0.6066 and then continue falling with the target at 0.5919.

AUDUSD
Risk Warning: the result of previous trading operations do not guarantee the same results in the future

USDRUB, “US Dollar vs Russian Ruble”

USDRUB is falling; it is still consolidating around 78.45. Possibly, the pair may form one more ascending structure towards 79.75. However, the main scenario implies that the price is expected to fall to break 76.90 and then continue trading downwards with the target at 74.33.

USDRUB
Risk Warning: the result of previous trading operations do not guarantee the same results in the future

USDCAD, “US Dollar vs Canadian Dollar”

USDCAD has completed the correction at 1.4333; right now, it is trading downwards to reach 1.3822. Later, the market may start another correction with the target at 1.4233.

USDCAD
Risk Warning: the result of previous trading operations do not guarantee the same results in the future

XAUUSD, “Gold vs US Dollar”

Gold has finished the descending wave at 1560.50. Today, the pair may correct to reach 1597.50. After that, the instrument may continue trading downwards with the short-term target at 1557.50.

GOLD
Risk Warning: the result of previous trading operations do not guarantee the same results in the future

BRENT

After forming another consolidation range around 23.60, Brent has broken it to the downside. Possibly, today the pair may fall towards 22.00 and then form one more ascending structure to return to 23.60. After that, the instrument may break the latter level and continue trading upwards with the target at 25.40.

BRENT
Risk Warning: the result of previous trading operations do not guarantee the same results in the future

BTCUSD, “Bitcoin vs US Dollar”

BTCUSD is still consolidating around 6100.00. Possibly, the pair may form one more ascending structure towards 6900.00. If later the price breaks this range to the downside, the market may resume trading downwards to reach 5600.00 or even 5300.00; if to the upside – start a new growth with the target at 7600.00.

BITCOIN

Article By RoboForex.com

Attention!
Forecasts presented in this section only reflect the author’s private opinion and should not be considered as guidance for trading. RoboForex LP bears no responsibility for trading results based on trading recommendations described in these analytical reviews.

EURUSD: renewed drop to the D3 line on the cards

By Alpari.com

On Tuesday the 31st of March, trading on the euro closed slightly down. After dropping to 1.0927, the pair recovered to 1.1039. The bears hit fresh lows following a breakout of the trend line during the Asian session. The rebound occurred on the back of the US Fed’s decision to launch a temporary repurchase agreement facility for foreign central banks.

Day’s news (GMT+3):

  • 10:30 Switzerland: SVME PMI (Mar).
  • 10:50 France: Markit manufacturing PMI (Mar).
  • 10:55 Germany: Markit manufacturing PMI (Mar).
  • 11:00 Eurozone: Markit manufacturing PMI (Mar).
  • 11:30 UK: Markit manufacturing PMI (Mar).
  • 12:00 Eurozone: unemployment rate (Feb).
  • 15:15 US: ADP employment change (Mar).
  • 16:45 US: Markit manufacturing PMI (Mar).
  • 17:00 US: ISM manufacturing PMI (Mar), construction spending (Feb).
  • 17:30 US: EIA crude oil stocks change (27 Mar).

Pic. 1Current situation:

As expected, the pair dropped to the D3 line, subsequently rebounding to the LB balance line. The coronavirus rages on across the world. Meanwhile, the US Fed is taking measures to increase the dollar’s liquidity, which is having a negative effect on the currency itself. Regardless, the situation in Europe isn’t any better, and buying the euro isn’t an enticing prospect either.

Since the rate bounced from the D3 line without any divergence, today we expect the pair to fall from the LB line and revisit yesterday’s low with a new test of the D3 line. The technicals indicate growth, but since the pair is trading beneath the LB line, and there’s no divergence on the AO indicator, it’s reasonable to expect a test of 1.0927. We could be mistaken, but we think it better to be in the bears’ camp for today. Once the pair hits fresh lows, markets will begin preparing for Friday’s NFP report.

By Alpari.com

The Analytical Overview of the Main Currency Pairs on 2020.04.01

by JustForex

The EUR/USD currency pair

Technical indicators of the currency pair:
  • Prev Open: 1.10430
  • Open: 1.10390
  • % chg. over the last day: -0.15
  • Day’s range: 1.09712 – 1.10338
  • 52 wk range: 1.0777 – 1.1494

The greenback has become stable against major competitors. Financial market participants expect additional drivers. The EUR/USD currency pair is currently consolidating. The local support and resistance levels are 1.09600 and 1.10400, respectively. In the near future, a technical correction of the trading instrument is not ruled out. We expect important economic releases. We recommend opening positions from key levels.

The Economic News Feed for 01.04.2020:

  • – German manufacturing PMI at 10:55 (GMT+3:00);
  • – ADP nonfarm employment change at 15:15 (GMT+3:00);
  • – ISM manufacturing PMI at 17:00 (GMT+3:00).
EUR/USD

Indicators do not give accurate signals: the price has fixed between 50 MA and 100 MA.

The MACD histogram is near the 0 mark.

Stochastic Oscillator is in the neutral zone, the %K line is below the %D line, which indicates the bearish sentiment.

Trading recommendations
  • Support levels: 1.09600, 1.08850, 1.08000
  • Resistance levels: 1.10400, 1.11450

If the price fixes below 1.09600, the EUR/USD currency pair is expected to correct. The movement is tending to the round level of 1.09000.

An alternative could be the growth of EUR/USD quotes to 1.11000-1.11200.

The GBP/USD currency pair

Technical indicators of the currency pair:
  • Prev Open: 1.23978
  • Open: 1.24140
  • % chg. over the last day: +0.03
  • Day’s range: 1.23302 – 1.24438
  • 52 wk range: 1.1466 – 1.3516

The GBP/USD currency pair is still being traded in a flat. There is no defined trend. The key support and resistance levels are 1.23000 and 1.24800, respectively. In the near future, a technical correction of the trading instrument is not ruled out. Today, investors will assess important statistics from the UK and the US. Positions should be opened from key levels.

At 11:30 (GMT+3:00), UK manufacturing PMI will be published.

GBP/USD

Indicators do not give accurate signals: the price has crossed 50 MA.

The MACD histogram is near the 0 mark.

Stochastic Oscillator is in the neutral zone, the %K line has crossed the %D line. There are no signals at the moment.

Trading recommendations
  • Support levels: 1.23000, 1.21450, 1.20150
  • Resistance levels: 1.24800, 1.25500

If the price fixes below the round level of 1.23000, GBP/USD quotes are expected to fall. The movement is tending to 1.22000-1.21000.

An alternative could be the growth of the GBP/USD currency pair to 1.25500-1.26000.

The USD/CAD currency pair

Technical indicators of the currency pair:
  • Prev Open: 1.41624
  • Open: 1.40648
  • % chg. over the last day: -0.77
  • Day’s range: 1.40569 – 1.41958
  • 52 wk range: 1.2949 – 1.4668

Since the beginning of this week, trading on the USD/CAD currency pair has been very active. At the same time, there is no defined trend. The loonie is currently consolidating in the range of 1.41000-1.42000. The Canadian dollar is under pressure due to a significant collapse in oil prices. Today we recommend paying attention to economic reports from the US. Positions should be opened from key levels.

The news feed on Canada’s economy is calm.

USD/CAD

Indicators do not give accurate signals: the price has fixed between 50 MA and 100 MA.

The MACD histogram is near the 0 mark.

Stochastic Oscillator is in the overbought zone, the %K line has crossed the %D line. There are no signals at the moment.

Trading recommendations
  • Support levels: 1.41000, 1.40100, 1.39250
  • Resistance levels: 1.42000, 1.43350, 1.44150

If the price fixes above 1.42000, the USD/CAD currency pair is expected to grow. The movement is tending to 1.42750-1.43500.

An alternative could be a decrease in the USD/CAD quotes to 1.40500-1.39500.

The USD/JPY currency pair

Technical indicators of the currency pair:
  • Prev Open: 107.694
  • Open: 107.498
  • % chg. over the last day: -0.26
  • Day’s range: 107.253 – 107.938
  • 52 wk range: 101.19 – 112.41

There is an ambiguous technical pattern on the USD/JPY currency pair. The trading instrument is in a sideways trend. Investors expect additional drivers. At the moment, the local support and resistance levels are 107.200 and 107.900, respectively. Demand for the “safe haven” currencies is still high. The yen has the potential for further growth against the US currency. Positions should be opened from key levels.

Positive economic releases from Tankan were published during the Asian trading session.

USD/JPY

Indicators do not give accurate signals: the price is consolidating near 50 MA.

The MACD histogram is in the negative zone, indicating the bearish sentiment.

Stochastic Oscillator is in the neutral zone, the %K line has crossed the %D line. There are no signals at the moment.

Trading recommendations
  • Support levels: 107.200, 106.500.
  • Resistance levels: 107.900, 108.700, 109.200

If the price fixes below 107.200, a further drop in the USD/JPY quotes is expected. The movement is tending to 106.500-106.200.

An alternative could be the growth of the USD/JPY currency pair to 108.500-109.000.

by JustForex

A new Gold liquidation wave, driven by ADP data, on Wednesday?

By Admiral Markets

Economic Events

Source: Economic Events April 1, 2020 – Admiral Markets’ Forex Calendar

On Wednesday, all eyes will be on the ADP Employment Change at 12:15pm GMT.

After Initial jobless claims saw a historically high print at 3.28 million last Thursday, the highest since the Department of Labour started tracking the data in 1967, it will be interesting to see if we get to see a similarly weak ADP print. Around the Great Financial Crisis in 2008, we saw a (negative) record at -835k which will be difficult to beat, as the coming data is is expected to be published around -154k.

But a print which comes in significantly below the expectation of -154k could still trigger elevated volatility, since it would potentially point to a wider US economic downturn, and after US president Trump said last Sunday that federal coronavirus guidelines such as social distancing are to be extended until at least April 30, going beyond Easter. A shutdown that continues beyond expectations could result in an even more damaging effect on the US economy.

Usually, this would be bullish for Gold, and after Gold found a (short-term) bottom around 1,440/450 USD, and with Fed’s stimulus last week (where it was announced the US central bank plans to buy an unlimited amount of US Treasuries and Mortgage-Backed-Securities (MBS)), a further push higher to and beyond 1,700 USD seems to be favoured, but we’d like to be a little careful here.

In fact, we could imagine seeing another wave of selling in classic “safe-haven” assets like Gold, resulting out of a credit crunch and liquidating everything to stay solvent.

That in mind, another “liquidation wave” could bring a short-term drop below 1,440/450 USD into play which would technically darken the picture, activating 1,250/260 USD as a first target:

Gold Daily chart

Source: Admiral Markets MT5 with MT5-SE Add-on Gold Daily chart (between December 31, 2018, to March 31, 2020). Accessed: March 31, 2020, at 10:00pm GMT – Please note: Past performance is not a reliable indicator of future results, or future performance.

In 2015, the value of Gold fell by 10.4%, in 2016, it increased by 8.1%, in 2017, it increased by 13.1%, in 2018, it fell by 1.6%, in 2019, it increased by 18.9%, meaning that after five years, it was up by 28%.

Discover the world’s #1 multi-asset platform

Admiral Markets offers professional traders the ability to trade with a custom, upgraded version of MetaTrader 5, allowing you to experience trading at a significantly higher, more rewarding level. Experience benefits such as the addition of the Market Heat Map, so you can compare various currency pairs to see which ones might be lucrative investments, access real-time trading data, and so much more. Click the banner below to start your FREE download of MT5 Supreme Edition!

Download MetaTrader 5 and begin trading today!

Disclaimer: The given data provides additional information regarding all analysis, estimates, prognosis, forecasts or other similar assessments or information (hereinafter “Analysis”) published on the website of Admiral Markets. Before making any investment decisions please pay close attention to the following:

  1. This is a marketing communication. The analysis is published for informative purposes only and are in no way to be construed as investment advice or recommendation. It has not been prepared in accordance with legal requirements designed to promote the independence of investment research, and that it is not subject to any prohibition on dealing ahead of the dissemination of investment research.
  2. Any investment decision is made by each client alone whereas Admiral Markets shall not be responsible for any loss or damage arising from any such decision, whether or not based on the Analysis.
  3. Each of the Analysis is prepared by an independent analyst (Jens Klatt, Professional Trader and Analyst, hereinafter “Author”) based on the Author’s personal estimations.
  4. To ensure that the interests of the clients would be protected and objectivity of the Analysis would not be damaged Admiral Markets has established relevant internal procedures for prevention and management of conflicts of interest.
  5. Whilst every reasonable effort is taken to ensure that all sources of the Analysis are reliable and that all information is presented, as much as possible, in an understandable, timely, precise and complete manner, Admiral Markets does not guarantee the accuracy or completeness of any information contained within the Analysis. The presented figures refer that refer to any past performance is not a reliable indicator of future results.
  6. The contents of the Analysis should not be construed as an express or implied promise, guarantee or implication by Admiral Markets that the client shall profit from the strategies therein or that losses in connection therewith may or shall be limited.
  7. Any kind of previous or modeled performance of financial instruments indicated within the Publication should not be construed as an express or implied promise, guarantee or implication by Admiral Markets for any future performance. The value of the financial instrument may both increase and decrease and the preservation of the asset value is not guaranteed.
  8. The projections included in the Analysis may be subject to additional fees, taxes or other charges, depending on the subject of the Publication. The price list applicable to the services provided by Admiral Markets is publicly available from the website of Admiral Markets.
  9. Leveraged products (including contracts for difference) are speculative in nature and may result in losses or profit. Before you start trading, you should make sure that you understand all the risks.

By Admiral Markets

US stock market awaits labor market data and corporate reporting

By IFCMarkets

US stock market down

On Tuesday, US stock quotes fell. The S&P 500 index rebounded by 21% from its minimum on March 23. This movement was part of a technical correction to the 2nd Fibonacci level after a drop of 35% from the February highs. Some fundamental reasons are needed for a further growth. Investors are not yet willing to take risks and, most likely, will wait for corporate reporting for the 1st quarter of 2020, which will be published in the United States starting next week. This week important data on the US labor market and the employment rate (Non-farm Payrolls) for March will be released on Friday. It is expected to be the worst since June 2010 (-100 thousand jobs). The S&P 500 (-1,6%), Nasdaq (-0,95%) and Dow Jones Industrial Average (1,84%) fell yesterday. Now their futures are traded with a noticeable decrease (-3%). For the 1st quarter of 2020, the S&P 500 index fell by almost 20%, which was the most significant quarterly decline since 1987. The main reason for this was the Covid-19 pandemic. The top losers yesterday were utility companies and the real estate sector. Shares of energy companies have grown thanks to a statement by US President Donald Trump about negotiations with Russia and Saudi Arabia regarding the oil production regulation. On Tuesday, the turnover of US exchanges was 13.1 billion shares. This is less than the 20-day average of 15.7 billion shares. Today the business activity indexc for March (ISM Manufacturing) and Construction Spending for February will be released in the US. The ICE US dollar index rose today, no positive news was there for it. So far, this looks like a technical correction after the powerful collapse caused by the Fed statement last week about allocating $ 2 trillion to help the US economy.

European stock indices continue to decline today

European stocks fell yesterday. German labor market data for March turned out to be worse than the forecasts. Citigroup Bank predicts a 1.6% drop in global GDP in 2020 and a 50% reduction in dividends from European companies. Earlier, the ECB allowed European banks not to pay dividends at all and to direct funds to increase own capital. A similar statement was made by the Bank of England. Today, shares of the British bank HSBC fell by 9%. The pan-European stock index EU STOXX 50 continued to fall. This was facilitated by the decline in the economic indicator of the business activity in the Eurozone industrial sector (IHS Markit’s manufacturing) in March to a minimum since 2012. At the same time, manufacturing PMI in Italy fell to an 11-year low. A significant negative factor was the continued growth of patients with coronavirus in Europe. Today EUR / USD quotes are falling for the third day in a row amid weak macroeconomic statistics and an increase in the number of patients with coronovirus in the main European countries.

01/04/2020 Market Overview IFC Markets chart

Nikkei has been declining for the second day in a row along with other world indices

All Asian indices are mostly down today. The Australian S & P / ASX 200 index rose in anticipation of a recovery in oil and other commodity prices. Nikkei fell 4.5% amid weak macroeconomic data. Indicators Nikkei Japan PMI Manufacturing and Tankan Large Manufacturing fell to their lows since 2013. However, it’s worth noting that they were still better than preliminary forecasts. Goldman Sachs Bank lowered its total operating profit forecast for 7 largest automakers by 22% this year. Shares of Toyota Motor fell by almost 3%. Hang Seng lost 2.3% today.

Brent recorded a new low today

Brent futures quotes today were falling below $ 25 per barrel. Thus, market participants have not yet responded to a statement by US President Donald Trump about his negotiations with the leaders of Russia and Saudi Arabia about the need to coordinate oil production amounts and stabilize prices. Data on a significant increase in US oil reserves by 10.5 million barrels per week turned out to be more important to investors. This is much more than the forecast of 4 million. Note that the consensus forecast of analysts for the Brent average price for the entire 2020 is now $ 37.7 per barrel. This is lower than the actual average price since the beginning of the year (for 3 months), which for now is equal to $ 47.2, but noticeably higher than current quotes. The main reason for the decrease in world oil prices is a fall in demand against the background of quarantine due to the Covid-19 pandemic in almost all countries of the world.

Market Analysis provided by IFCMarkets

Note:
This overview has an informative and tutorial character and is published for free. All the data, included in the overview, are received from public sources, recognized as more or less reliable. Moreover, there is no guarantee that the indicated information is full and precise. Overviews are not updated. The whole information in each overview, including opinion, indicators, charts and anything else, is provided only for familiarization purposes and is not financial advice or а recommendation. The whole text and its any part, as well as the charts cannot be considered as an offer to make a deal with any asset. IFC Markets and its employees under any circumstances are not liable for any action taken by someone else during or after reading the overview.

COPPER Analysis: Chinese Industrial production unexpectedly rebounds

By IFCMarkets

Chinese Industrial production unexpectedly rebounds

The manufacturing PMI (Purchasing Managers’ Index) economic indicator, calculated by the Chinese National Bureau of Statistics (NBS), soared in March to 52 points from its historic low of 35.7 points in February this year. It should be emphasized that 52 points is the highest level since September 2017. Amid the ongoing pandemic of the coronavirus, investors expected a much more modest Chinese manufacturing PMI of 45 points. Now they are more optimistic and predict the same marked increase in industry in neighboring countries – South Korea and Japan. Their official data will be released later. The rapid recovery of industry in Southeast Asia could markedly increase copper demand. It should be noted that World Bank expects a symbolic but still 0.1% increase in Chinese GDP in 2020. China consumes more than half of all copper in the world.

IndicatorVALUESignal
RSIBuy
MACDSell
MA(200)Neutral
FractalsBuy
Parabolic SARBuy
Bollinger BandsNeutral


Summary of technical analysis

OrderBuy
Buy stopAbove 2,25
Stop lossBelow 1,97

Market Analysis provided by IFCMarkets

Chile cuts rate 2nd time, economy to contract ‘severely”

By CentralBankNews.info

Chile’s central bank cut its policy rate for the second time this year to what it said was a “technical minimum” of 0.50 percent after it became clear “the economy entered a process of severe contraction in the second half of March that will extend throughout the second quarter.”

The Central Bank of Chile cut its rate by 50 basis points to 0.50 percent, it’s second rate cut this month after a 75-basis-point cut on March 16. This means the rate has been cut by a total of 125 points this year, and by 250 points since June 2019 when it began a monetary policy easing cycle.

“The external scenario has deteriorated significantly after the rapid global expansion of Covid-19,” the central bank said, adding it had extended its program to purchase bank bonds by US$4 billion, raising the outstanding balance of the program to $5.5 billion.

The Central Bank of Chile issue the following statement:

“In its monetary policy meeting, the Board of the Central Bank of Chile decided to lower the monetary policy interest rate by 50 basis points, to 0.50%. The decision was adopted by the unanimous vote of its members.

The external scenario has deteriorated significantly after the rapid global expansion of Covid-19. The sanitary control measures implemented around the world have triggered important disruptions in supply and demand, whose effects are being felt already. The uncertainty about the magnitude of the economic impact of the pandemic has favored a substantial increase in the markets’ risk aversion. This has reflected on increased demand for safe and short-term assets, escalating volatility and risk indicators, widespread stock market falls, capital outflows from emerging economies, across-the-board depreciation of currencies against the US dollar, and a sharp decline in the prices of commodities, copper included. The monetary and fiscal authorities have launched considerable stimulus plans to address the worsening circumstances, which has eased the markets’ reaction in the most recent past.
While in January and February activity indicators showed a faster than expected recovery than had been forecast in the December Monetary Policy Report, the sudden change in macroeconomic conditions generated by the Covid-19, including the spread of the pandemic into Chile, leads to assume that the economy entered a process of severe contraction in the second half of March that will extend throughout the second quarter. The markets have been steadily trimming their growth projections for this year and the latest estimates point to a y-o-y fall. The government has announced an important stimulus package that couples with the cut to the MPR and the measures adopted by the Bank to facilitate personal and corporate access to credit.

The local financial market has been aligned with these developments. Major corrections have been observed in the IPSA stock index and the exchange rate, while liquidity and fixed-income interest rates have also fluctuated reflecting the search for safe assets. To facilitate the normal flow of credit and the proper functioning of the markets, the Board, among other measures, extended access to liquidity programs already in place, initiated the purchase of bank bonds from SOMA system participants; established the Conditional Financing Facility for Increased Loans (FCIC) expanding eligible collateral; activated the Liquidity Credit Line (LCL) and relaxed liquidity requirements for maturity mismatches. As of today, all these measures are in operation.
In February, annual inflation rose to almost 4% while core inflation remained slightly above 2.5%. This steadily changing scenario significantly reduces medium-term inflationary pressures, given the widening of the activity gap that has resulted. Additionally, the important drop in the oil price counteracts the cost pressures derived from the peso depreciation. Incoming figures of recent days for market inflation expectations have lowered expected levels one year ahead, while two years ahead they are still at 3%.
The Board’s decision to bring the MPR to its technical minimum of 0.5% is made in a scenario in which medium-term inflationary pressures have dissipated substantially and that the efforts to overcome the sanitary crisis will have major effects on activity and employment, among other variables. Accordingly, the Board estimates that for inflation to converge to the 3% target, monetary policy needs to remain highly expansionary for an extended period.
Together with the above, the Board decided to extend the program in place for the purchase of banking bonds by US$ 4 billion and eliminate the maturity constraints of the eligible instruments. Thus, the purchase balance outstanding of that program has changed to an amount of up to US$5.5 billion.
The Board will continue to implement every measure necessary to promote the proper functioning of the financial markets and compliance with the Bank’s inflationary and financial stability objectives.
The March Monetary Policy Report containing the projections and analyses that sustain the Board’s decision will be published tomorrow, Wednesday 1 April 2020 at 8:30 AM.
The minutes from this monetary policy meeting will be published at 8:30 AM of Thursday 16 April 2020. The next monetary policy meeting will take place on Tuesday 5 and Wednesday 6 May 2020 and the statement thereof will be released on Wednesday 5 at 6:00 PM.”