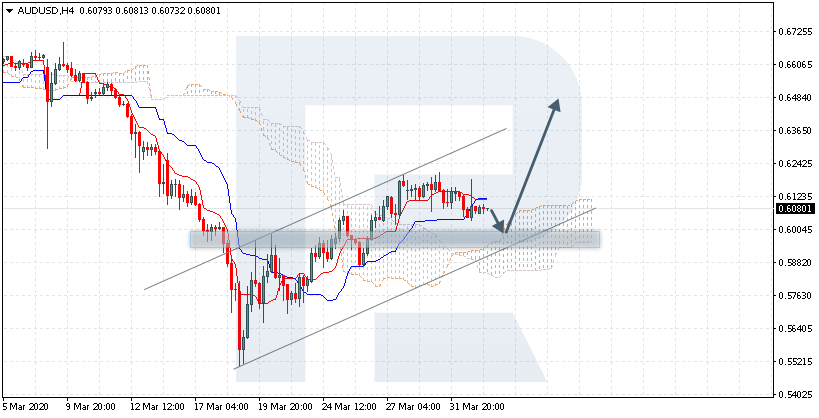
AUDUSD is trading at 0.6080; the instrument is moving above Ichimoku Cloud, thus indicating a bullish tendency. The markets could indicate that the price may test the cloud’s upside border at 0.6005 and then resume moving upwards to reach 0.6485. Another signal to confirm further ascending movement is the price’s rebounding from the rising channel’s downside border. However, the scenario that implies further growth may be canceled if the price breaks the cloud’s downside border and fixes below 0.5760. In this case, the pair may continue falling towards 0.5680.
USDCAD, “US Dollar vs Canadian Dollar”
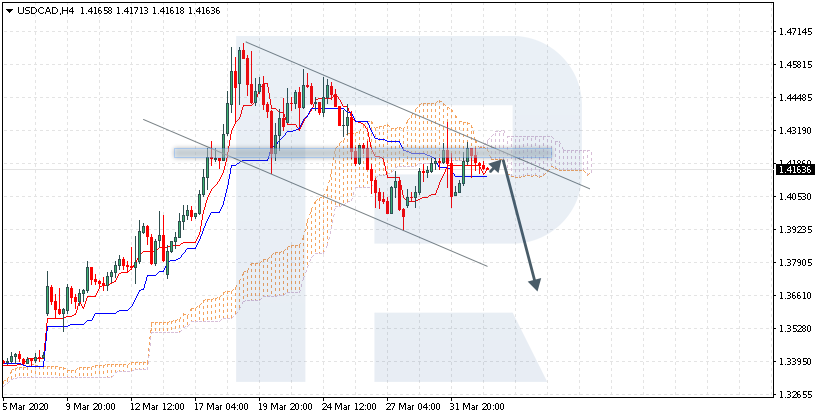
USDCAD is trading at 1.4163; the instrument is moving below Ichimoku Cloud, thus indicating a bearish tendency. The markets could indicate that the price may test the cloud’s downside border at 1.4175 and then resume moving downwards to reach 1.3665. Another signal to confirm further descending movement is the price’s rebounding from the descending channel’s upside border. However, the scenario that implies further decline may be canceled if the price breaks the cloud’s upside border and fixes above 1.4335. In this case, the pair may continue growing towards 1.4450.
NZDUSD, “New Zealand Dollar vs US Dollar”
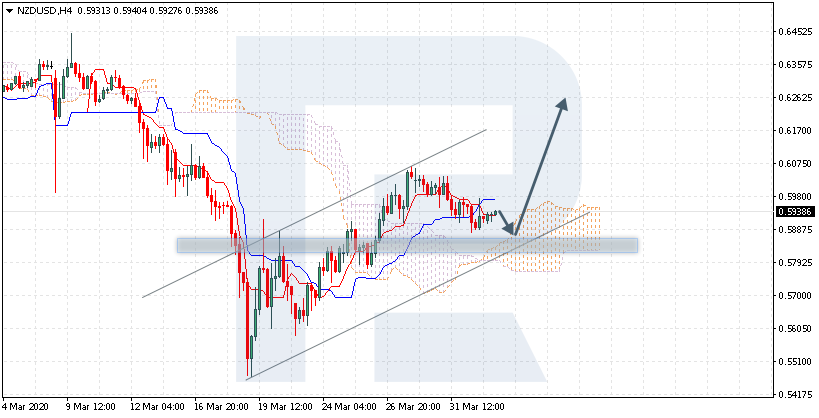
NZDUSD is trading at 0.5938; the instrument is moving above Ichimoku Cloud, thus indicating an ascending tendency. The markets could indicate that the price may test the cloud’s upside border at 0.5885 and then resume moving upwards to reach 0.6265. Another signal to confirm further ascending movement is the price’s rebounding from the rising channel’s downside border. However, the scenario that implies further growth may be canceled if the price breaks the cloud’s downside border and fixes below 0.5695. In this case, the pair may continue falling towards 0.5605.
Attention! Forecasts presented in this section only reflect the author’s private opinion and should not be considered as guidance for trading. RoboForex LP bears no responsibility for trading results based on trading recommendations described in these analytical reviews.
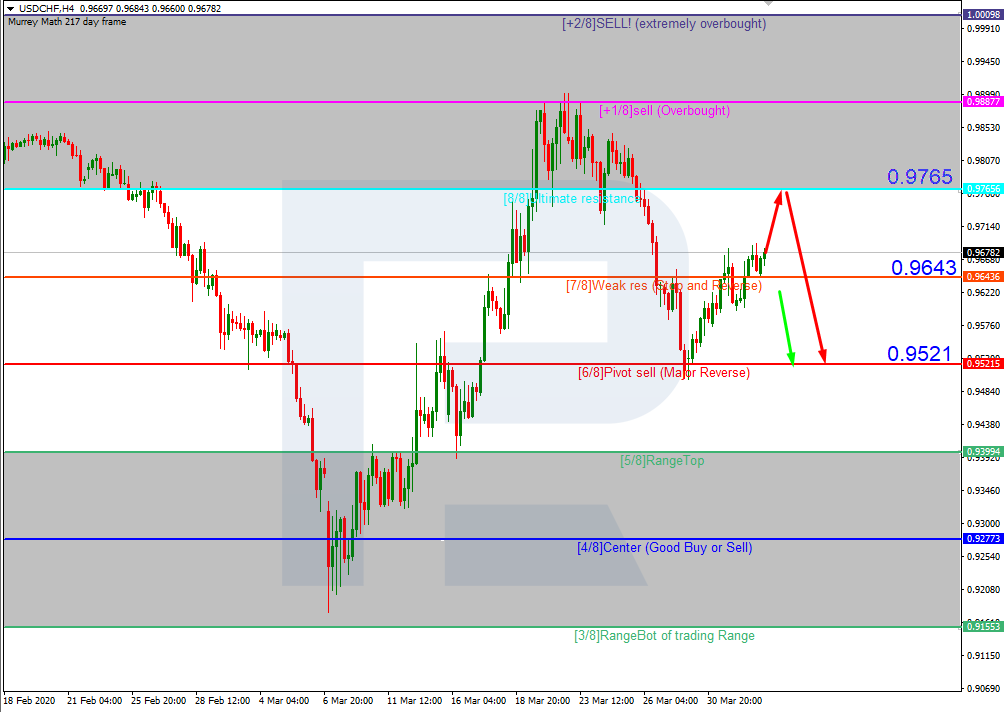
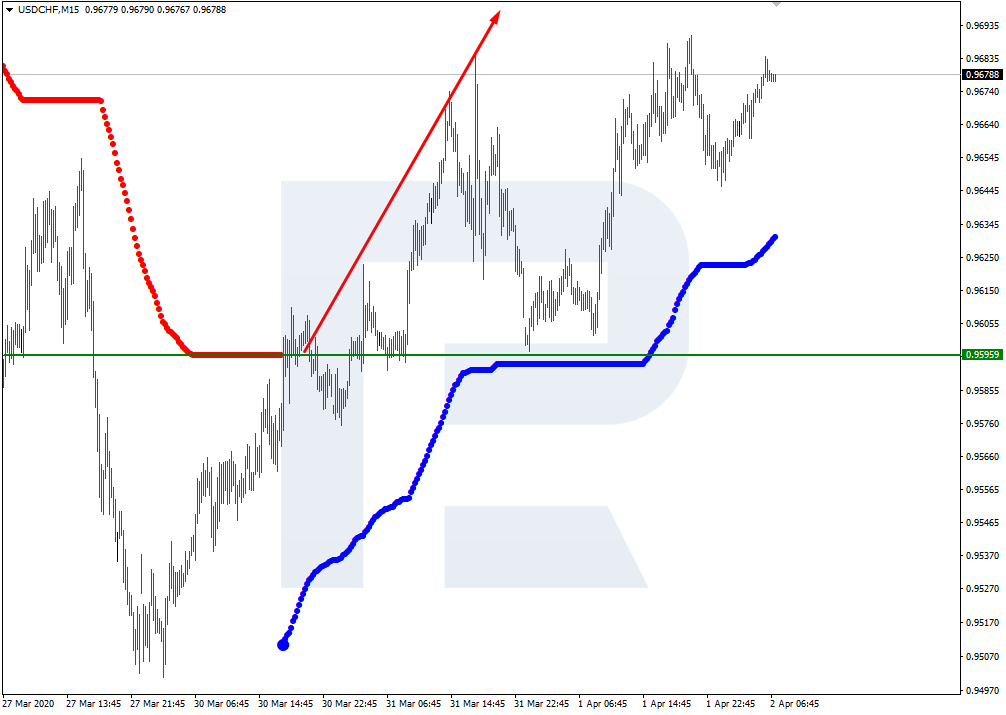
In the H4 chart, USDCHF is trading above 7/8. In this case, the price is expected to continue growing towards the resistance at 8/8. However, this scenario may no longer be valid if the price breaks 7/8 to the downside. After that, the instrument may continue falling to reach the support at 6/8.
As we can see in the M15 chart, the pair has broken the upside line of the VoltyChannel indicator and, as a result, may continue the ascending tendency towards 8/8 from the H4 chart.
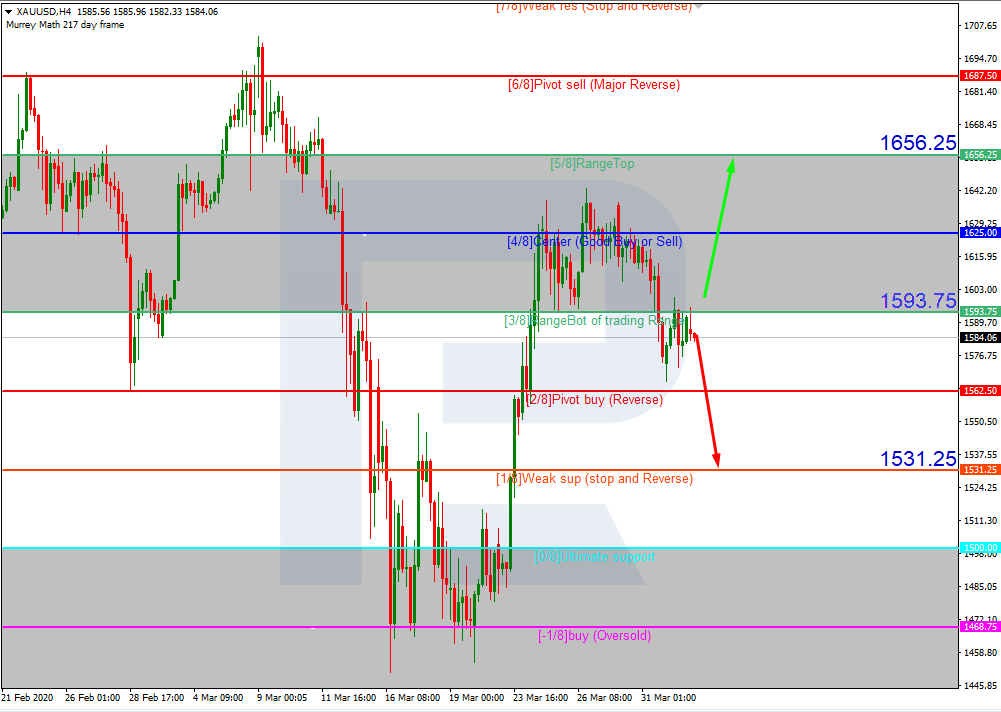
XAUUSD, “Gold vs US Dollar”
In the H4 chart, XAUUSD is trading below 3/8. In this case, the price is expected to continue falling to reach the support at 1/8. However, this scenario may no longer be valid if the price breaks 3/8 to the upside. After that, the instrument may continue growing towards the resistance at 5/8.
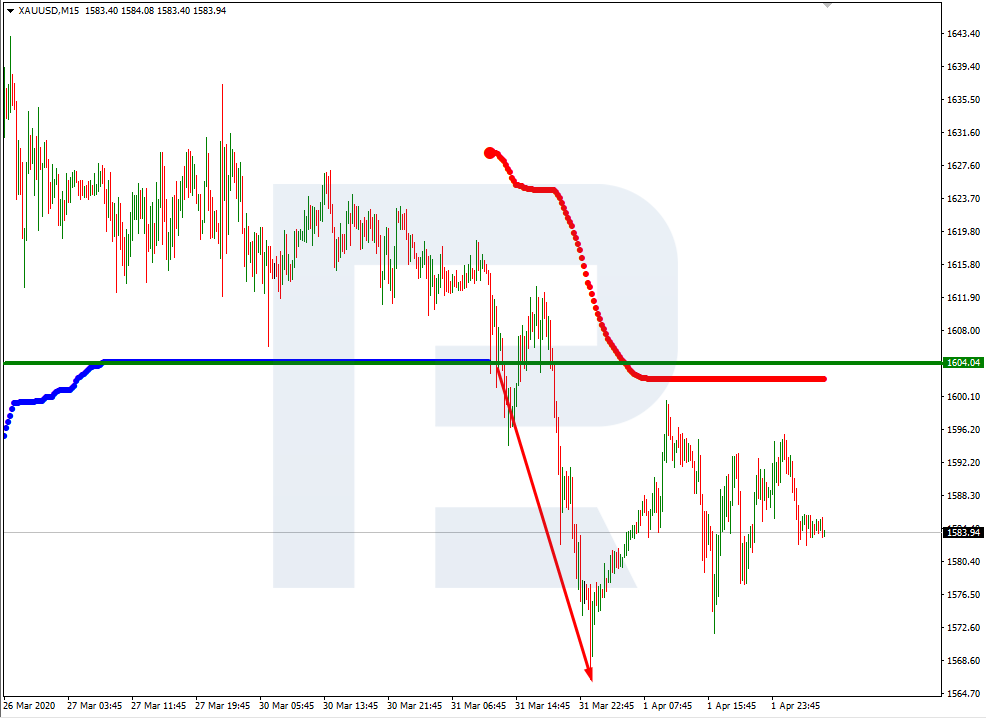
As we can see in the M15 chart, the pair has broken the downside line of the VoltyChannel indicator and, as a result, may continue trading downwards to reach 1/8 from the H4 chart.
Attention! Forecasts presented in this section only reflect the author’s private opinion and should not be considered as guidance for trading. RoboForex LP bears no responsibility for trading results based on trading recommendations described in these analytical reviews.
During yesterday’s trading session, the US dollar started to grow against a basket of major currencies. The dollar index (#DX) closed in the green zone (+0.67%). At the moment, currency majors are consolidating. Investors began trading currencies, which are considered more reliable. The COVID-19 epidemic continues to impact the global economy negatively. Earlier this week, US President Donald Trump announced that the United States would have to endure “painful two weeks” in the fight against COVID-19 before the trend tends to improve. Today, the number of coronavirus cases in the United States is 216,722. In total, there are already 939,436 cases in the world.
Today, investors expect a report on initial jobless claims in the United States. Experts expect that the number of Americans applying for jobless claims is likely to hit a record high for the second week in a row, as more and more states announce quarantine and insist residents stay at home. All these measures are aimed at containing the coronavirus pandemic, which, according to economists, has already pushed the world economy into recession.
The “black gold” prices have started recovering. At the moment, futures for the WTI crude oil are testing the $22.25 mark per barrel.
Market indicators
Yesterday, there were aggressive sales in the US stock market: #SPY (-4.50%), #DIA (-4.49%), #QQQ (-4.25%).
The 10-year US government bonds yield fell again. At the moment, the indicator is at the level of 0.60-0.61%.
The news feed on 2020.04.02:
– Initial jobless claims in the US at 15:30 (GMT+3:00).
Sales prevail on the EUR/USD currency pair. Quotes have updated local lows. The COVID-19 pandemic continues to impact the global economy negatively. Donald Trump announced the upcoming “painful” two-week fight against coronavirus. At the moment, EUR/USD quotes are consolidating in the range of 1.08900-1.09700. We recommend opening positions from these marks.
The Economic News Feed for 02.04.2020:
At 15:30 (GMT+3:00), data on initial jobless claims will be published in the US.
Indicators do not give accurate signals: the price has fixed between 50 MA and 100 MA.
The MACD histogram is in the negative zone, but above the signal line, which gives a weak signal to sell EUR/USD.
Stochastic Oscillator is in the neutral zone, the %K line has crossed the %D line. There are no signals at the moment.
Trading recommendations
Support levels: 1.08900, 1.08000
Resistance levels: 1.09700, 1.10400, 1.11400
If the price fixes below 1.08900, the EUR/USD currency pair is expected to fall. The movement is tending to the round level of 1.08000.
An alternative could be the growth of EUR/USD quotes to 1.10300-1.10800.
The GBP/USD currency pair
Technical indicators of the currency pair:
Prev Open: 1.24140
Open: 1.23771
% chg. over the last day: -0.33
Day’s range: 1.23664 – 1.24318
52 wk range: 1.1466 – 1.3516
The British pound is still being traded in a prolonged flat. There is no defined trend. Since the beginning of this week, the following key support and resistance levels have been formed: 1.23000 and 1.24800, respectively. Financial market participants expect additional drivers. Today, investors will assess important statistics from the UK and the US. Positions should be opened from key levels.
At 11:30 (GMT+3:00), UK construction PMI will be published.
Indicators do not give accurate signals: the price has crossed 50 MA.
The MACD histogram is near the 0 mark.
Stochastic Oscillator is in the neutral zone, the %K line has started crossing the %D line. There are no signals at the moment.
Trading recommendations
Support levels: 1.23000, 1.21450, 1.20150
Resistance levels: 1.24800, 1.25500
If the price fixes below the round level of 1.23000, GBP/USD quotes is expected to fall. The movement is tending to 1.22000-1.21000.
An alternative could be the growth of the GBP/USD currency pair to 1.25500-1.26000.
The USD/CAD currency pair
Technical indicators of the currency pair:
Prev Open: 1.40648
Open: 1.41923
% chg. over the last day: +0.91
Day’s range: 1.40787 – 1.41964
52 wk range: 1.2949 – 1.4668
There is an ambiguous technical pattern on the USD/CAD currency pair. A trading instrument is in a sideways trend with a fairly wide range. At the moment, the local support and resistance levels are 1.40800 and 1.42000, respectively. The recovery of the “black gold” prices support the loonie. USD/CAD quotes are tending to decline. Positions should be opened from key levels.
The news feed on Canada’s economy is calm.
Indicators signal the power of sellers: the price has fixed below 50 MA and 100 MA.
The MACD histogram has moved into the negative zone, which indicates the development of bearish sentiment.
Stochastic Oscillator is in the neutral zone, the %K line is below the %D line, which gives a signal to sell USD/CAD.
Trading recommendations
Support levels: 1.40800, 1.40100, 1.39250
Resistance levels: 1.42000, 1.42700, 1.43350
If the price fixes below 1.40800, USD/CAD quotes are expected to fall. The movement is tending to 1.40100-1.39500.
An alternative could be the growth of the USD/CAD currency pair to 1.42500-1.43000.
The USD/JPY currency pair
Technical indicators of the currency pair:
Prev Open: 107.498
Open: 107.154
% chg. over the last day: -0.35
Day’s range: 107.040 – 107.568
52 wk range: 101.19 – 112.41
USD/JPY quotes continue to consolidate. There is no defined trend. At the moment, the local support and resistance levels are 107.000 and 107.650, respectively. Demand for the “safe haven” currencies is still high. The USD/JPY currency pair has the potential for further decline. We recommend paying attention to the dynamics of the US government bonds yield. Positions should be opened from key levels.
The news feed on Japan’s economy is calm.
Indicators do not give accurate signals: the price is consolidating near 50 MA.
The MACD histogram is near the 0 mark.
Stochastic Oscillator is in the neutral zone, the %K line is below the %D line, which indicates the bearish sentiment.
Trading recommendations
Support levels: 107.000, 106.500
Resistance levels: 107.650, 108.250, 108.700
If the price fixes below 107.000, a further drop in the USD/JPY quotes is expected. The movement is tending to 106.500-106.200.
An alternative could be the growth of the USD/JPY currency pair to 108.000-108.500.
House Price Index rose in Britain in March: nationwide HPI rose 0.8% after 0.3% gain in February, when no change was expected. This is bullish for GBPUSD.
On Wednesday the 1st of April, trading on the euro closed down, with the EURUSD pair sliding to 1.0903. Pressure was piled on the euro in the US session during President Trump’s press conference. He warned of a tough couple of weeks ahead. Investors are nervous over the serious toll that COVID-19 has taken on the global economy. Manufacturing production has slowed down, and economies around the world are expecting a drop in GDP.
We correctly predicted yesterday’s trajectory. The bears went on the offensive in the European session, bringing the rate down to 1.0903. From there, the pair began a recovery towards the balance line.
The pair is currently trading at 1.0935. Today’s central focus will be the US report on initial jobless claims, where around 3.5 million new people are expected to have made claims for unemployment benefits. Markets have already factored in this pessimistic prediction. If the actual figure turns out to be closer to 5 million, we can expect to see a sharp decline on the US dollar across the board. It’s difficult to say with any certainty what the actual figure will be, so there’s a lot of uncertainty surrounding the market at the moment. This isn’t helped by the fact that the NFP report comes out tomorrow.
Let’s see if we can find a link between the technicals and fundamentals. Since we didn’t see a sharp rebound from 1.0930, we may see some cleaning take place, which could then take us up to 1.1040. This would be the ideal scenario for today. There may not be any fresh lows, and we may even get a double bottom model. It would be better for the bulls to see three lower lows, which would provide more growth potential. However, if 1.0883 doesn’t hold up, the bears will power through to 1.0815.
By Hussein Sayed, Chief Market Strategist (Gulf & MENA), ForexTime
Investors have suffered a tough start to the second quarter due to the coronavirus pandemic. After climbing 17.9% from its low in the past seven trading days, the S&P 500 kicked off the new quarter with a 4.4% decline.
It seems most of the global fiscal and monetary stimulus measures have been priced in and the things that matter most at this stage are the infection and death rates of Covid-19.
Psychology has a great impact on asset prices, and with more people realizing that the virus could reach them in some way or have already infected someone they know, that’s a good enough reason for explaining why risk assets are unloved.
The upward move in equities we’ve seen over the past week may prove to be a temporary recovery, a dead cat bounce or a bear market rally. Call it whatever you like, but as long as infection rates continue to grow at the current pace, this more or less guarantees weak economic performance going forward and a collapse in earnings.
With global infections likely to reach one million later today and deaths surpassing 50,000, investors are focusing on capital preservation and are looking to return to cash. That suggests another leg lower in equity prices over the next couple of weeks, until investors have a better understanding on how the current crisis will end.
Of course, no one knows with certainty how bad this pandemic will impact global economies and corporate earnings. But it is obvious that corporate buybacks, a major component of the past decade’s bull market, will be missing in 2020 and probably in 2021 depending on how long the crisis persists. These buybacks have been by far the greatest course of demand for stocks since the 2008 crisis.
While some investors may want to take this opportunity of extreme pessimism to begin accumulating stocks, they may soon realize that we haven’t reached the capitulation stage yet. That is when investors surrender or give up trying to recapture lost gains as a result of falling stock prices and is generally considered to be a sign of a bottom in prices.
Today’s US weekly jobless claims release for the week ending March 28 is going to be of more importance than Friday’s non-farm payrolls report. That’s because the NFP will only include data through March 14, so it doesn’t reflect the impact of the last two weeks when millions of Americans filed for unemployment benefits.
Jobless claims may have risen 3 – 5 million in the past week, and we could even see a higher revision of the last week’s 3.28 million print. That suggests April’s NFP may show job losses in 8 digits, which could turn out to be the darkest day ever in the US job market.
Disclaimer: The content in this article comprises personal opinions and should not be construed as containing personal and/or other investment advice and/or an offer of and/or solicitation for any transactions in financial instruments and/or a guarantee and/or prediction of future performance. ForexTime (FXTM), its affiliates, agents, directors, officers or employees do not guarantee the accuracy, validity, timeliness or completeness, of any information or data made available and assume no liability as to any loss arising from any investment based on the same.
US stock market retreat continued on Tuesday with weak data providing little support for market sentiment as investors wonder when the US can return to usual business. Uncertainty about how long the shutdown may last increased as President Trump warned that a “very, very painful” two weeks lied ahead for the country. The S&P 500 lost 4.4% to 2470.50. The Dow Jones industrial average fell 4.4% to 20943.51. Nasdaq slumped 4.4% to 7360.58. The dollar weakening halted as the Institute for Supply Management reported US manufacturing index fell to 49.1 in March from 50.1 in February when a drop to 44.9 was forecast. The live dollar index data show the ICE US Dollar index, a measure of the dollar’s strength against a basket of six rival currencies, rebounded 0.5% to 99.52 but is lower currently. Futures point to higher market openings today.
CAC 40 led European indexes slump
European stocks extended losses on Wednesday with risk appetite getting little boost from weak economic data. The GBP/USD joined EUR/USD’s accelerated sliding yesterday, with Pound reversing higher currently. The Stoxx Europe 600 ended down 3% led by travel/leisure shares as euro zone manufacturing purchasing managers’ index fell again in March, hitting a 92-month low of 44.5. Germany’s DAX 30 lost 3.9% to 9544.75. France’s CAC 40 dropped 4.3% while UK’s FTSE 100 slumped 3.8% to 5454.57.
Australia’s All Ordinaries Index leads Asian indexes slump
Asian stock indices are mixed today after another down session on Wall Street overnight following President Trump’s warning as many as 240,000 Americans might die of the coronavirus. Nikkei fell 1.4% to 117818.72 despite resumed yen sliding against the dollar. Markets in China are rising: Shanghai Composite Index is 1.7% higher while Hong Kong’s Hang Seng Index is up 0.6%. Australia’s All Ordinaries Index however slumped 2.0% as Australian dollar resumed climbing against the greenback.
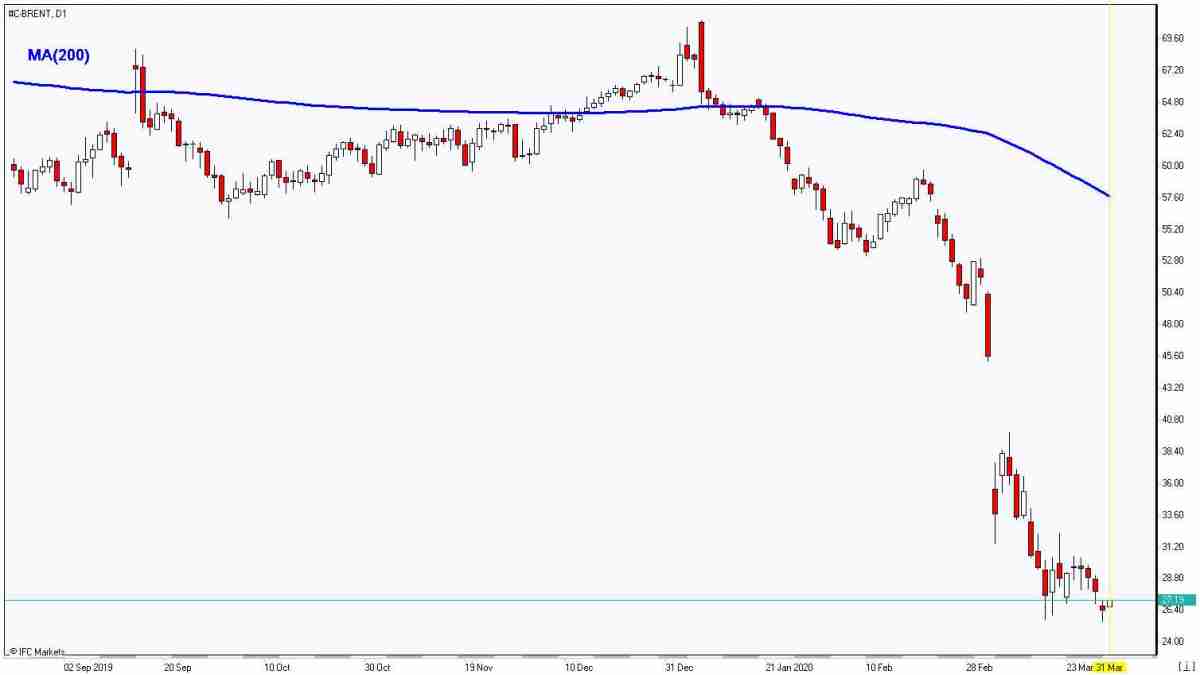
Brent jumps after Trump says Russia-Saudi disagreement can be resolved
Brent futures prices are rebounding today after president Trump said about Russia and Saudi Arabia disagreement on output reduction “I have confidence in both that they’ll be able to work it out”. Prices fell yesterday as the Energy Information Administration reported US crude oil inventories rose by bigger than expected 13.8 million barrels last week, tenth weekly rise in a row: June Brent dropped 6.1% to $24.74 on Wednesday.
Gold edges up on weaker Dollar
Gold prices are edging higher today after a retreat on Wednesday. June gold price of an ounce of gold slipped 0.3% to $1591.40 on Wednesday.
Note: This overview has an informative and tutorial character and is published for free. All the data, included in the overview, are received from public sources, recognized as more or less reliable. Moreover, there is no guarantee that the indicated information is full and precise. Overviews are not updated. The whole information in each overview, including opinion, indicators, charts and anything else, is provided only for familiarization purposes and is not financial advice or а recommendation. The whole text and its any part, as well as the charts cannot be considered as an offer to make a deal with any asset. IFC Markets and its employees under any circumstances are not liable for any action taken by someone else during or after reading the overview.