The US dollar lost ground against its major rivals in Tuesday trading, as glimmers of hope over the coronavirus lifted risk appetite among investors. The greenback had rallied sharply since March 9th as fears spiked over the economic consequences of lockdowns across the globe. However, signs of a slowdown in the spread of coronavirus prompted flows into risk-sensitive currencies such as the Australian dollar, while safe havens such as gold and the US dollar traded lower.
Data from Johns Hopkins University shows that coronavirus COVID-19 global cases have risen to 1,350,841, with 74,870 fatalities. Hopes were lifted after hard hit Italy reported its lowest daily COVID-19 death toll for more than two weeks on Sunday. Italy’s ISS national health institute director Silvio Brusaferro told reporters, “The curve has started its descent and the number of deaths has started to drop”. He added “If these data are confirmed (in the coming days), we will have to start thinking about phase two”, suggesting that authorities are beginning to think about easing lockdowns.
Meanwhile, the United Kingdom is on edge after Boris Johnson spent the night in intensive care at a central London hospital after his coronavirus symptoms worsened. Numerous world leaders expressed their well wishes, with French President Emmanuel Macron tweeting Monday: “I send all my support to Boris Johnson, to his family and to the British people at this difficult moment. I wish him a speedy recovery at this testing time.”
Global equity markets traded higher in early trading on Tuesday, lifted by signs of the pandemic slowing and also by rising hope that the world’s biggest producers of crude oil will agree to cut output. The euro snapped a six day losing streak against the dollar, rallying over 100 pips as confidence over Eurozone prospects increased. Looking at the EUR/USD daily chart we can see resistance overhead at the 50 period SMA currently at 1.0973, while support lies below in the area of 1.0776.
EUR/USD quotes have been growing after a prolonged fall. The trading instrument has updated local highs. At the moment, the EUR/USD currency pair is testing the 1.08800 mark. The level of 1.08250 is already a “mirror” support. The technical pattern signals a further recovery of the single currency. Today, senior eurozone officials should hold a videoconference to agree on economic measures in the context of the COVID-19 epidemic. Positions should be opened from key support and resistance levels.
The publication of important economic releases is not expected.
Indicators do not give accurate signals: the price has fixed between 50 MA and 100 MA.
The MACD histogram has started to rise, indicating the development of bullish sentiment.
Stochastic Oscillator is in the overbought zone, the %K line has crossed the %D line. There are no signals at the moment.
Trading recommendations
Support levels: 1.08250, 1.07750
Resistance levels: 1.08800, 1.09200, 1.09700
If the price fixes above 1.08800, further growth of the EUR/USD currency pair is expected. The movement is tending to 1.09200-1.09500.
An alternative could be a drop in the EUR/USD quotes to 1.07900-1.07700.
The GBP/USD currency pair
Technical indicators of the currency pair:
Prev Open: 1.22341
Open: 1.22303
% chg. over the last day: +0.10
Day’s range: 1.21643 – 1.23472
52 wk range: 1.1466 – 1.3516
There is an ambiguous technical pattern on the GBP/USD currency pair. The British pound is being traded in a flat. Financial market participants expect additional drivers. At the moment, the local support and resistance levels are 1.22500 and 1.23450, respectively. British Prime Minister Boris Johnson has been moved to intensive care unit after his COVID-19 symptoms worsened. We recommend opening positions from key levels.
The news feed on the UK economy is quite calm.
Indicators do not give accurate signals: the price has crossed 50 MA and 100 MA.
The MACD histogram is near the 0 mark.
Stochastic Oscillator is in the overbought zone, the %K line has crossed the %D line. There are no signals at the moment.
Trading recommendations
Support levels: 1.22500, 1.21650, 1.20500
Resistance levels: 1.23450, 1.24250, 1.24800
If the price fixes below 1.22500, GBP/USD is expected to fall. The movement is tending to 1.21700-1.21200.
An alternative could be the growth of the GBP/USD currency pair to 1.24250-1.24800.
The USD/CAD currency pair
Technical indicators of the currency pair:
Prev Open: 1.42242
Open: 1.41104
% chg. over the last day: -1.01
Day’s range: 1.40123 – 1.41432
52 wk range: 1.2949 – 1.4668
The USD/CAD currency pair has been declining after a prolonged consolidation. The trading instrument has updated local lows. At the moment, USD/CAD quotes are testing support of 1.40100. The 1.41000 round level is already a “mirror” resistance. The recovery of oil quotes supports the loonie. The Canadian dollar has the potential to further strengthen against the greenback. Positions should be opened from key levels.
At 17:00 (GMT+3:00), Ivey PMI will be published in Canada.
Indicators do not give accurate signals: 50 MA has crossed 100 MA.
The MACD histogram is in the negative zone and below the signal line, which gives a strong signal to sell USD/CAD.
Stochastic Oscillator is in the oversold zone, the %K line has crossed the %D line. There are no signals at the moment.
Trading recommendations
Support levels: 1.40100, 1.39250
Resistance levels: 1.41000, 1.41750, 1.42600
If the price fixes below 1.40100, a further drop in the USD/CAD quotes is expected. The movement is tending to 1.39500-1.39000.
An alternative could be the growth of the USD/CAD currency pair to 1.41500-1.42000.
The USD/JPY currency pair
Technical indicators of the currency pair:
Prev Open: 108.350
Open: 109.216
% chg. over the last day: +0.46
Day’s range: 108.672 – 109.280
52 wk range: 101.19 – 112.41
The USD/JPY currency pair has become stable. The trading instrument is currently consolidating. There is no defined trend. USD/JPY quotes are testing local support and resistance levels: 108.700 and 109.300, respectively. Investors expect additional drivers. We recommend paying attention to the dynamics of US government bonds yield. Positions should be opened from key levels.
The news feed on Japan’s economy is calm enough.
Indicators do not give accurate signals: the price has crossed 50 MA.
The MACD histogram is near the 0 mark.
Stochastic Oscillator is in the neutral zone, the %K line is above the %D line, which indicates the bullish sentiment.
Trading recommendations
Support levels: 108.700, 108.200, 107.600
Resistance levels: 109.300, 110.100
If the price fixes above 109.300, further growth of USD/JPY quotes is expected. The movement is tending to 110.000-110.200.
An alternative could be a decrease in the USD/JPY currency pair to 108.200-107.800.
The United States Department of Agriculture (USDA) expects cotton yields in the 2020/21 season to be 28.78 million bales (480 pounds each). This is 2% less than in the previous season. The decrease is due to the reduction in agricultural land allotted for cotton in India. Note that Indian farmers mention a shortage of labor in agriculture due to quarantine announced by the government amidst the coronavirus pandemic. This may become an additional reason of India’s yields reduction. This country is the 2nd cotton producer in the world after China.
By Hussein Sayed, Chief Market Strategist (Gulf & MENA), ForexTime
– The world has finally seen a glimpse of light at the end of this dark tunnel. The coronavirus outbreak is starting to level off across many countries and cities. Looking at the new daily infected cases and death toll from Spain, Italy, Germany and France, all of those countries seem to be heading into a downward trajectory. Meanwhile, in the US, the governors of New York, Louisiana and New Jersey pointed to cautious signs that the virus outbreak may be starting to flatten.
It saddens me to use a ‘death’ indicator as a financial market tool, but that’s what’s driving investors at the moment. The declining number of deaths registered due to COVID-19 suggests that we are winning the fight against this horrible virus. Total death rates had decreased from 13% at the start of April to 7% yesterday. That’s the first time we have seen a single-digit number since March 14.
The drop in newly infected cases and death toll sparked a sharp rally in equities, with US stocks registering its best day in a fortnight – and its eight best day since the end of the second world war – as the S&P 500 and Dow Jones Industrial Average both rallied more than 7% on Monday. At this stage, markets are repricing the worst-case scenario due to the virus outbreak, but in my opinion, it’s still too early to justify a prolonged move higher.
Investors moving into risk assets at this stage believe that we’re heading into a V-shaped recovery. Attractive valuations, ‘fear of missing out’ and extraordinary stimulus packages also exaggerate the upside moves in prices. However, no one yet knows the exact damage this virus has already done to the global economy, corporate earnings, and what kind of exit strategies countries will follow in the weeks ahead. Without proper treatment or vaccination, lockdowns could be reimposed and the global economy will then continue to suffer. The corporate earnings outlook is also very murky as the dispersion of analysts’ forecasts are near a record high. Hence, the road ahead won’t be a smooth one, especially as investors still need to digest a mountain of negative economic data and possibly many bankruptcies.
In my opinion, the best-case scenario is likely to be a U-shaped recovery and not a V-shaped one. The world post-coronavirus is not going to be the same for a long time to come. Social behaviour needs time to return back to normal which means the service sector will continue to feel the pain. For now, let’s hope that we beat the coronavirus and it becomes just a memory of the past.
Disclaimer: The content in this article comprises personal opinions and should not be construed as containing personal and/or other investment advice and/or an offer of and/or solicitation for any transactions in financial instruments and/or a guarantee and/or prediction of future performance. ForexTime (FXTM), its affiliates, agents, directors, officers or employees do not guarantee the accuracy, validity, timeliness or completeness, of any information or data made available and assume no liability as to any loss arising from any investment based on the same.
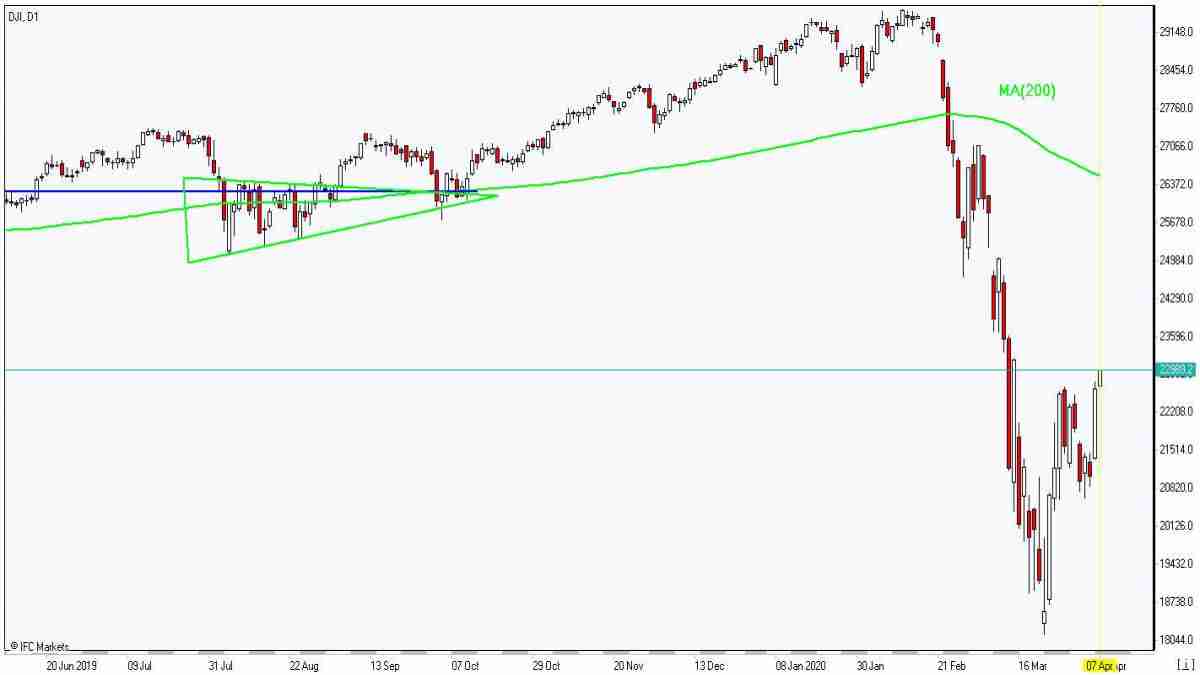
Markets rallied on hopes coronavirus is stabilizing
US stock market rallied on Monday on hopes coronavirus outbreak is stabilizing after reports of first decline in fatalities in New York City, the center of the pandemic in US. The S&P 500 jumped 7% to 2663.68. Dow Jones industrial soared 7.7% to 22679.99 led by 19.5% jump in Boeing. The Nasdaq gained 7.3% to7373.08. The dollar strengthening slowed as the New York Federal Reserve said that its commercial security funding facility will begin on April 14, purchasing commercial securities issued by corporations, banks and municipalities: the live dollar index data show the ICE US Dollar index, a measure of the dollar’s strength against a basket of six rival currencies, added 0.2% to 100.77 but is lower currently. Futures are rising currently.
DAX 30 led European indexes rebound
European stocks rebounded on Monday as Spain, Italy and Germany reported declining number of coronavirus cases. Both EUR/USD and GBP/USD reversed sliding yesterday with both pairs higher currently. The Stoxx Europe 600 index advanced 3.8% led by auto shares. The DAX 30 jumped 5.8% to 10075.17. France’s CAC 40 advanced 4.6% and UK’s FTSE 100 gained 3.1% to 5582.39 as Prime Minister Boris Johnson said he was “in good spirits” and had visited the hospital for “routine tests” Sunday.
Asian indexes rise while Australia’s All Ordinaries Index falls
Asian stock indices are higher today following the rally on Wall Street overnight. Nikkei rose 2% to 18950.18 despite resumed yen climbing against the dollar. Markets in China are rising as authorities reported no new deaths from the coronarivus over the past 24 hours and 32 new cases: the Shanghai Composite Index is up 2% and Hong Kong’s Hang Seng Index is 1.8% higher. Australia’s All Ordinaries Index however pulled back 0.7% as Australian dollar’s climb against the greenback continued while Reserve Bank of Australia left interest rates unchanged at 0.25% and warned the economy will be hit hard by the corona pandemic in the second quarter.
Brent futures prices are edging higher after a pullback on Monday. Prices slumped yesterday as the meeting between Organization of the Petroleum Exporting Countries and Russia was tentatively shifted to Thursday: June Brent crude closed 3.1% lower at $33.05 a barrel on Monday.
Gold advances as Dollar resumes weakening
Gold prices are extending gains today. June gold rose 2.9% to $1693.9 an ounce on Monday.
Note: This overview has an informative and tutorial character and is published for free. All the data, included in the overview, are received from public sources, recognized as more or less reliable. Moreover, there is no guarantee that the indicated information is full and precise. Overviews are not updated. The whole information in each overview, including opinion, indicators, charts and anything else, is provided only for familiarization purposes and is not financial advice or а recommendation. The whole text and its any part, as well as the charts cannot be considered as an offer to make a deal with any asset. IFC Markets and its employees under any circumstances are not liable for any action taken by someone else during or after reading the overview.
In conversation with Maurice Jackson of Proven and Probable, the CEO of Millrock Resources describes the company’s latest news.
Maurice Jackson: Today we will find out the latest developments from Millrock Resources Inc. (MRO:TSX.V; MLRKF:OTCQB) regarding drilling and assay results on the 64 North Gold Project, located in the prolific Tintina gold province in Alaska. Joining us for a conversation is Gregory Beischer, the CEO of Millrock Resources.
Sir, for someone new to Millrock Resources, please introduce the opportunity the company presents to the market.
Gregory Beischer: Millrock is a generative, early-stage exploration company. We look for gold and copper and other metals primarily here in Alaska, which is my home base. And the idea is to find a giant ore deposit and sell it to a major mining company, hopefully making a fortune for our shareholders in the process.
Maurice Jackson: Millrock has an expansive property bank, with projects in Alaska, British Columbia and Mexico, along with royalty-in-equity positions in other companies. Focusing on the former, take us to Alaska, where Millrock has generated quite a bit of excitement, I should say, in the market. Introduce the 64 North Gold Project.
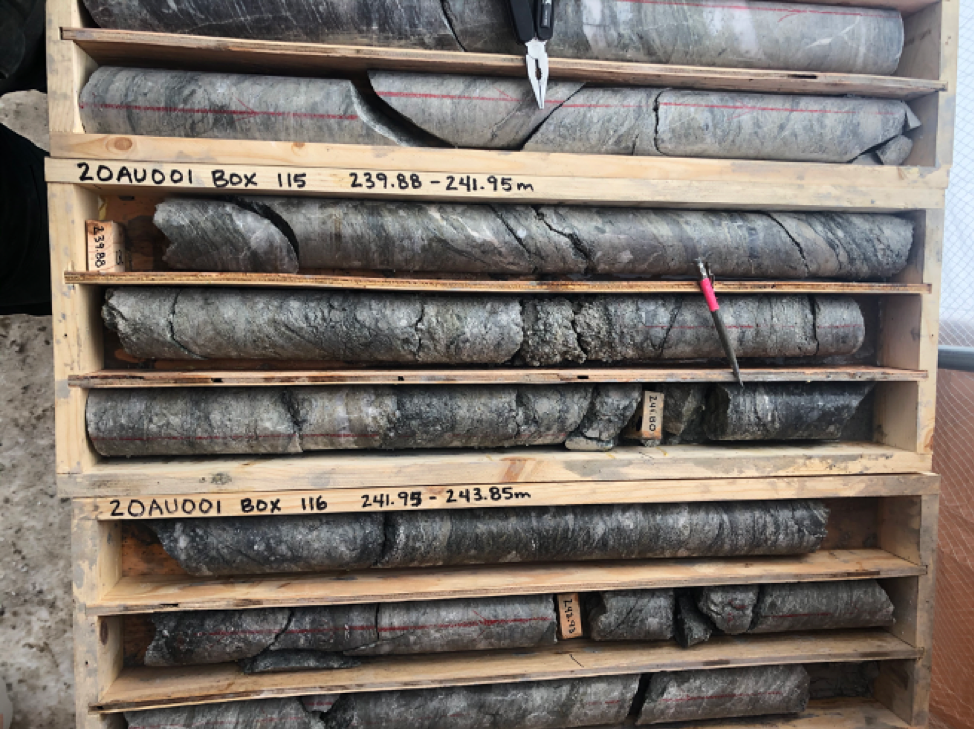
Gregory Beischer: It really is a great project. We’ve built a huge land position that surrounds the Pogo Gold Mine. We have two highly compelling drill targets adjacent [to]in fact, within sight ofthe Pogo Mine. On March 8, we initiated the first drilling program to test the targets we’ve developed. Unfortunately, we’ve had to curtail the drilling. The contractor decided that it was best to retrench his workers back to their home base of Idaho before any travel restrictions were instituted. He didn’t want his people stranded in Alaska.
So, unfortunately, it meant that we had to pause the program. Fortunately for our shareholders, we were able to complete one hole in full and part of a second one. And I would say that we’re quite encouraged by what we saw in the first drill core out of the project. [For press release click here.]
Maurice Jackson: Well, you stole the thunder from my next question, which was how are operations being affected by the coronavirus? But let me ask you this, from a team perspective, has anyone been affected?
Gregory Beischer: No. Thankfully everyone is completely healthy. All of the technical and admin staff are working from home. And you know, it’s just a bit unfortunate because the reality is the drill crew and geologists that we had on site were probably some of the safest people on earth. They were completely isolated from the rest of the human population, with almost no interaction with the outside world. So tough calls to make, but that’s the call that the contractor made. And so we’ve got to live with that.
This is really uncharted territory for all of us and we just have to make the best possible decisions we can going forward. The mayor of Anchorage made what I thought was quite a good statement a week or 10 days ago when he said that, “We’ll never know if we overreacted or we reacted too soon, but we’ll definitely know if we under reacted or didn’t do enough.” I think those are good words to live by in the current environment.
Maurice Jackson: Well, if you’re going to panic, panic early. Mr. Beischer, let me ask you this: You stated that you cleared the first drill hole. What do you plan to do with that in the duration of this pause right now?
Gregory Beischer: We have the core back in our core logging facility in Fairbanks, Alaska. We logged the entire first hole. We’re in the process now of cutting that core in half. Half of it, of course, will go into the assay laboratory, so that they can tell us exactly how much gold is in the core. The other half is retained for visual observations going forward. So that is completed. Those samples should be going into the laboratory today. So we’re looking at assay results to be received about a month from now.
Maurice Jackson: Sounds quite encouraging. In closing, Mr. Beischer, what message would you like to share with the shareholders?
Gregory Beischer: Well, I would say, Maurice, it really was quite encouraging visually. The core looked excellent. It was just what we were looking for. We saw an abundance of quartz veins transecting the rocks; there was strong wall rock alteration around those veins; and, best of all, there was obvious sulfide mineralizationpyrite, arsenal pyrite and, in one case, a little bit of bismuthaniteand all three of those elements are excellent indicators of gold in the general region.
In fact, if you were to lay this drill hole out beside drill holes that pierce the Pogo Gold Mine itself, I don’t think you’d be able to tell the difference. To me it looks absolutely identical. I’ve seen holes from Pogo and this one looks just the same in the character and style of the mineralization.
Now, I have to be careful about these statements. Just because it looks just like a gold mine next door does not necessarily mean that Millrock has discovered a mine. But I would say we are highly encouraged by what we’ve seen on a visual basis. I don’t want to overpromote this, and I don’t want to be too hopeful, because it all comes down to the assay results. You never really know until you have those results in hand. But certainly, on a visual basis, we’re quite encouraged by what we’ve seen.
Maurice Jackson: Mr. Beischer, for someone listening that wants to get more information on Millrock Resources, please share the contact details.
Gregory Beischer: Yes, of course. You can contact Melanie Henderson of investor relations at Millrock. You can easily get her contact information from our website and that’s www.millrockresources.com.
Maurice Jackson: Millrock Resources trades TSX.V under the ticker MRO and on the OTCQB as MLRKF. Millrock Resources is a sponsor of Proven and Probable, and we are proud shareholders for the virtues conveyed in today’s message.
And as a reminder, I’m a licensed representative for Miles Franklin Precious Metals Investments,where we provide a number of options to expand your precious metals portfolio from physical delivery, offshore depositories, precious metal IRAs and private blockchain distributed ledger technology. Call me directly at (855) 505-1900, or you may e-mail [email protected].
Finally, please subscribe to www.provenandprobable.com, where we provide mining insights and bullion sales. Subscription is free.
Gregory Beischer of Millrock Resources, thank you for joining us today on Proven and Probable.
Maurice Jackson is the founder of Proven and Probable, a site that aims to enrich its subscribers through education in precious metals and junior mining companies that will enrich the world.
Disclosure: 1) Maurice Jackson: I, or members of my immediate household or family, own shares of the following companies mentioned in this article: Millrock Resources. I personally am, or members of my immediate household or family are, paid by the following companies mentioned in this article: None. My company has a financial relationship with the following companies mentioned in this article: Millrock Resources is a sponsor of Proven and Probable. Proven and Probable disclosures are listed below. 2) The following companies mentioned in this article are billboard sponsors of Streetwise Reports: None. Click here for important disclosures about sponsor fees. 3) Statements and opinions expressed are the opinions of the author and not of Streetwise Reports or its officers. The author is wholly responsible for the validity of the statements. The author was not paid by Streetwise Reports for this article. Streetwise Reports was not paid by the author to publish or syndicate this article. The information provided above is for informational purposes only and is not a recommendation to buy or sell any security. Streetwise Reports requires contributing authors to disclose any shareholdings in, or economic relationships with, companies that they write about. Streetwise Reports relies upon the authors to accurately provide this information and Streetwise Reports has no means of verifying its accuracy. 4) This article does not constitute investment advice. Each reader is encouraged to consult with his or her individual financial professional and any action a reader takes as a result of information presented here is his or her own responsibility. By opening this page, each reader accepts and agrees to Streetwise Reports’ terms of use and full legal disclaimer. This article is not a solicitation for investment. Streetwise Reports does not render general or specific investment advice and the information on Streetwise Reports should not be considered a recommendation to buy or sell any security. Streetwise Reports does not endorse or recommend the business, products, services or securities of any company mentioned on Streetwise Reports. 5) From time to time, Streetwise Reports LLC and its directors, officers, employees or members of their families, as well as persons interviewed for articles and interviews on the site, may have a long or short position in securities mentioned. Directors, officers, employees or members of their immediate families are prohibited from making purchases and/or sales of those securities in the open market or otherwise from the time of the interview or the decision to write an article until three business days after the publication of the interview or article. The foregoing prohibition does not apply to articles that in substance only restate previously published company releases. As of the date of this article, officers and/or employees of Streetwise Reports LLC (including members of their household) own shares of Millrock Resources, a company mentioned in this article.
Proven and Probable LLC receives financial compensation from its sponsors. The compensation is used is to fund both sponsor-specific activities and general report activities, website, and general and administrative costs. Sponsor-specific activities may include aggregating content and publishing that content on the Proven and Probable website, creating and maintaining company landing pages, interviewing key management, posting a banner/billboard, and/or issuing press releases. The fees also cover the costs for Proven and Probable to publish sector-specific information on our site, and also to create content by interviewing experts in the sector. Monthly sponsorship fees range from $1,000 to $4,000 per month. Proven and Probable LLC does accept stock for payment of sponsorship fees. Sponsor pages may be considered advertising for the purposes of 18 U.S.C. 1734.
The Information presented in Proven and Probable is provided for educational and informational purposes only, without any express or implied warranty of any kind, including warranties of accuracy, completeness, or fitness for any particular purpose. The Information contained in or provided from or through this forum is not intended to be and does not constitute financial advice, investment advice, trading advice or any other advice. The Information on this forum and provided from or through this forum is general in nature and is not specific to you the User or anyone else. You should not make any decision, financial, investments, trading or otherwise, based on any of the information presented on this forum without undertaking independent due diligence and consultation with a professional broker or competent financial advisor. You understand that you are using any and all Information available on or through this forum at your own risk.
By CentralBankNews.info Uganda’s central bank lowered its benchmark interest rate for the second time in the current easing cycle and launched other monetary easing measures, including the purchase of government bonds, to ensure adequate access to credit and a normal functioning of financial markets during what it described as a “severe contraction” in economic activity from the COVID-19 pandemic. The Bank of Uganda (BOU) cut its Central Bank Rate (CBR) by 100 basis points to 8.0 percent and has now cut it by 200 basis points since October 2019. It is BOU’s first rate cut this year. With global supply chains disrupted, which affects manufacturing, travel restrictions, social distancing measures, and a decline in demand, BOU forecast the country’s economy would slow “drastically” in the second half of the current 2019/20 financial year, with growth for the year of 3 to 4 percent. In October, when BOU also cut its rate by 100 basis points, the central bank was already reacting to slowing economic growth, which was pulling down its inflation forecasts, from earlier forecasts of 6.0 to 6.3 percent growth for 2019/20, which began on July 1, last year. In February BOU still expected growth this year of 5.5 to 6.0 percent despite uncertainty around the severity of the coronavirus outbreak. “Downside risks to economic growth outlook have increased, particularly in the near term and economic activity is projected to remain subdued until the pandemic is contained globally,” BOU said. Although there is still uncertainty over the duration of the slowdown, BOU said it expects growth to gradually recover in the second half of the 2020/21 year but the output gap to persist until 2022. Headline and core inflation in Uganda eased to 3.0 in March and 2.5 percent, respectively, and BOU expects core inflation to remain below its historical average in the 12 months ahead with “feeble” domestic demand lead to disinflationary pressures in the economy even as the prices of some imported items may rise due to supply chain disruptions. Inflation is now seen in the range of 2 to 3 percent this year on the assumption the pandemic is contained by June and the economy recovers gradually in the second half of the year. BOU targets inflation of 5.0 percent. In addition to the rate cut, BOU directed financial institutions to defer payments of dividends and bonuses for at least 90 days as of March to ensure adequate capital buffers, will provide exceptional liquidity assistance to commercial banks that are facing liquidity distress for up to one year, provide liquidity to banks for a longer period by issuing reverse repos for up to 60 days, with an opportunity to roll this over. BOU will also purchase treasury bonds held by institutions providing micro finance and credit institutions to ease any liquidity stress and those institutions that don’t hold treasury bills or bonds will be provided with liquidity secured by other holdings. Financial institutions will also be permitted to restructure corporate or individual loans, including a moratorium on loan repayments for borrowers that have been affected by the pandemic for up to 12 months as of April 1, BOU said.
The Bank of Uganda released the following statement:
“Bank of Uganda (BoU) has in the April 2020 Monetary Policy Committee (MPC) meeting reduced the Central Bank Rate (CBR) by 1 percentage point to 8 percent.
The COVID-19 pandemic has led to a severe contraction in economic activity due to a combination of global supply chain disruptions, travel restrictions, measures to limit contact between persons, and the sudden decline in demand. Consumer-facing sectors have been severely affected by social distancing measures and heightened uncertainty, while the manufacturing sector has declined on account of disruptions to the inflow of raw materials. Economic activity in the trade sector has also been weighed down by the decline in external demand and supply chain disruptions, while service sectors such as finance, insurance, and information and communications are affected by the general stall in business activity and investment. Consequently, the Ugandan economy is projected to slow down drastically in the second half of Financial Year (FY) 2019/20, with GDP growth for the FY projected at 3 – 4 percent. Downside risks to the economic growth outlook have increased, particularly in the near term and economic activity is projected to remain subdued until the pandemic is contained globally. Although GDP growth is projected to gradually recover in the second half of FY2020/21, the emerging output gap is projected to persist until 2022.
However, there is significant uncertainty over the depth and duration of the current slowdown. The COVID-19 pandemic has been reflected in deterioration of global financial conditions and an appreciation of the US dollar against other major currencies, resulting in the volatility in the domestic foreign exchange market. The Uganda shilling depreciated against the US dollar by 2.2 percent between February and March 2020. In addition, the propagation of COVID-19 bears severe consequences on Uganda through worsening of external position, due to capital outflows, adverse effects on the flow ofinternational trade, tourism, workers’ remittances, foreign direct investment and loan disbursement, exacerbating exchange rate depreciation pressures.
The March 2020 Consumer Price Index (CPI) data released by UBOS indicates that inflation remains relatively subdued. Headline inflation declined to 3.0 percent from 3.4 percent in February 2020, while core inflation declined to 2.5 percent from 3.1 percent. Energy Fuel and Utilities (EFU) inflation declined to 7.7 percent from 8.0 percent in February 2020, while food crops inflation increased to 2.5 percent from 1.3 percent. Core inflation is projected to remain below its historical average in the 12 months ahead due to the widening of the output gap.The feeble domestic aggregate demand conditions will lead to disinflationary pressures in the economy, even as the prices of
some imported items are likely to increase as a result of supply chain disruptions. Moreover, external sources of inflation are likely to remain weak in the near-term in the face of the global downturn. Furthermore, the collapse in crude oil prices should work towards easing both EFU and core inflation pressures, depending on the level of the pass-through to retail prices. Inflation is forecast to be in the range of 2 – 3 percent in 2020 on the assumption that the COVID-19 pandemic is contained by June 2020 and the economy recovers gradually in the second half of 2020. Nonetheless, these inflation forecasts are heavily contingent on the path of the exchange rate and the intensity, spread and duration of COVID-19 pandemic. Given the deterioration in macroeconomic conditions and in order to ensure adequate access to credit and the normal functioning of financial markets, BoU has decided to ease monetary policy. Consequently, the CBR has been reduced by 1 percentage point to 8 percent. The band on the CBR will remain at +/-3 percentage points and the margin on the rediscount rate and bank rate will remain at 4 and 5 percentage points on the CBR, respectively. Consequently, the rediscount rate and the bank rate will be 12 percent and 13 percent, respectively.
BoU has also directed Supervised Financial Institutions (SFIs) to defer the payments of all discretionary distributions such as dividends and bonus payments for at least 90 days effective March 2020, depending on the evolution of the pandemic. This will ensure that SFIs have adequate capital buffers, while supporting the real economy. In addition, BoU will undertake the following:
i) Provide exceptional liquidity assistance to commercial banks that are in liquidity distress for a period of up to one year.
ii) Provide liquidity to commercial banks for a longer period through issuance of reverse REPOs of up to 60 days at the CBR, with opportunity to roll over.
iii) Purchase Treasury Bonds held by Microfinance Deposit taking Institutions (MDIs) and Credit Institutions (CIs) in order to ease their liquidity distress whenever it arises. MDIs and CIs that do not hold Treasury bills or bonds in their asset holdings will be provided with liquidity secured by their holdings of unencumbered Fixed Deposits or Placements with other SFIs
iv) Grant exceptional permission to SFIs to restructure loans of corporate and individual customers including a moratorium on loan repayment for borrowers that have been affected by the pandemic, on a case by case basis at the st discretion of the SFIs for up to 12 months, effective April 1 , 2020.
BoU will continue to monitor the evolving financial market and macroeconomic conditions and calibrate its operations to meet the need for any additional liquidity support, as may be warranted.” www.CentralBankNews.info
– The mood across financial markets brightened on Monday as investors took heart from news of falling coronavirus cases and deaths in some of the worst-affected countries.
Equities across the globe were back in fashion as the sentiment pendulum swung in favour of risk. The S&P 500 and Dow Jones both rallied over 4.5% amid the risk-on mood, bringing year-to-date losses back below 22%. While stocks have the potential to push higher in the near term amid the positivity, the upside is likely to face many obstacles down the road. Concerns around a global recession and economic damage inflicted by the pandemic should weigh on investor sentiment in the medium to longer term.
Looking at the technical picture, the S&P 500 may be experiencing a technical rebound on the daily charts with prices approaching the 38% Fibonacci retracement level of 2650. A breakout above this point may open a path towards 2789 before bears re-enter the scene. Alternatively, a breakdown below 2560 could signal a decline back towards 2450.
Oil outlook hinges on delayed OPEC meeting
Where Oil concludes this week may be influenced by how the OPEC meeting plays out on Thursday.
If the cartel fails to secure a meaningful deal that ends the current price war, Oil could end up tumbling back to levels not seen in 17 years around $20. A positive outcome to the meeting should offer some light at the end of the tunnel for Oil, opening the path towards $40.
Focusing on the technical standpoint, prices are still bearish on the daily charts. Oil weakened roughly 65% during the first quarter of 2020 thanks to the coronavirus pandemic and oversupply fears. If nothing changes, the path of least resistance for the commodity will remain south.
Currency spotlight – EURUSD
The Euro has weakened against almost every single G10 currency since the start of the month thanks to recession fears and concerns around a sovereign debt crisis.
Appetite towards the currency is set to diminish as investors rush to the worlds most liquid currency, King Dollar. Technical traders will continue to observe how prices behave around 1.0780. A solid daily close below this level should open a path back towards 1.0650. Should 1.0780 prove to be reliable support, prices could rebound back towards 10.890 and 1.1000 in the medium term.
Disclaimer: The content in this article comprises personal opinions and should not be construed as containing personal and/or other investment advice and/or an offer of and/or solicitation for any transactions in financial instruments and/or a guarantee and/or prediction of future performance. ForexTime (FXTM), its affiliates, agents, directors, officers or employees do not guarantee the accuracy, validity, timeliness or completeness, of any information or data made available and assume no liability as to any loss arising from any investment based on the same.
London Bullion Market Association (LBMA) officials have loudly proclaimed there are plenty of gold bars in LBMA and COMEX vaults to meet surging demand from buyers.
Unfortunately for them, confidence is particularly fragile these days and cracks are starting to appear.
Which is why anxious officials there issued not one, but two memos last week in an attempt to reassure traders.
It’s interesting the LBMA, along with the COMEX, felt a need to put out back to back statements. If inventories are plentiful, both exchanges should be busy delivering gold, on time and without delay. The best way to build confidence is simply to meet buyers’ expectations.
The trouble is these expectations are not being met, and officials blaming disruptions related to COVID-19. There are, for example, not enough 100-ounce gold bars in the U.S. to cover demand from those standing for delivery on COMEX futures contracts.
The reason offered is that the Swiss refiners who normally convert 400-ounce bars stored in London to 100-ounce bars needed in the U.S. are temporarily closed. There has also been difficulty in arranging air transport of the gold.
This sounds plausible, but it does not explain a more fundamental problem. Bullion banks sold way more paper 100-ounce bars than they can actually deliver. While there may be lots of physical gold in London, there isn’t enough deliverable gold in U.S. based COMEX vaults to meet delivery demands.
U.S. investors standing for delivery on a contract shouldn’t have to rely on inventory stored in London vaults.
Yet that is exactly what they will have to do. The COMEX changed the terms of their gold futures contract. Now bullion banks can meet delivery requirements with 400 oz bars in an LBMA vault stored overseas.
U.S. buyers might not like getting a partial interest in a 400 oz bar vaulted in London instead of a 100-ounce bar they can take actual possession of here in this country. That is tough luck for them and great news for bullion bankers on the verge of default.
Perhaps the joint statement issued by LBMA and COMEX officials on April 1st was an April Fool’s joke. They claimed a “near record” 8,326 tonnes of gold are stockpiled in LBMA vaults – the equivalent of 666,045 400-ounce bars.
However, they published an inventory number from 3 months ago instead of the current stocks… suspicious to say the least. They also didn’t explain that a large majority of the stored gold is not available for delivery at this time. The vast majority of that gold belongs to the Bank of England, other central banks, and ETFs.
Metals analyst Ronan Manly estimates the actual amount of gold available for delivery is less than 500 tonnes – at least at the current gold price.
Craig Hemke, of TF Metals Report, points out just what a paltry amount that is. The “CME/COMEX posted a total of 290,847 ‘Exchanges for Physical.’ That’s a total of over 29MM ounces of gold or NINE HUNDRED METRIC TONNES!!!”
In other words, the LBMA vaults may only have about half of what is needed to cover COMEX “Exchanges for Physical” in London, let alone what is needed by the LBMA directly. Keep in mind, these numbers are just from the first three weeks in March.
It is starting to look like a lot of speculators who hold paper gold and hope to redeem that for actual bars could be disappointed.
The Money Metals News Service provides market news and crisp commentary for investors following the precious metals markets.
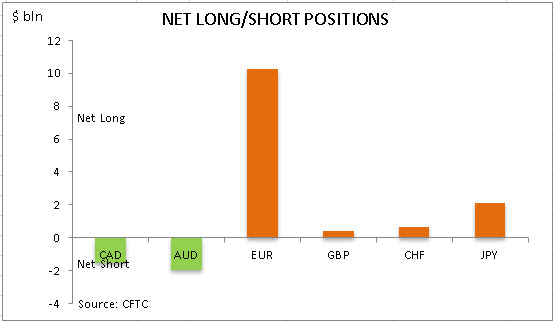
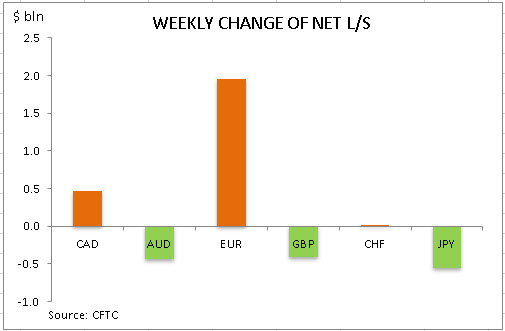
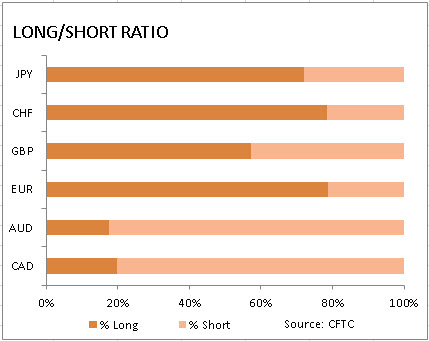
US dollar bearish bets continued to rise reaching to $9.89 billion from $8.86 billion against the major currencies during the one week period, according to the report of the Commodity Futures Trading Commission (CFTC) covering data up to March 31 and released on Friday April 3. The change in overall dollar position was due to increase in bullish bets on euro and Swiss franc while bullish bets on British Pound and Japanese yen were cut further. Australian and Canadian dollars maintained net short positions against the dollar. Bearish dollar bets rose as the historic $2 trillion economic stimulus bill passed, allocating $1,200 direct payments to many Americans, more than $360 billion in loans to small businesses and $500 billion to industries, cities and states. At the same time the Labor Department report indicated the number of Americans who filed for unemployment insurance for the first time soared to a record 3.28 million in the week ending March 21.
Note: This overview has an informative and tutorial character and is published for free. All the data, included in the overview, are received from public sources, recognized as more or less reliable. Moreover, there is no guarantee that the indicated information is full and precise. Overviews are not updated. The whole information in each overview, including opinion, indicators, charts and anything else, is provided only for familiarization purposes and is not financial advice or а recommendation. The whole text and its any part, as well as the charts cannot be considered as an offer to make a deal with any asset. IFC Markets and its employees under any circumstances are not liable for any action taken by someone else during or after reading the overview.