– Our Adaptive Fibonacci Price Modeling system suggests a much deeper price move is in the works and the current price rally will likely end near resistance levels identified by the Adaptive Fibonacci Price Modeling system. We are posting this research post for friends and followers to help them understand the true structure of price and to allow them to prepare for what we believe will become a much deeper downside price move in the future.
Fibonacci Price Theory teaches us that price moves in waves within up and down price cycles. The recent peak in price, near February 25, 2020, has resulted in a very deep -36% price collapse in the S&P 500 (ES) recently. This downside move has been mostly straight down, excluding a brief retracement in early March. The strength of this downside price move suggests a moderate upside price recovery will take place before the next downside leg sets up.
Before we continue, be sure to opt-in to our free market trend signals before closing this page, so you don’t miss our next special report!
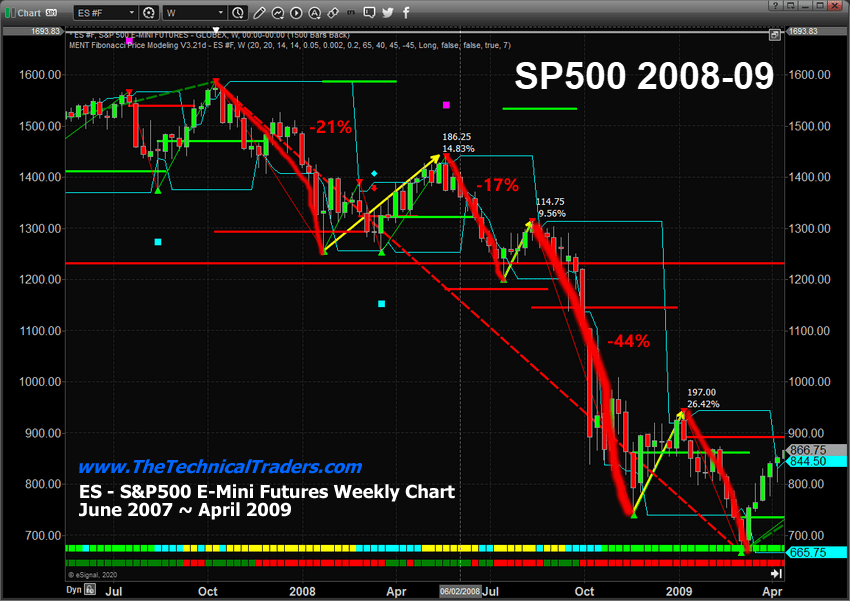
S&P 500 Weekly Chart of 2008-09 Credit Crisis Market Collapse
Throughout the 2008-09 Credit Crisis market collapse, prices staged multiple recovery attempts within the downward price trend. The first, after the initial -20.88% selloff in late 2007, resulted in a +14.83% price recovery that lasted for over 15+ weeks. The second recovery, near the end of July 2008, resulted in a +9.56% recovery after a nearly -17% price decline. After this brief recovery in July 2008, the price collapsed by a massive -44% from August to November 2008.
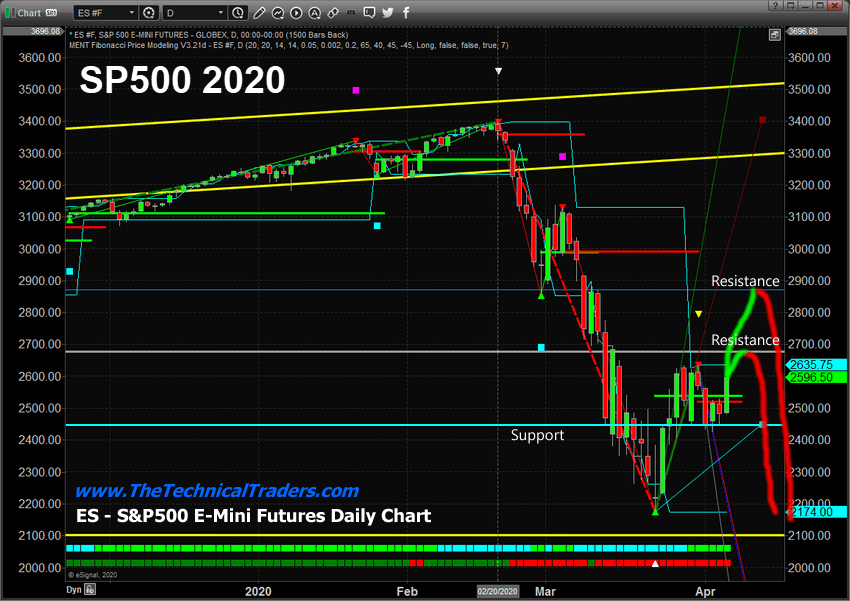
Daily S&P 500 Chart
This Daily ES chart highlights the first two levels of resistance at 2700 & 2870 that could stall the rally and prompt a downside price move in the future. Support is currently at 2450. We believe the 2700 level will act as a soft ceiling in the ES where price may attempt to rally, briefly, above this level, which it did yesterday, then pull back and pause as selling pressure re-enters the market. The 2870 level may act as a hard ceiling where price may attempt to reach this level, but immediately reverse back to the downside.
Overall, we believe continued selling as a result of forward global economic expectations is the most obvious outcome where a deeper price bottom will setup sometime later this spring or early summer.
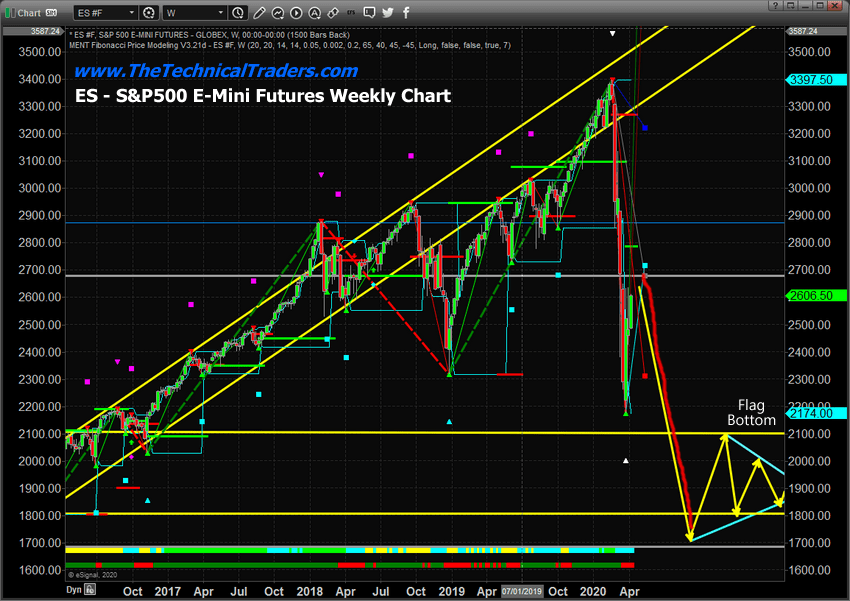
Weekly S&P 500 Chart
This Weekly S&P 500 chart (ES) shows a possible outcome for price going forward if another downside move starts. A new downside price move to levels near to, or just below, the 2015~16 low price range is not unreasonable. From this level, we believe a “Flag” formation will setup creating an extended price bottom pattern down at those extreme lows. We believe this “Flag” formation will end near August~October 2020, just before the 2020 elections and prompt the beginning of a new upside price recovery in the US and global markets.
This is a large forward-looking projection and you may be rolling your eyes, but they are very possible. In fact, last year we predicted the months and price levels in which gold and oil would start new major trends, and we did this 8 months before they took place, similar to what we are proposing here.
Concluding Thoughts:
The rotation in price setup by this brief upside price move will set up a new Fibonacci downside and upside price target range. We believe it is essential for price to continue this type of rotation as the eventual bottom sets up in the US and global markets. We believe the true price bottom will happen only after the virus event has subsided and global economies begin to start functioning like normal again.
Currently, there is simply too much of a world-wide disruption to expect that the bottom has already set up near last year’s (2019) brief price lows. The scale and scope of the current downside price collapse do not properly reflect the total scope of this global virus event yet – it is still a reactionary move in price that has yet to properly digest the total scope of the global economic disruptions. There is a chance for stronger bounce/rally in the next few weeks/months if the virus can start to be contained, and that will continue to mimic that of the 2000 tech bubble. Believe it or not, there is a big similarity to what happened then, to what is happening now in terms of price action and market sentiment. Read article and see these charts.
In other words, we believe more selling will be seen in the global markets and more economic contraction will take place until we are safely beyond this virus event. The longer the global economic shutdown continues, the more likely we are to see a deeper price bottom in the future and the more likely we are to see more extensive economic collateral damage across the world. No matter which way the markets move we will follow and trade the price action and profit. That is the benefit of following price vs trying to trade prediction, fundamental data etc..
In Part II of this research article, we’ll dig deeper into the underlying components that support our research.
As a technical analyst and trader since 1997, I have been through a few bull/bear market cycles in stocks and commodities. I believe I have a good pulse on the market and timing key turning points for investing and short-term swing traders.
I hope you found this informative, and if you would like to get a pre-market video every day before the opening bell, along with my trade alerts visit my Active ETF Trading Newsletter.
We all have trading accounts, and while our trading accounts are important, what is even more important are our long-term investment and retirement accounts. Why? Because they are, in most cases, our largest store of wealth other than our homes, and if they are not protected during a time like this, you could lose 25-50% or more of your entire net worth. The good news is we can preserve and even grow our long term capital when things get ugly like they are now and ill show you how and one of the best trades is one your financial advisor will never let you do because they do not make money from the trade/position.
If you have any type of retirement account and are looking for signals when to own equities, bonds, or cash, be sure to become a member of my Long-Term Investing Signals which we issued a new signal for subscribers.
Ride my coattails as I navigate these financial markets and build wealth while others lose nearly everything they own during the next financial crisis.
Shares of Fate Therapeutics traded higher after the firm reported it has treated the first patient in a first-in-human trial of FT596 for patients with B-cell malignancies and chronic lymphocytic leukemia.
Clinical-stage biopharmaceutical company Fate Therapeutics Inc. (FATE:NASDAQ), which is focused on the development of programmed cellular immunotherapies for cancer and immune disorders, yesterday announced that “the first patient has been treated in the company’s first-in-human Phase 1 clinical trial evaluating FT596, the first cell therapy product candidate engineered with three active anti-tumor modalities, in patients with B-cell malignancies and chronic lymphocytic leukemia.”
The company described FT596 as “an off-the-shelf chimeric antigen receptor (CAR) natural killer (NK) cell cancer immunotherapy derived from a clonal master induced pluripotent stem cell (iPSC) line engineered to express a proprietary CD19-targeting CAR, a novel high-affinity 158V, non-cleavable CD16 (hnCD16) Fc receptor, and a unique interleukin-15 receptor fusion (IL-15RF).”
The company’s President and CEO Scott Wolchko commented, “We are pleased to have worked with the Masonic Cancer Center, University of Minnesota to treat the first patient with FT596…The COVID-19 pandemic presents unprecedented challenges for clinical trial conduct worldwide, and we anticipate there will be delays across our studies. We are committed to the health and safety of our employees and partners, and have implemented a remote work program to the greatest extent possible while continuing certain activities that can only be completed on-site. We are also working closely with our clinical sites and principal investigators so that we are well positioned to accelerate clinical trial execution when pressures on the health system ease.”
The company also used the opportunity to provide an operational update on its response to the global COVID-19 pandemic. The firm stated that it has taken steps commensurate with CDC and the State of California guidelines to protect the health and safety of its employees and the community. The company added that it has implemented a work from home policy, and restricted on-site activities to certain manufacturing and necessary laboratory and support activities.
The company noted that it remains committed to its clinical programs and development plans though it does expect that the timelines of its ongoing clinical trials will be impacted somewhat by potential delays or disruptions due to the COVID-19 situation.
The firm indicated that “it continues to engage the U.S. Food and Drug Administration (FDA) and remains on-track to submit Investigational New Drug applications to the FDA for FT538, its off-the-shelf, iPSC-derived NK cell product candidate for multiple myeloma and for FT819, the company’s first off-the-shelf, iPSC-derived CAR T-cell product candidate for B-cell malignancies in Q2/20.”
The company explained that its proprietary induced pluripotent stem cell (iPSC) product platform, which is supported by more than 300 issued and 150 pending patents, “enables mass production of off-the-shelf, engineered, homogeneous cell products that can be administered with multiple doses to deliver more effective pharmacologic activity, including in combination with cycles of other cancer treatments.” The firm stated in the report that “human iPSCs possess the unique dual properties of unlimited self-renewal and differentiation potential into all cell types of the body.”
Fate Therapeutics is a clinical-stage biopharmaceutical company headquartered in San Diego, Calif., that specializes in developing cellular immunotherapies for cancer and immune disorders utilizing its using its proprietary induced pluripotent stem cell (iPSC) product platform. The company’s listed that its immuno-oncology product candidates include natural killer (NK) cell and T-cell cancer immunotherapies and its immuno-regulatory product candidates include ProTmune that is currently being evaluated in a Phase 2 clinical trial for the prevention of graft-versus-host disease.
Fate Therapeutics has a market capitalization of around $1.8 billion with approximately 75.94 million shares outstanding and a short interest of about 13.7%. FATE shares opened 18% higher today at $24.90 (+$3.83, +18.189%) over yesterday’s $21.07 closing price. The stock has traded today between $22.89 and $25.00 per share and is currently trading at $23.10 (+$2.03, +9.63%).
Disclosure: 1) Stephen Hytha compiled this article for Streetwise Reports LLC and provides services to Streetwise Reports as an independent contractor. He or members of his household own securities of the following companies mentioned in the article: None. He or members of his household are paid by the following companies mentioned in this article: None. 2) The following companies mentioned in this article are billboard sponsors of Streetwise Reports: None. Click here for important disclosures about sponsor fees. 3) Comments and opinions expressed are those of the specific experts and not of Streetwise Reports or its officers. The information provided above is for informational purposes only and is not a recommendation to buy or sell any security. 4) The article does not constitute investment advice. Each reader is encouraged to consult with his or her individual financial professional and any action a reader takes as a result of information presented here is his or her own responsibility. By opening this page, each reader accepts and agrees to Streetwise Reports’ terms of use and full legal disclaimer. This article is not a solicitation for investment. Streetwise Reports does not render general or specific investment advice and the information on Streetwise Reports should not be considered a recommendation to buy or sell any security. Streetwise Reports does not endorse or recommend the business, products, services or securities of any company mentioned on Streetwise Reports. 5) From time to time, Streetwise Reports LLC and its directors, officers, employees or members of their families, as well as persons interviewed for articles and interviews on the site, may have a long or short position in securities mentioned. Directors, officers, employees or members of their immediate families are prohibited from making purchases and/or sales of those securities in the open market or otherwise from the time of the interview or the decision to write an article until three business days after the publication of the interview or article. The foregoing prohibition does not apply to articles that in substance only restate previously published company releases. 6) This article does not constitute medical advice. Officers, employees and contributors to Streetwise Reports are not licensed medical professionals. Readers should always contact their healthcare professionals for medical advice.
Outcrop Gold is wholly focused on its Colombia properties that have a long history of high-grade production.
Outcrop Gold Corp.’s (OCG:TSX.V; MRDDF:OTCPK; MRG1:FSE) coffers and profile received a boost in February when veteran investor Eric Sprott took a $1 million stake in the company. Outcrop, a prospect generator that is also conducting in-depth exploration, holds a portfolio of projects in gold and silver rich Colombia.
The company is also on the radar of newsletter writer Gwen Preston of The Maven Letter, who wrote on February 26, “Sprott’s money (and its endorsement of Santa Ana’s potential) adds exactly the attention and validation that the story needs.”
Outcrop, which until about 18 months ago was known as Miranda Gold, hosts “three flagship projects that should be considered advanced exploration, and others that are a bit more grassroots,” Outcrop CEO and director Joe Hebert told Streetwise Reports.
The first of the projects is Santa Ana, which is the high grade, Hebert said. “It’s a tremendous gold-silver vein system and we are drilling it ourselves, having just completed 12,000 meters.” The project is located in the Mariquita District, which has a long mining history, with records dating back to 1585, and silver grades among the highest in Latin America.
The second property, Cauca, has had 22,000 meters of drilling on it and a non-compliant NI 43-101 low grade resource, “but it’s similar to Santa Ana in that there’s a proliferation of high-grade veins all the way through it that haven’t really been drilled,” Hebert explained.
The third is Mallama, the largest of the three, covering a 110 sq km area, and contains the “biggest gold-silver vein system in Colombia,” Hebert stated.
“All of them have extremely good grade potential,” Hebert explained. “While we are drilling at Santa Ana, the other two we will probably joint venture; we are actively looking for JVs for them.”
As to why a prospect generator would be conducting extensive drilling, “We’ve found that there is a cyclical ebb and flow of major interest in Colombia,” Hebert stated. “We are seeing a resurgence of interest but felt that we had to create our own catalysts because we couldn’t just sit there and not have properties moving forward actively with drilling.”
In February, Outcrop announced the discovery of a new, high-grade gold vein system, La Ivana, at Santa Ana that includes 1 meter of 21 g/t gold and 4,608 g/t silver. This was followed by an early March announcement of drill results that included 0.61 meters of 29 g/t gold and 1,675 g/t silver.
“When you consider the steady decline of grades in the world’s twelve largest primary silver mines to an average of approximately 300 g/t silverthe grades from the current and historical drilling on the Santa Ana project are notable,” Hebert stated. “It is remarkable and encouraging that for all holes, both historical and from our recent drilling, 94% have tagged high-grade silver and/or gold.”
The company noted that “recent compilations and reconnaissance indicate up to 14 km of cumulative vein systems containing packages of multiple veins.”
Hebert explained that in any given hole, the company is finding two to four veins. “Each package, on average, is approaching 900 to 1,000 g/t silver equivalent and it has very good shoots. The continuity is in excess of 200 meters in any given package and at least 200 meters at depth. Then you have two to four veins in the same interval, so you’re able to accumulate both volumes and grades fairly quickly, and, relatively speaking, with less drilling than you might expect in another vein system.”
Outcrop plans to conduct another round of drilling of 12,000 meters, to bring it to the pre-delineation stage.
“Hypothetically, if we put together 18 ore panels of 200 meters by 200 meters, we would be looking at a scenario of over 1 million ounces gold equivalent or 80100 million ounces of silver. That’s really what our target is. The goal is to get 18 good ore panel hits and our plan is to do that over the next 12 months,” Hebert explained.
Then if that is successful, Hebert stated, “we would come in, us or a partner or a combination, and at the end of 12 months we would come in with another 42,000 meters of drilling. That would be the delineation phase. We would bring in more than one rig and that would take an additional 18 months. At the end of that, we would have at least an Inferred resource and perhaps parts of it more than Inferred.”
Looking ahead, Hebert says that, in addition to seeing the results of the steady drilling at Santa Ana, he expects to see “joint ventures with some respected companies. In the next 12 months, we hope to have three joint ventures.”
In addition to the Colombia properties, Outcrop holds a small royalty on a project in Alaska. But the company’s focus is entirely on Colombia right now.
Outcrop has the attention of industry observers. Gwen Preston of The Maven Letter wrote on March 11, Outcrop “has now reported assays from nine of the 12-hole, 1,300 m program it recently completed on the Porfia vein, a high-grade target with the Ivana vein zone on its Santa Ana project in Colombia. As with previous batches from this effort, this batch included bonanza grades. Highlights include 0.61 m of 29.0 g/t gold and 1,675 g/t silver, 0.58 m of 36.2 g/t gold and 325 g/t silver and 0.85 m of 21.4 g/t gold and 373 g/t silver. Drilling has encountered high-grade mineralization in eight of the nine holes released so far.
“Combined with the historic results from the Santa Ana Royal Mines target to the south, the assays from Ivana suggest the company’s impending 12,000 m program will generate more high grade from the 14 km of veins identified to date on the project.”
Technical analyst Clive Maund commented on February 14, when Outcrop’s shares were trading at CA$0.11, “Outcrop Gold is amazingly cheap here and good value, especially after it just reported positive drilling results, and closed a Private Placement. It is very close to the 2nd low of a big Double Bottom with its lows of late 2018, and looking set to turn higher. . .It is viewed as an immediate strong speculative buy.
Outcrop has about 68.6 million shares outstanding; with 36.5 million warrants and 6.6 million options, there are 111.9 million shares fully diluted. The company currently has about CA$1 million on hand.
Disclosure: 1) Patrice Fusillo compiled this article for Streetwise Reports LLC and provides services to Streetwise Reports as an employee. She or members of her household own securities of the following companies mentioned in the article: None. She or members of her household are paid by the following companies mentioned in this article: None. 2) The following companies mentioned in this article are billboard sponsors of Streetwise Reports: None. Click here for important disclosures about sponsor fees. 3) Comments and opinions expressed are those of the specific experts and not of Streetwise Reports or its officers. The information provided above is for informational purposes only and is not a recommendation to buy or sell any security. 4) The article does not constitute investment advice. Each reader is encouraged to consult with his or her individual financial professional and any action a reader takes as a result of information presented here is his or her own responsibility. By opening this page, each reader accepts and agrees to Streetwise Reports’ terms of use and full legal disclaimer. This article is not a solicitation for investment. Streetwise Reports does not render general or specific investment advice and the information on Streetwise Reports should not be considered a recommendation to buy or sell any security. Streetwise Reports does not endorse or recommend the business, products, services or securities of any company mentioned on Streetwise Reports. 5) From time to time, Streetwise Reports LLC and its directors, officers, employees or members of their families, as well as persons interviewed for articles and interviews on the site, may have a long or short position in securities mentioned. Directors, officers, employees or members of their immediate families are prohibited from making purchases and/or sales of those securities in the open market or otherwise from the time of the interview or the decision to write an article until three business days after the publication of the interview or article. The foregoing prohibition does not apply to articles that in substance only restate previously published company releases. As of the date of this article, officers and/or employees of Streetwise Reports LLC (including members of their household) own securities of Outcrop Gold, a company mentioned in this article.
Additional disclosures:
Disclosures from Resource Maven Companies are selected based solely on merit; fees are not paid.
The publisher, owner, writer or their affiliates may own securities of or may have participated in the financings of some or all of the companies mentioned in this publication.
Clive Maund does not own shares of Outcrop Gold and neither he nor his company has a financial relationship with the company.
Rising current account surplus in Japan bullish for USDJPY
Current account surplus rose in Japan in February: current account surplus rose to 2.38 trillion yen from 1.63 trillion in January, when a decline to 2.02 trillion yen was forecast. This is bullish for USDJPY.
By CentralBankNews.info Poland’s central bank cut its benchmark interest rate for the second time in less than a month and will begin purchasing government securities and government-guaranteed debt in the secondary market to ease the economic impact of the spread of the Covid-19 pandemic, which it said could result in a “very sizable” drop in activity in short run. The National Bank of Poland (NBP) cut its reference rate by another 50 basis points to 0.50 percent and has now cut it by 100 basis points following an earlier cut of the same size on March 17, its first rate cut in five years. The central bank, or Narodowy Bank Polski (NBP) in Polish language, said it would also continue to provide liquidity to the banking sector on top of its normal operations. After today’s decision, the bank’s Lombard rate is at 1.0 percent, the deposit rate at 0.0 percent, the rediscount rate at 0.55 percent and the discount rate 0.60 percent. NBP said the timing and scale of the purchase of government securities and government-guaranteed debt on secondary markets would depend on market conditions and it would also offer bill discount credit aimed at refinancing loans by banks to businesses. The purchase of government debt is aimed at ensuring liquidity in these markets and enhancing the impact of the central bank’s rate cuts, thus strengthening the monetary policy transmission. “The measures undertaken by NBP are aimed at easing financing conditions in the economy and mitigating the negative economic impact of the pandemic, thus being conducive to maintaining macroeconomic and financial stability,” the bank said, adding this would also contribute to an economic recovery and reduce the risk of inflation falling below NBP’s target. NBP said measures aimed at limited the spread of the coronavirus are reducing economic activity and a drop in the short run could be very sizable. This decline will be accompanied by a deterioration in the labour market and a fall of disposable income of households. A global economic downturn together with lower commodity prices and weaker domestic demand will also lead to a “marked deterioration of price growth,” the bank said. Further ahead, NBP said economic activity should gradually recover, supported by fiscal measures both in Poland and other countries along with the country’s strong fundamental, low debt and high competitiveness.
The National Bank of Poland issued the following statement:
“Information from the meeting of the Monetary Policy Council held on 8 April 2020 The Council decided to cut the NBP reference rate by 0.50 percentage points, i.e. to 0.50%. At the same time, the Council set the remaining NBP interest rates at the following levels: ▪ lombard rate at 1.00%;▪ deposit rate at 0.00%;▪ rediscount rate at 0.55%; ▪ discount rate at 0.60%. NBP will continue – apart from basic operations – to provide liquidity to the banking sector using repo transactions. At the same time, NBP will purchase government securities and government-guaranteed debt securities on the secondary market as part of the structural operations. The timing and scale of the operations will depend on the market conditions. Furthermore, NBP will offer bill discount credit aimed at refinancing loans granted to enterprises by banks. The incoming information suggest that COVID-19 pandemic and measures introduced to counteract its further spread contribute to the fast deepening fall in activity in many economies as well as to a very strong deterioration of sentiment. At the same time, global economic growth forecasts, including those for Poland’s main trading partners, have been substantially revised downwards. In order to mitigate the negative economic effects of the pandemic and ensure conditions for fast economic recovery after current disruptions abate, many countries introduce wide-ranging fiscal stimulus packages. Chinese economy shows first signs of economic recovery after a strong fall in activity at the begging of the year. Many central banks have substantially eased monetary conditions by lowering interest rates, providing liquidity to the banking sector and pursuing asset purchases. Recent forecasts indicate that after the abatement of the current disruptions the global economic conditions should improve, supported by fiscal measures and monetary easing. At the same time, the pace and scale of the improvement will depend on the impact of disruptions on economic agents’ income and sentiment in the longer run. In the financial markets – due to the globally deteriorating economic outlook – risk aversion remains high leading to increased price volatility of many assets and tightened financial conditions. At the same time, global oil prices have fallen significantly since the begging of the year, accompanied by decreasing prices of some food commodities.
In Poland, economic conditions in the first months of the year were relatively favourable. However, measures aimed at limiting the spread of epidemic contribute to the reduction of economic activity. In the short run, the scale of activity drop could be very sizable. This will be accompanied by a deteriorating situation in the labour market and a fall of disposable income of households. Further ahead, economic activity should, however, gradually recover, supported by fiscal measures introduced in Poland and many other countries as well as strong macroeconomic fundamentals of the Polish economy related to its low internal and external indebtedness and high competitiveness together with geographical and sectoral diversification of Polish exports. Expected global economic downturn together with lower commodity prices and weaker domestic demand will contribute to a marked deceleration of price growth. Consequently, despite recent monetary policy easing introduced by NBP, the risk of inflation falling below the NBP inflation target in the monetary policy transmission horizon prevails. Considering the above-mentioned circumstances, the Council decided to ease monetary conditions. Thus, the Council cut the NBP interest rates further. NBP will continue – apart from basic operations – to provide liquidity to the banking sector using repo transactions. NBP will purchase government securities and government- guaranteed debt securities on the secondary market as part of the structural operations. These operations are aimed at changing the long-term liquidity structure in the banking sector, ensuring the liquidity in secondary markets for the purchased securities and enhancing the impact of the NBP interest rate cuts on the economy, i.e. strengthening the monetary policy transmission mechanism. The timing and scale of the operations will depend on the market conditions. Furthermore NBP will offer bill discount credit aimed at refinancing loans granted to enterprises by banks. The measures undertaken by NBP are aimed at easing financing conditions in the economy and mitigating the negative economic impact of pandemic, thus being conducive to maintaining macroeconomic and financial stability. Those measures will also contribute to recovery in domestic economic activity after the abatement of current disturbances. Consequently, they will reduce the risk of inflation falling below the NBP inflation target in the medium term.” www.CentralBankNews.info
With his portfolio “solidly anchored” in silver and gold, sector expert Michael Ballanger opines on how bankers and politicians can manipulate markets.
As a child, I used to get quite excited at the prospect of having my English “Gran” read me the Hans Christian Andersen book “The Emperor’s New Clothes.” I found the tale fiendishly amusing, as the charlatan tailor uses lethal doses of flattery and mystery to beguile the poor sovereign into really believing that he is wearing the finest robes ever woven. There is even greater irony in the crowds he passes during a parade as they “Oooh” and “Awww” at his comic preening, knowing full well that he is making a fool of himself but too fearful to do anything but play along. The ending is sublime, with the ultimate moment of reckoning coming “from the mouths of babes,” in the form of a young lad who finally blows the whistle with the innocent but true acknowledgement that, indeed, the emperor was parading pitifully through the town square clad only in his knickers.
I think that I admired and, in fact, envied the scallywag tailor in a manner not dissimilar to the way I am awed by this recent bevy of bankers and politicians. They stand in front of the cameras with their carnival barker bravado and serpentine smiles as they lift trillions of dollars from the future wallets of the taxpaying public and distribute it shamelessly among their capitalist cronies.
You will have to forgive me for defaulting back to the singular best description of the current environment, emblazoned for posterity into our collective psyche by Sir Winston Churchill when he said, “Never let a good crisis go to waste.” The sheer wisdom of that statement is exceeded only by its sheer cynicism, a practice to which I heartily subscribe.
To wit, that I have been (and continue to be) an irritating gnat in the ears of the Millennial Generation is neither a secret nor a placard. However, I place in these youngsters zero fault for taking such an equally cynical approach to the current global health crisis. They should be outraged by the actions taken by the Baby Boom geriatrics in charge of the “handling” of the outbreak, and indeed they are. Swirling around the twitterverse and the blogosphere are conversations about the COVID-19 pandemic that include descriptives like “Boomer Remover,” which, while in very poor taste in light of the death tolls, reflects the growing mistrust of youth in the global leadership, the bulk of whom would fall into the “boomer” demographic.
Ours is the generation that marched in the streets against racism and war, and then promoted the entire concept of “free market capitalism” for decades. We constantly amped up the frequency and volume of monetary inflation while blindly saying “support our troops,” without questioning why they were being sent off to foreign lands to combat enemies too elusive to confront and too abstract to hate. The banco-politico alliance told us that 9/11 was a “crisis,” so invading a sovereign nation was justified. In fact, the West has been at war in the Middle East now for nearly three decades and there are still terrorists blowing up civilians while young men and women are being returned in body bags to native soils in America, Canada and numerous other NATO lands.
Now, I don’t want to get too morose here but there is absolutely no reason to be surprised if there are crowds marching on the capital cities of the G20, torches and pitchforks in hand, demanding big changes in the “bailout and entitlement queue.”
What really irks me (and should irk you) is that the banco-politico alliance have not “let a good crisis go to waste” but, quite on the contrary, have not only seized it but actually may have created it. Conspiracy theories put aside, with central bank balance sheets all seriously impaired by last September, choked to the esophageal gills with the toxic waste of the last crisis (2008), it is quite possible that these cretins actually needed an excuse to launch a “shock-and-awe” campaign of unbridled money-printing, fully condoned by a terrified legislative and “all-knowing” leadership.
As I have written before, the crisis I identified in the 2020 Forecast Issue was debt, and the first inkling of trouble arrived in September, when JPMorgan’s Jamie Dimon first went public with the “trouble in the interbank market” comment during a CNBC interview, followed by the rapid and predictable response by the Fed (REPO). What started as a “temporary” event and “no QE” (quantitative easing) quickly morphed into “permanent” and “massive QE,” and that was before the pandemic even arrived.
No one will ever know for certain, but as Richard Russell would often counsel, “Follow the money.” This leads me to believe that while the elitists probably had nothing to do with the origin of the virus, they have certainly used it to their fullest advantage. Now the Fed balance sheet has grown (and will continue to grow) to unfathomable levels while the treasury departments of all nations around the globe are currently embarked on massive campaigns of debt monetization, the extent of which has become surreal in the true sense of the word.
I was hoping to be wrong in my cynicism, and see the recipient list for the handouts and bailouts not include the banks but, alas, it is not to be. As always, the money has to be channeled through the fee-starved banks because, after all, interest payments on loans held by these “poor banks” must be paid, and as the U.S. is in an election year, they can’t have mortgage defaults spiraling into the abyss while votes are on the table.
In the end, just as that emperor was able to walk without fanfare for what might have been seen as an eternity in retrospect, undergarments disguised as golden robes, the world has long been convinced that the wealth and longevity of the Western World, led by the U.S., was the direct result of “Free Market Capitalism.” That, my friends, is the greatest fallacy of the New Millennium. It did not “go slowly into that good night;” it fell to the ground in ruin, one crisis at a time.
Once the bastion of goodness, “Free Market Capitalism” is now a smoldering pile of rubble, while in its place rises a new world order of “Rigged Market Socialism,” where the wonderfully fertile process of true price discovery has been supplanted by interference, manipulation and price management. Ayn Rand wrote of it in 1957 with her epic novel “Atlas Shrugged,” a work that is now prologue to the events of the last eight weeks, with the phrase “Who is John Galt?” echoing throughout the chambers of policy debate and political strategies.
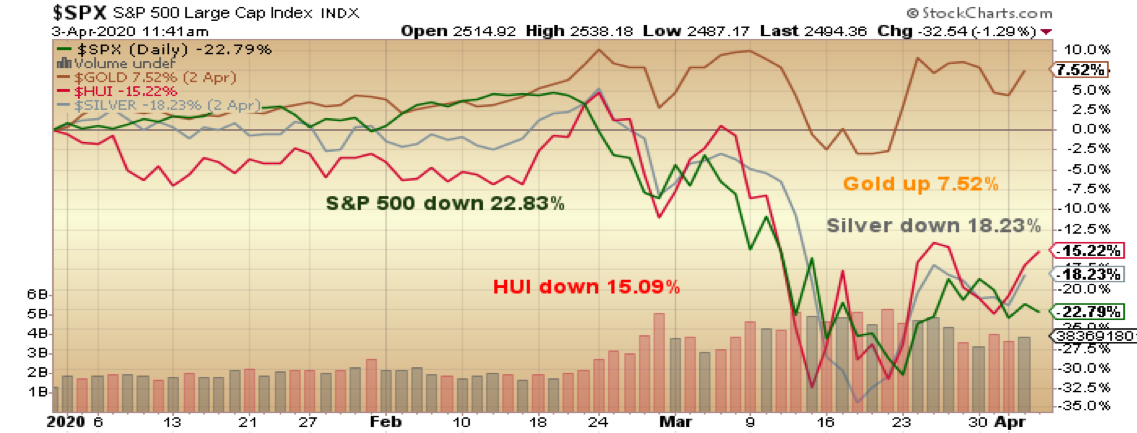
As greatly as I might resemble a Scrooge-like curmudgeon in today’s missive, I give thanks that my portfolio is solidly anchored in a balance of gold and silver assets whose prices are divergent but, on balance, largely positive on the year. To be down year to day anything less than the 22.79% drop in the S&P 500 is a bonus, but to be ahead is a testimonial to the utile effectiveness of a gold-centric portfolio.
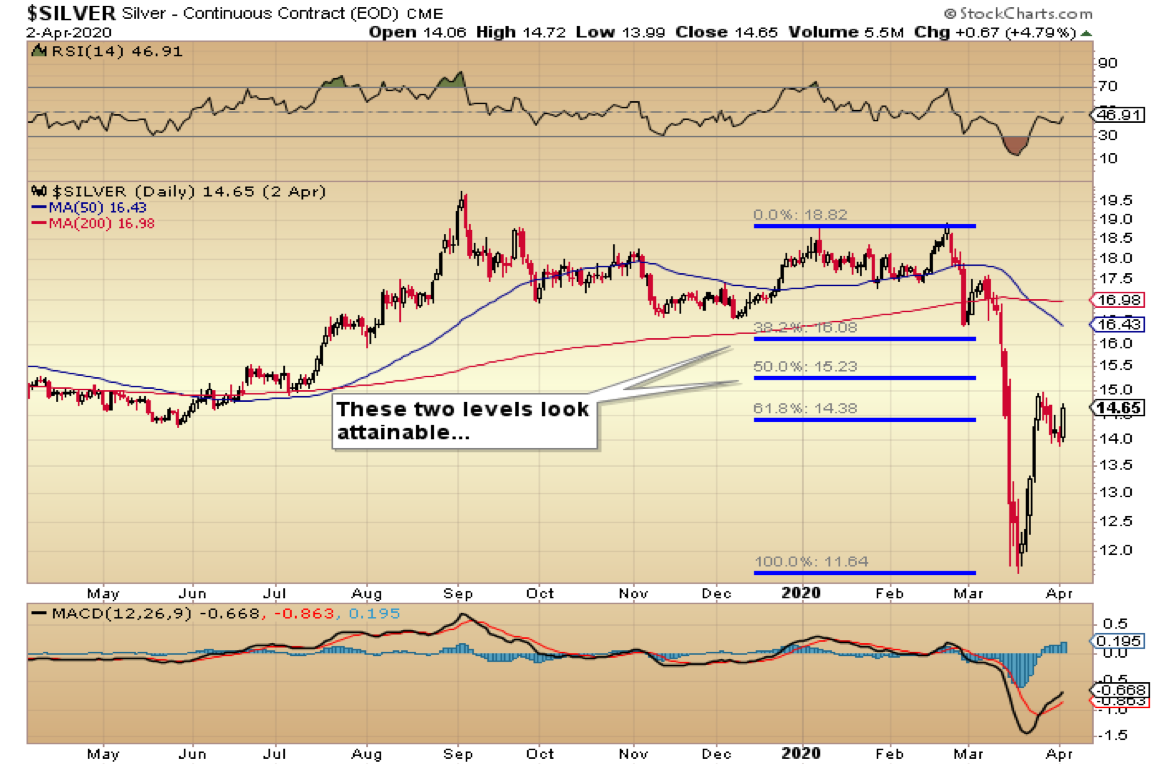
Silver, by contrast, has been a dismal underperformer, for all the reasons I mentioned earlier, and despite recent strength remains in a bear market.
I usually roll my eyes when I read some newsletter “guru” taking victory laps for making a lucky guess at the short-term direction of the precious metals. But even worse is the guy that reminds you that he has “always advocated gold” while failing to remind us all that gold endured a horrific bear market from August 2011 to December 2015, with the HUI falling from over 600 to under 100. I try to identify swings in both gold and silver because you do not want to be 100% long anything all the time. However, never in my forty-plus years in association with the mining and metals arena have I come across a more opportune time to hold gold assets than now. I cannot underscore this. We are going to go through a near-term deflationary scare here first, but what will follow will be an inflationary firestorm, the likes of which will make Weimar, Zimbabwe and Venezuela look like Switzerland.
Year to date, gold has been like a dutiful Saint Bernard. It pulled all of us out of an avalanche of snow and continues to revive of us with the barrel of brandy around its neck. It has behaved, and continues to behave, exactly as it should. It is really important to understand that as we look back in time, we see an asset that not only responds to current demand, it also responds to the current policy initiatives of “those in power that would try to save us.” So, these desperate measures being undertaken by banco-politico alliances across the globe are the reasons that I am buying more on any weakness that appears.
Tactically, on the assumption that we will see a $2,000/ounce gold price by 2021, the biggest leverage comes in owning the marginal producers, but even more so in the developers. The developers that own gold ounces in the ground, but not yet mined, represent outstanding upside because if they are valued at $20 per ounce for a deposit carrying an AISC (all-in sustaining cost) of US$1,500/oz., they will get a $100/ounce lift as their profitability moves from $150 to $500/ounce. That one-million-ounce deposit valued at $20 million gets suddenly rerated to $120 million, and whereas the price of gold advanced 21%, the value of the company rose by 600%. This is the epitome of leverage in the world of gold mining.
While the list of companies that fall into the “developer/explorer” category is reserved for subscribers, there are a few that have been outstanding performers. Two of these “penny dreadfuls hit 2020 highs this week and both are gold deals. The same thing is going to happen when silver finally breaks out of its bear market. But for now, the marginal producers and nascent gold producer/developers are the place to be.
The chart of silver shown above, containing some Fibonacci levels covering the peak-to-trough crash, offers some guidance, and while I do not pretend to be a technical analyst by any stretch, silver has finally scratched its way above that first resistance at US$14.38/ounce, with the next two levels possible. To turn the near-term trend positive (i.e., something more than a dead-cat bounce), we need a solid close above US$16.08/ounce.
Back in November the Fed’s REPO actions began to accelerate, making it appear evident that the Fed was content to let the economy run “hot” for “awhile” in order to jumpstart productivity. This was a clear signal to many of us that all was not well with the U.S. economy, and while people shrugged it off as a temporary problem brought on by Trump’s Trade War (with everyone), I surmised that it was going to have unintended consequences, which it did.
The constant interference in the paper markets include the Crimex in New Yord and the LBMA (London Bullion Market Association) in London, and as I wrote about in “A Tale of Two Markets” last week, investors are moving rapidly up the learning curve with this insatiable appetite for physical gold and silver. Seeing a paper market offering at US$14.55 for an ounce of digital silver, but having to pay US$23.87 for a deliverable ounce of the same metal with six-month lag time, is the largest and most malodorous smoking gun ever left at a murder scene. The banks are playing a totally different game with a totally different set of rules, and it will not end well.
I wrote in the Forecast issue that I fully expect to see a reset in the U.S. dollar gold price, prompted by the very people who have been resisting it for decades. Continuing along the path of “follow the money,” look no further than U.S., the International Monetary Fund and Germany for the instigators of this collateral mark-up. The banco-politico alliance is not only out of new bullets, and not only are the old bullets having little to no impact, they have only one option left, and that is the gold holdings. They must re-collateralize their precious banks and they have only one means to do thatthey must re-price their only remaining collateral.
With the bullion bank shorts still at uncomfortably high levels (280,000 plus), it could not come at a more propitious time.
Welcome to the New World Order of “Rigged Market Socialism.”
Originally trained during the inflationary 1970s, Michael Ballanger is a graduate of Saint Louis University where he earned a Bachelor of Science in finance and a Bachelor of Art in marketing before completing post-graduate work at the Wharton School of Finance. With more than 30 years of experience as a junior mining and exploration specialist, as well as a solid background in corporate finance, Ballanger’s adherence to the concept of “Hard Assets” allows him to focus the practice on selecting opportunities in the global resource sector with emphasis on the precious metals exploration and development sector. Ballanger takes great pleasure in visiting mineral properties around the globe in the never-ending hunt for early-stage opportunities.
Disclosure: 1) Statements and opinions expressed are the opinions of Michael Ballanger and not of Streetwise Reports or its officers. Michael Ballanger is wholly responsible for the validity of the statements. Streetwise Reports was not involved in any aspect of the article preparation. Michael Ballanger was not paid by Streetwise Reports LLC for this article. Streetwise Reports was not paid by the author to publish or syndicate this article. 2) This article does not constitute investment advice. Each reader is encouraged to consult with his or her individual financial professional and any action a reader takes as a result of information presented here is his or her own responsibility. By opening this page, each reader accepts and agrees to Streetwise Reports’ terms of use and full legal disclaimer. This article is not a solicitation for investment. Streetwise Reports does not render general or specific investment advice and the information on Streetwise Reports should not be considered a recommendation to buy or sell any security. Streetwise Reports does not endorse or recommend the business, products, services or securities of any company mentioned on Streetwise Reports. 3) From time to time, Streetwise Reports LLC and its directors, officers, employees or members of their families, as well as persons interviewed for articles and interviews on the site, may have a long or short position in securities mentioned. Directors, officers, employees or members of their immediate families are prohibited from making purchases and/or sales of those securities in the open market or otherwise from the time of the interview or the decision to write an article until three business days after the publication of the interview or article. The foregoing prohibition does not apply to articles that in substance only restate previously published company releases.
Charts provided by the author.
Michael Ballanger Disclaimer: This letter makes no guarantee or warranty on the accuracy or completeness of the data provided. Nothing contained herein is intended or shall be deemed to be investment advice, implied or otherwise. This letter represents my views and replicates trades that I am making but nothing more than that. Always consult your registered advisor to assist you with your investments. I accept no liability for any loss arising from the use of the data contained on this letter. Options and junior mining stocks contain a high level of risk that may result in the loss of part or all invested capital and therefore are suitable for experienced and professional investors and traders only. One should be familiar with the risks involved in junior mining and options trading and we recommend consulting a financial adviser if you feel you do not understand the risks involved.
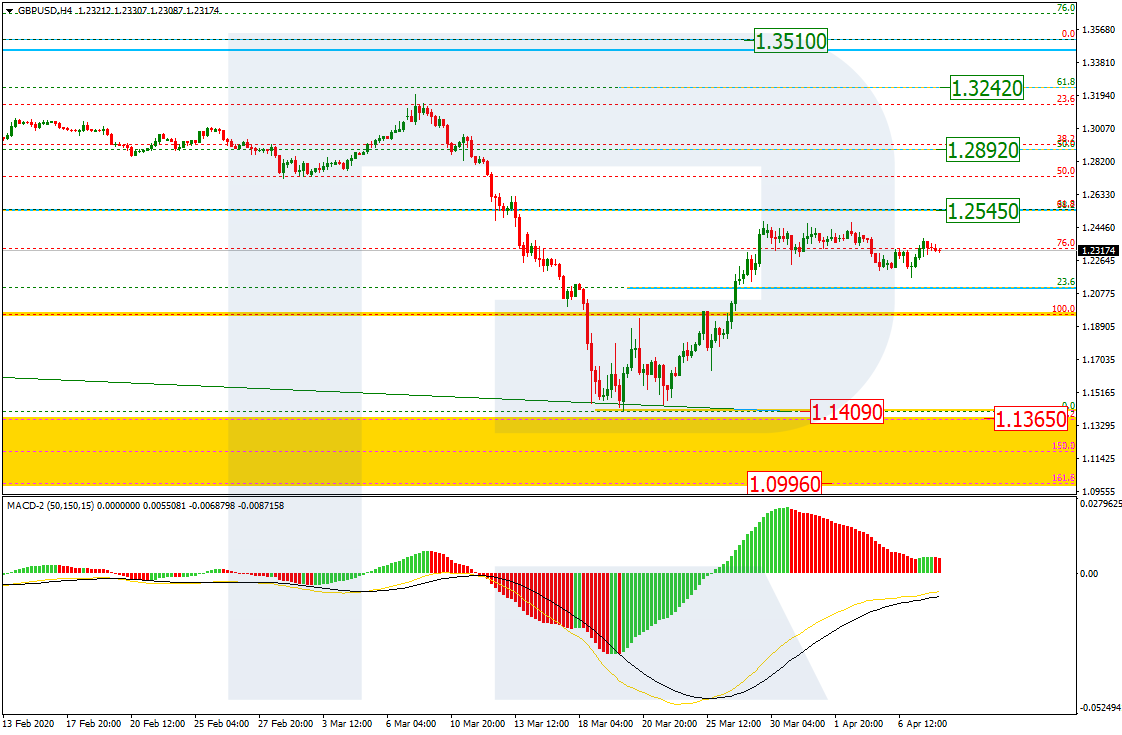
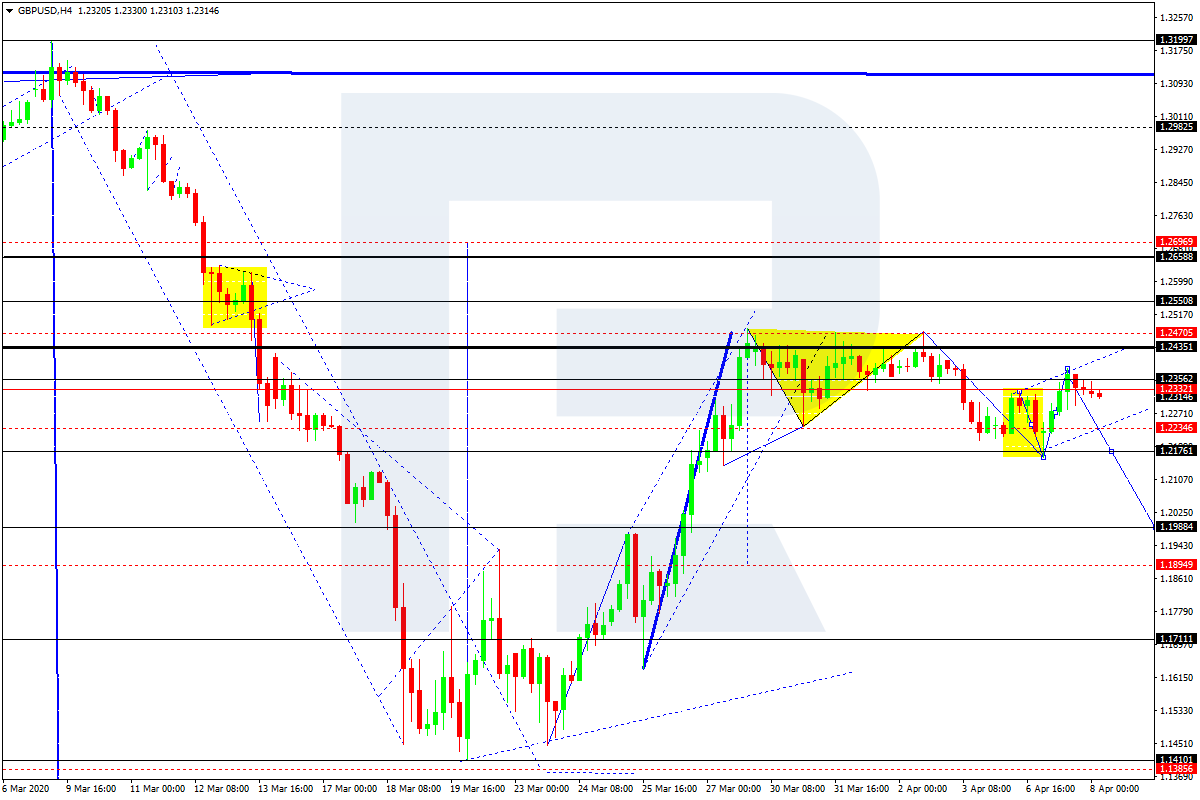
As we can see in the H4 chart, GBPUSD is forming a new rising tendency as a reversal of the previous downtrend. After breaking 23.6% fibo, the first ascending impulse has stopped at 38.2% fibo at 1.2545. The short-term scenario may be described as a correction of the first impulse. After finishing the correction, the pair may start another impulse to the upside to reach 38.2%, 50.0%, and 61.8% fibo at 1.2545, 1.2892, and 1.3242 respectively. If the price breaks the low at 1.1409, the instrument may continue falling towards the post-correctional extension area between 138.2% and 161.8% fibo at 1.1365 and 1.0996 respectively.
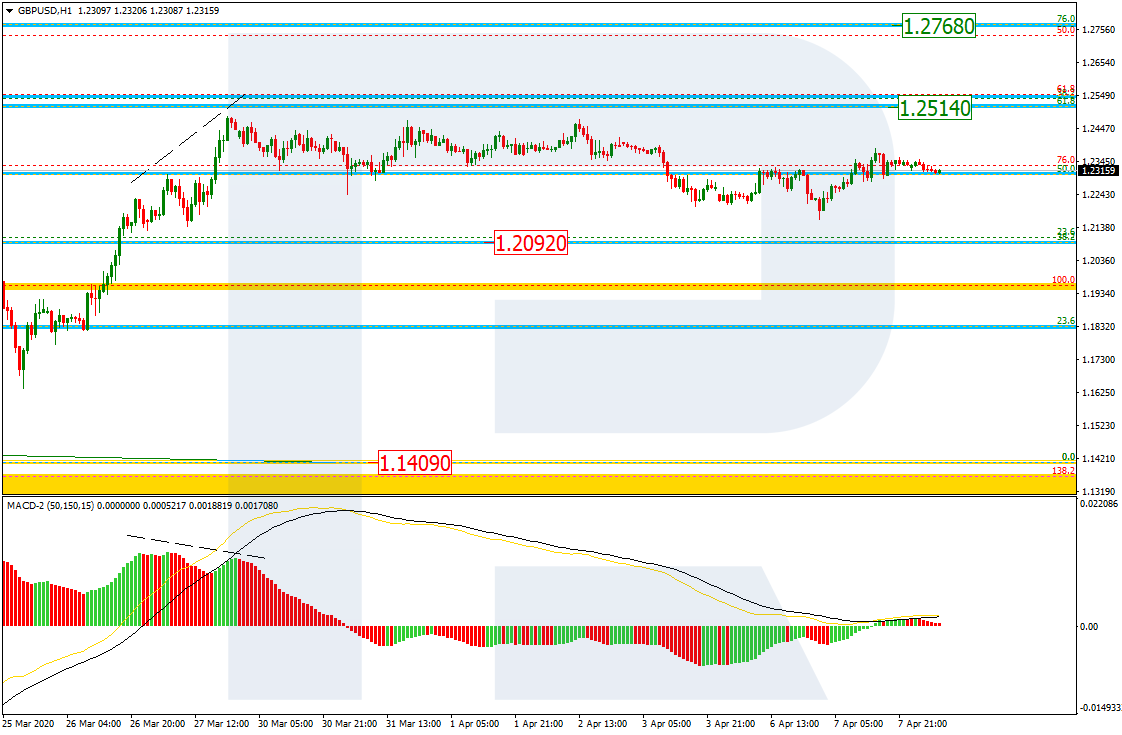
The H1 chart shows a more detailed structure of the current correction. The target of this pullback is 38.2% fibo (1.2092).
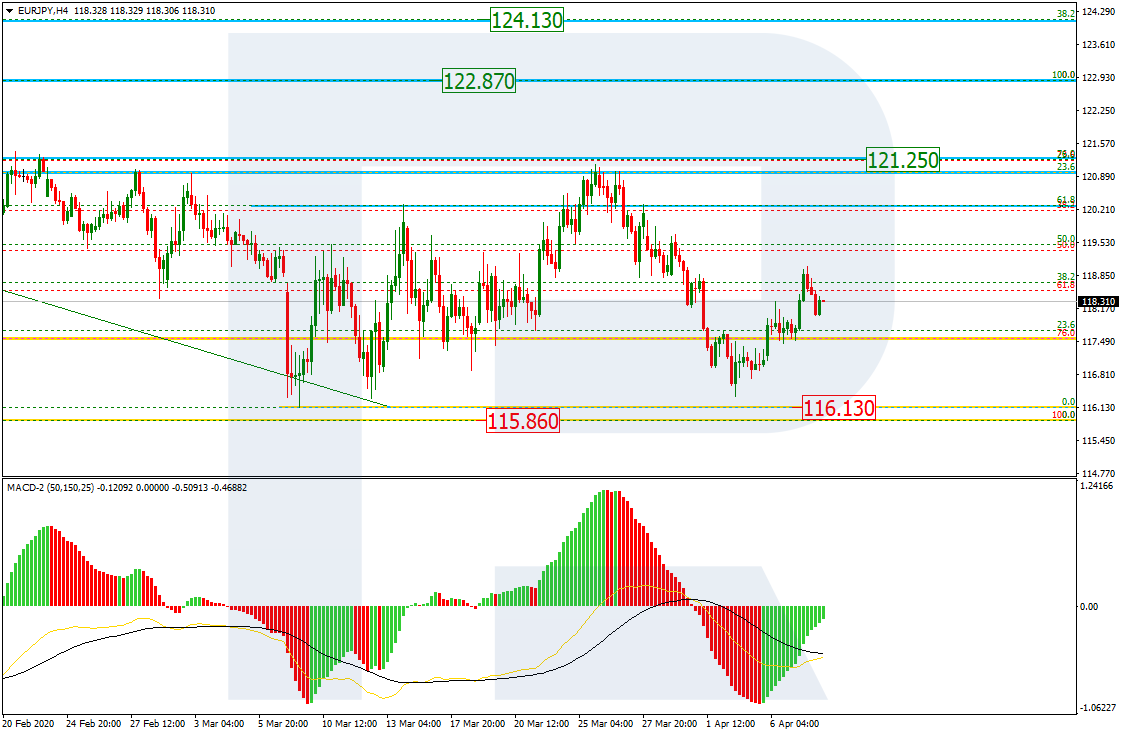
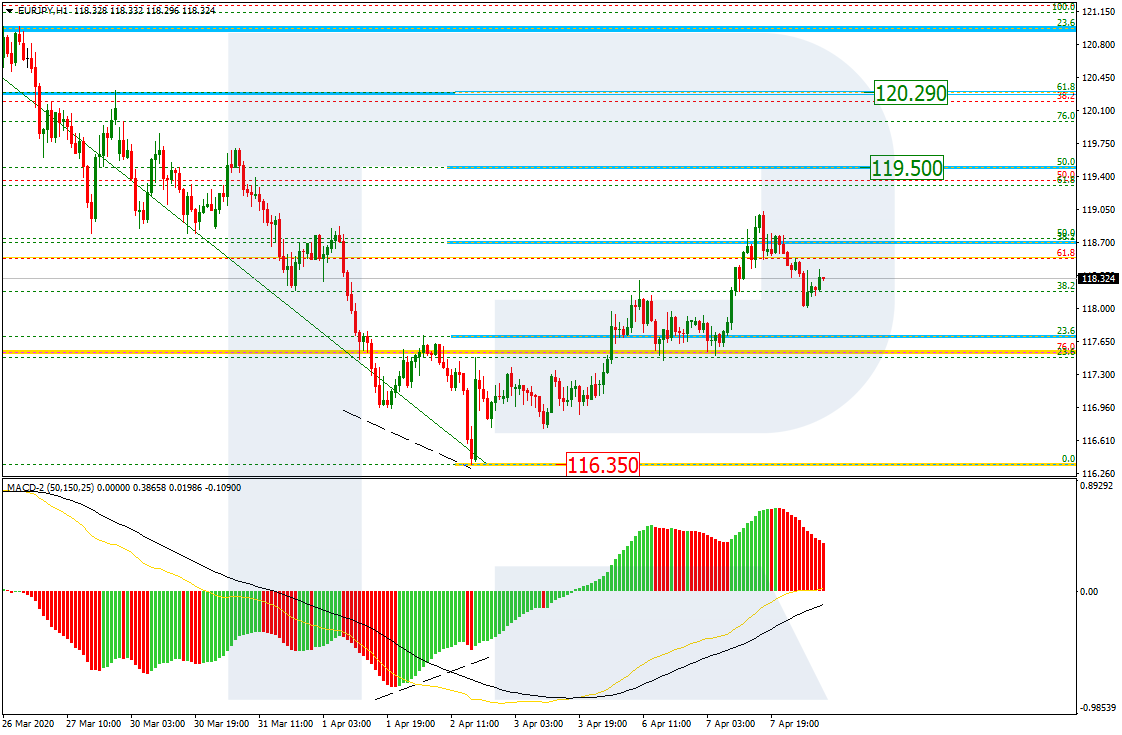
EURJPY, “Euro vs. Japanese Yen”
As we can see in the H4 chart, after failing to break the local low at 116.13 and then falling towards 115.85, EURJPY may start a new growth or even a long-term ascending wave. The first signal of the new long-term tendency may be the price’s reaching 76.0% fibo at 121.25 and then breaking the high at 122.87. After breaking this level and forming a slight pullback, the instrument may resume growing to reach its long-term target at 38.2% fibo (124.13).
The H1 chart a more detailed structure of the current uptrend. The pair has already reached 38.2% fibo and may continue growing towards 50.0% and 61.8% fibo at 119.50 and 120.29 respectively. The support is the low at 116.35.
Attention! Forecasts presented in this section only reflect the author’s private opinion and should not be considered as guidance for trading. RoboForex LP bears no responsibility for trading results based on trading recommendations described in these analytical reviews.
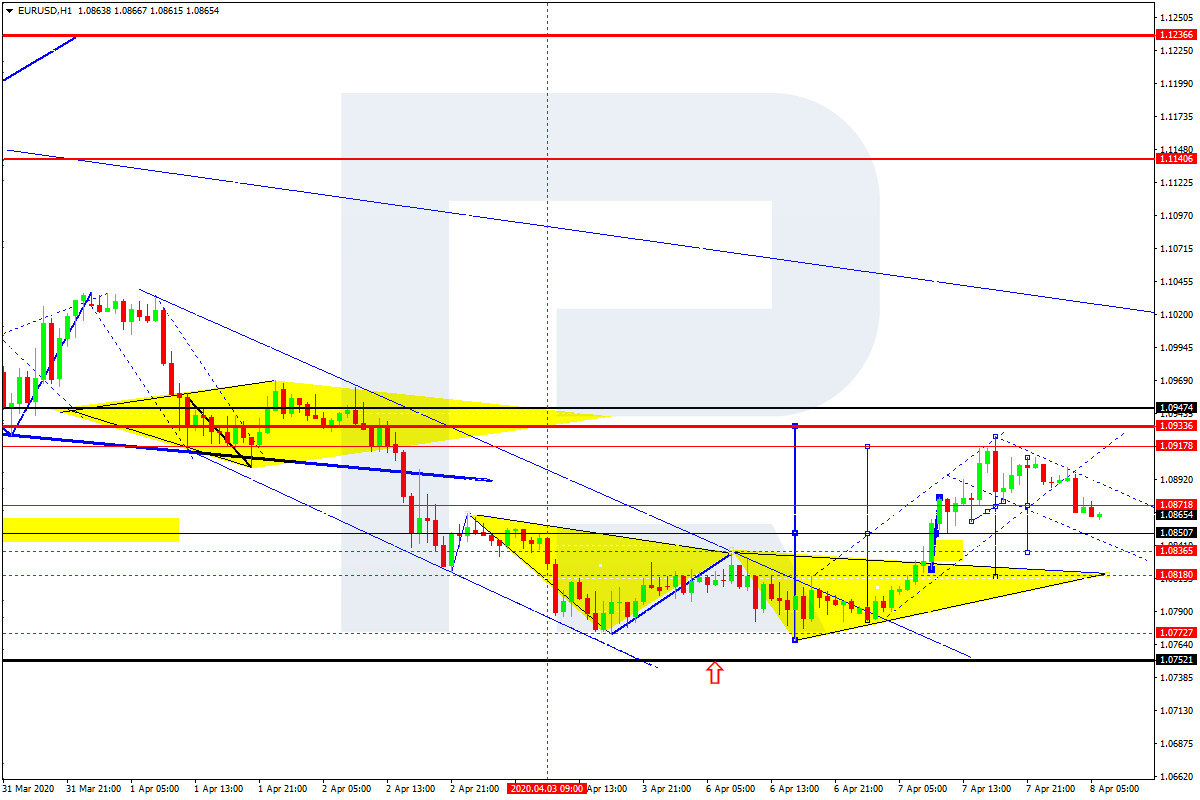
After breaking 1.0836 and then reaching 1.0926, EURUSD is trading downwards to1.0836. After that, the instrument may form one more ascending structure towards 1.0870 and then resume moving inside the downtrend with the target at 1.0820.
GBPUSD, “Great Britain Pound vs US Dollar”
GBPUSD has finished the correctional structure at 1.2356; right now, it is forming another descending wave to reach 1.2176. Possibly, the pair may break this level to the downside and then continue moving inside the downtrend with the short-term target at 1.1988.
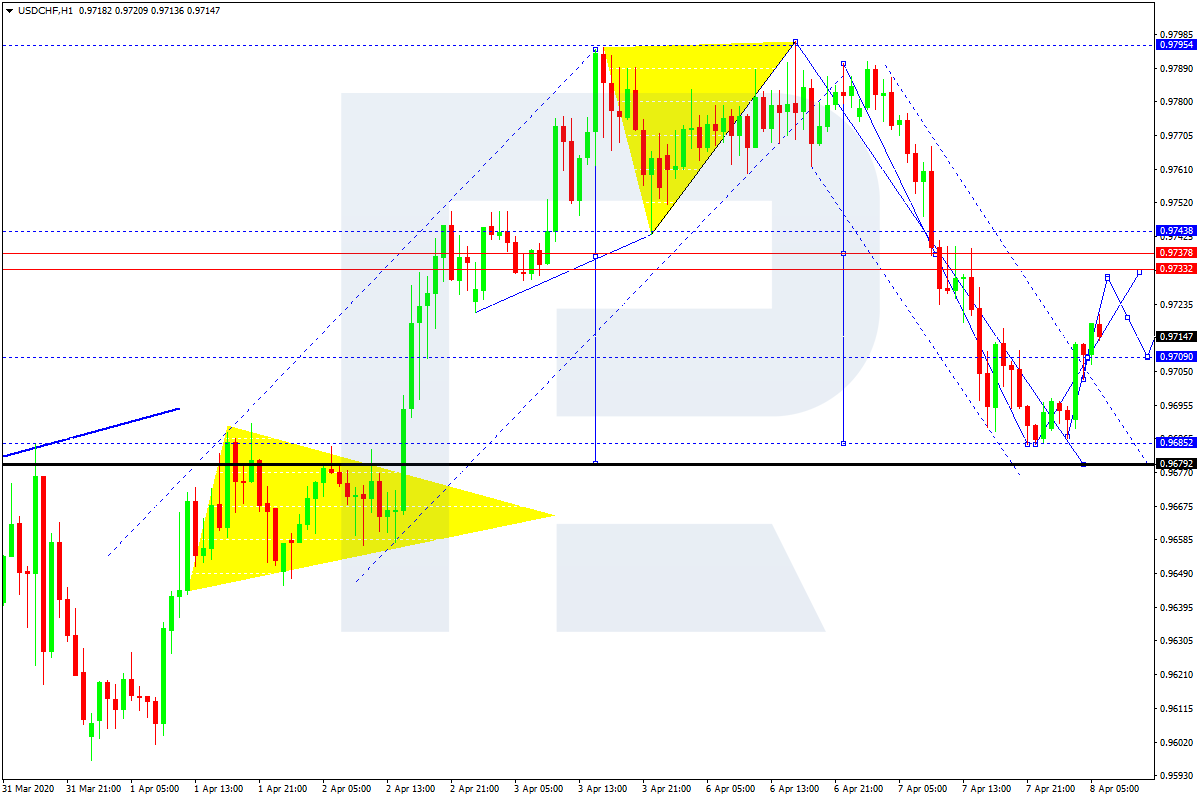
USDCHF, “US Dollar vs Swiss Franc”
After completing the descending wave at 0.9685, USDCHF is correcting towards 0.9733. Today, the pair may reach this level and then form a new descending structure with the target at 0.9679.
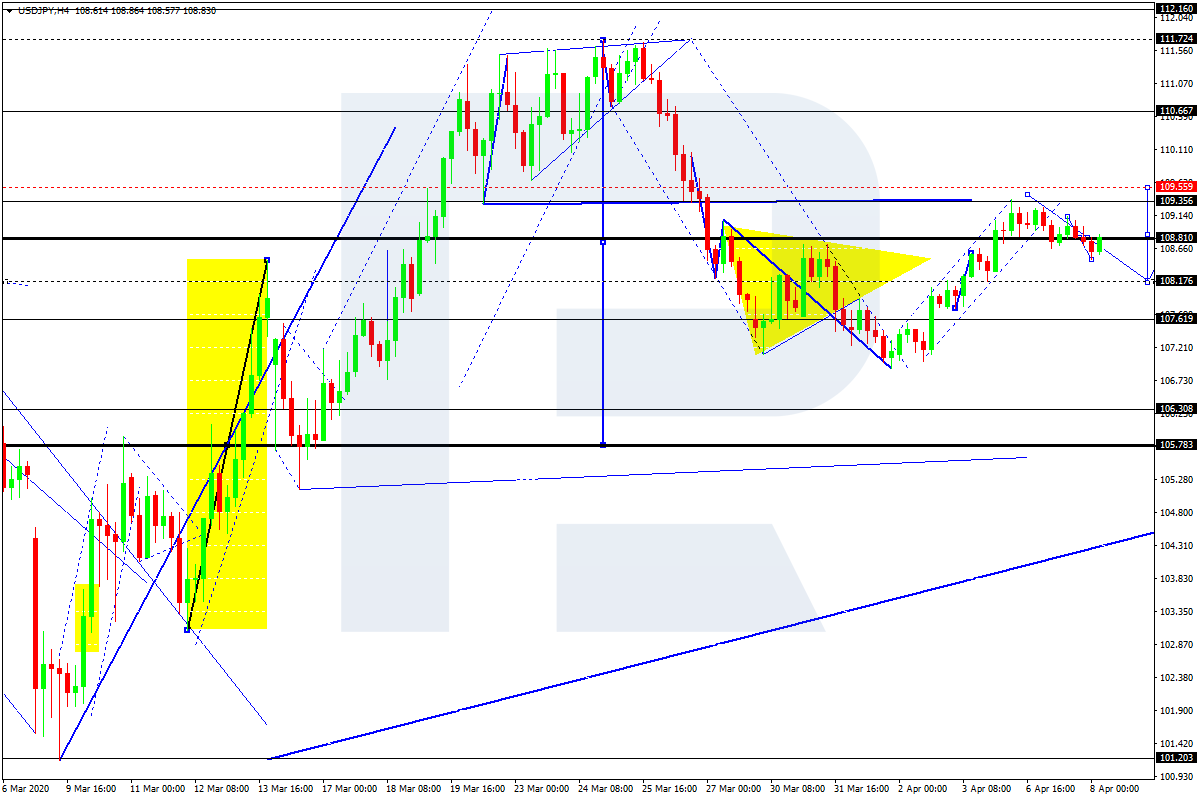
USDJPY, “US Dollar vs Japanese Yen”
After finishing the structure of the first descending impulse at 108.44, USDJPY has returned to 108.95, thus forming a new consolidation range between these two levels. If later the price breaks this range to the upside, the market may form one more ascending structure towards 109.55; if to the downside – resume moving downwards with the target at 107.62.
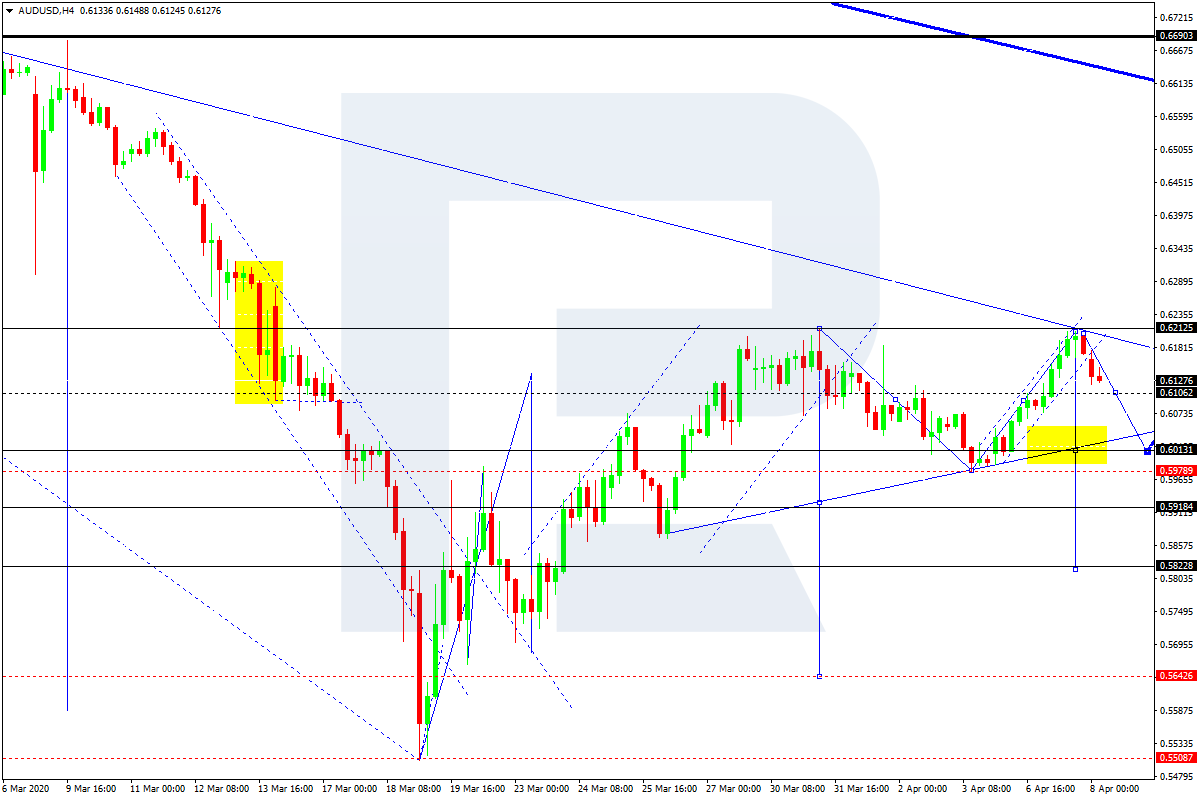
AUDUSD, “Australian Dollar vs US Dollar”
AUDUSD is consolidating around 0.6106. Possibly, the pair may expand the range up to 0.6220 and then fall towards its downside border at 0.5920. After that, the instrument may break this level and start another correction with the target at 0.5822.
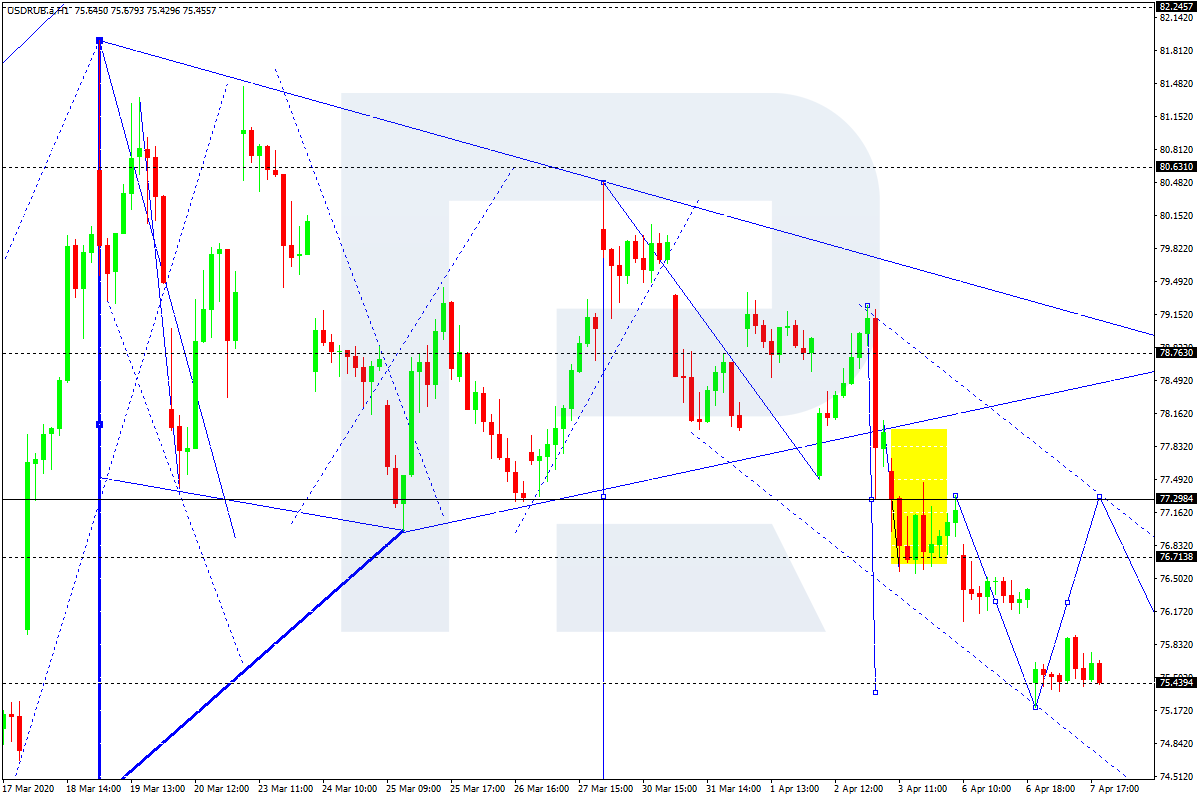
USDRUB, “US Dollar vs Russian Ruble”
USDRUB has finished the descending structure at 75.44. According to the main scenario, the price is expected to correct towards 77.30. Later, the market may resume trading downwards with the short-term target at 74.22.
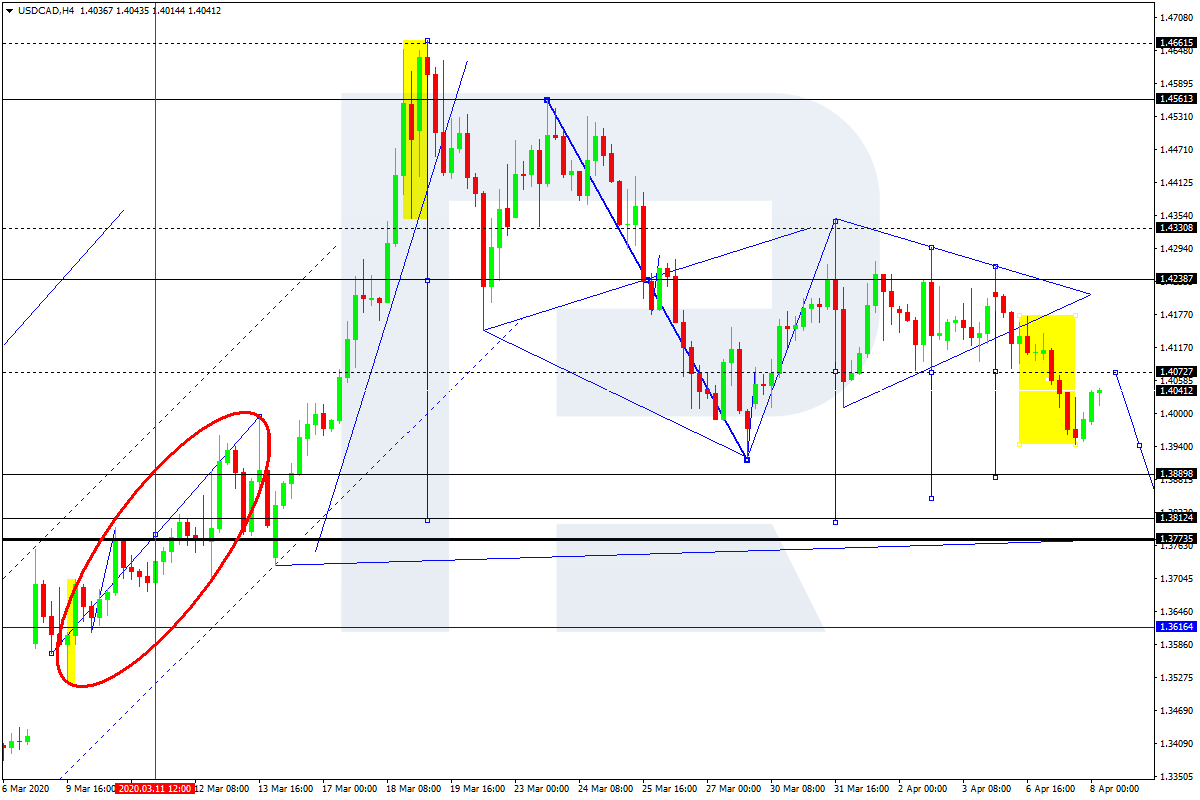
USDCAD, “US Dollar vs Canadian Dollar”
USDCAD continues forming the fifth descending wave; after breaking 1.4060, it has reached 1.3944. Possibly, today the pair may test the broken level from below and then resume trading downwards with the short-term target at 1.3888. The key target is at 1.3812.
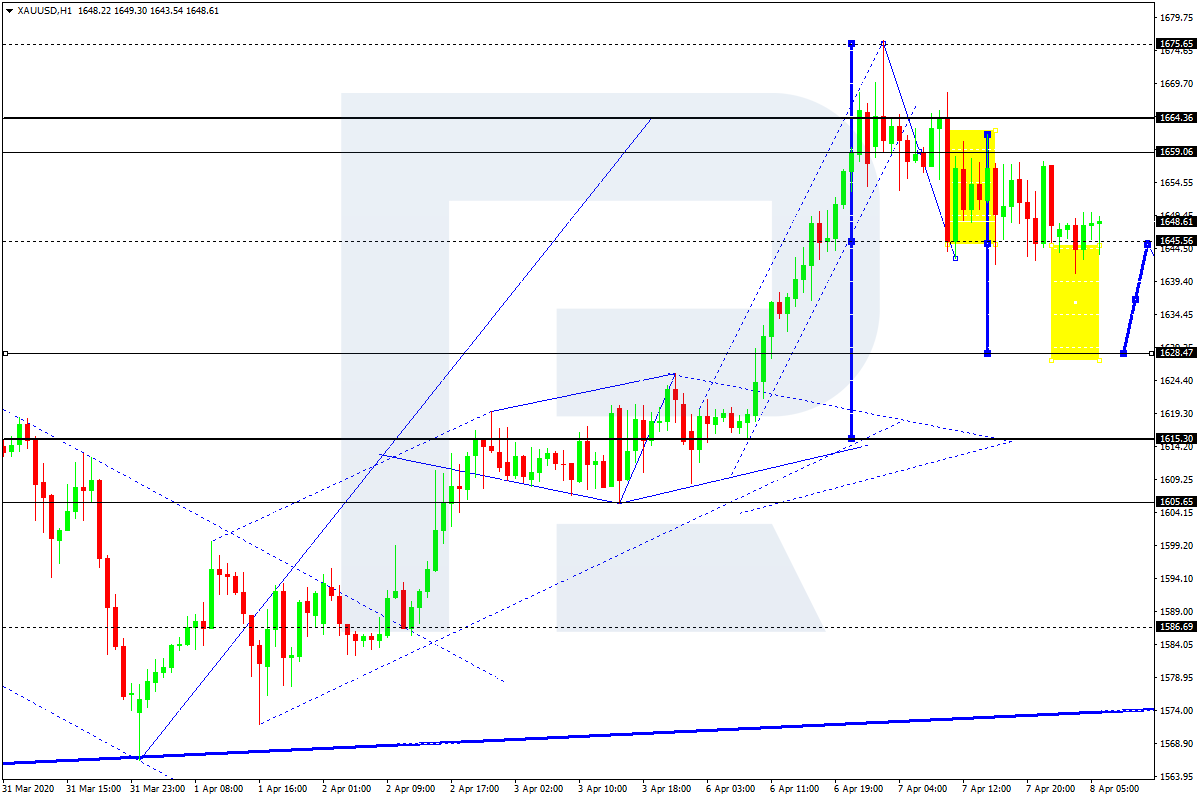
XAUUSD, “Gold vs US Dollar”
Gold continues forming the descending wave towards 1635.77. Possibly, the pair may reach this level and then grow towards 1655.55. Later, the market may resume trading inside the downtrend to continue the correction with the short-term target at 1628.47. The key target is at 1615.30.
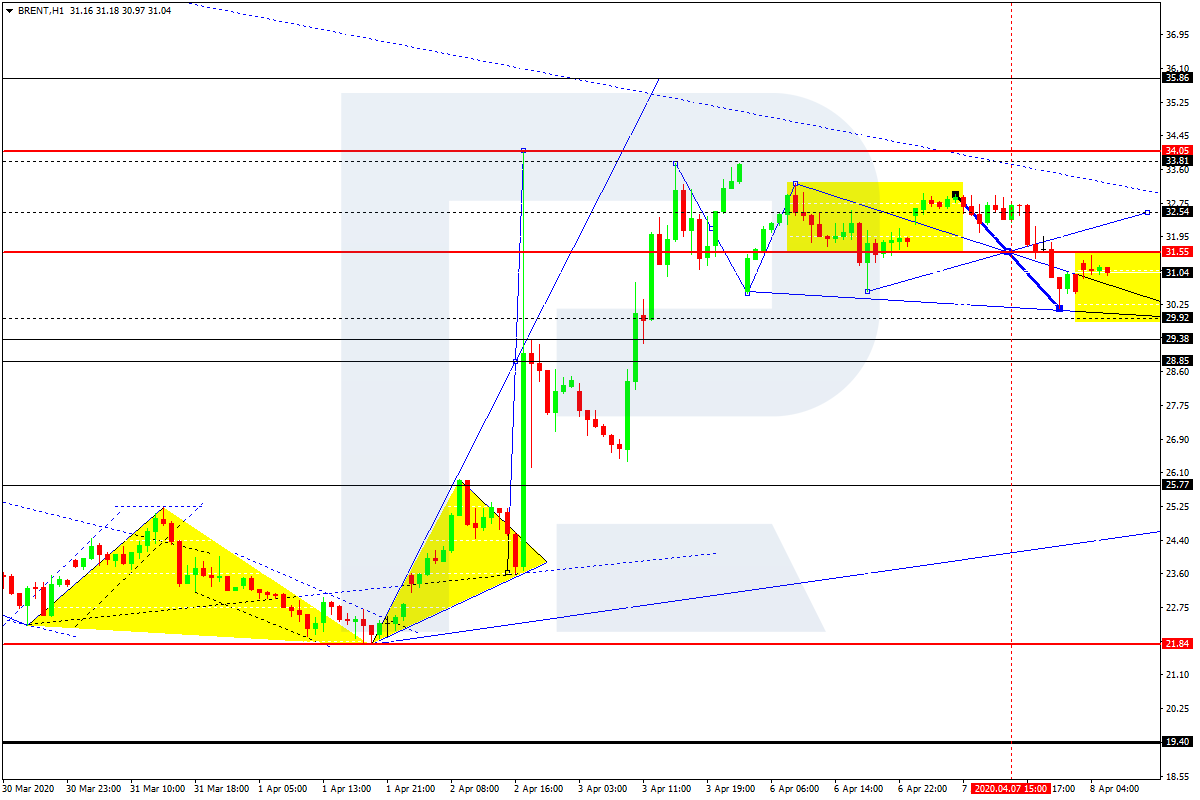
BRENT
Brent is consolidating around 31.65. Possibly, today the pair may fall towards 29.92 and then grow to return to 31.65. Later, the market may form a new descending structure to complete the correction at 29.33. After that, the instrument may resume trading upwards with the target at 35.86.
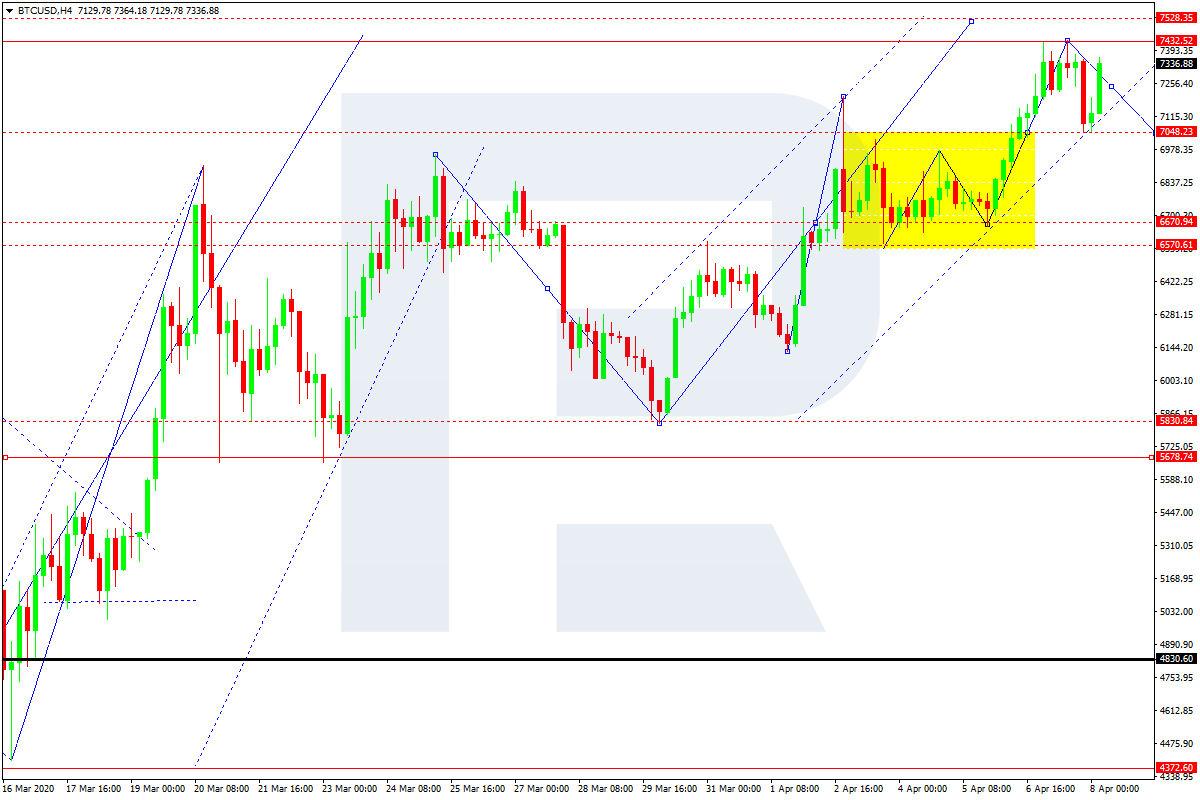
BTCUSD, “Bitcoin vs US Dollar”
BTCUSD is still forming the ascending wave with the target at 7530.00. Later, the market may form the first descending impulse towards 6600.00. After that, the instrument may start a new correction with the key target at 5600.00.
Attention! Forecasts presented in this section only reflect the author’s private opinion and should not be considered as guidance for trading. RoboForex LP bears no responsibility for trading results based on trading recommendations described in these analytical reviews.
Higher demand on supply disruption concerns bullish for rice price
One of the effects of coronavirus lockdown measures has been a spike in demand for food staples as consumers worry about supply disruptions. Rice price particularly recorded a third straight monthly increase. As a result, export prices for rice from Thailand, the world’s second-biggest shipper, are at a six-year high. Higher demand is bullish for rice prices. However, experts estimate export availability for crops like wheat, rice, maize and soybean are “more than adequate to meet the anticipated demand”, according to the Agricultural Market Information System (AMIS) comprised of ten international organizations including the Food and Agriculture Organization of UN, OECD and World Bank. And AMIS estimates global rice reserves at their second highest on record and sufficient to cover over 4 months of projected world consumption.
The EUR/USD currency pair has moved away from local highs. At the moment, the technical pattern is ambiguous. EUR/USD quotes are consolidating in the range of 1.08250-1.08850. Financial market participants have taken a wait-and-see attitude before the publication of FOMC minutes. We recommend paying attention to the comments by representatives of the regulator. The COVID-19 epidemic is still in the focus of attention. The number of recorded cases of coronavirus in the world exceeded 1.45 million. Positions should be opened from key levels of support and resistance.
At 21:00 (GMT+3:00), the FOMC meeting minutes will be published.
Indicators do not give accurate signals: the price has fixed between 50 MA and 100 MA.
The MACD histogram is near the 0 mark.
Stochastic Oscillator is in the neutral zone, the %K line is above the %D line, which indicates the bullish sentiment.
Trading recommendations
Support levels: 1.08250, 1.07750
Resistance levels: 1.08850, 1.09250, 1.09700
If the price fixes above 1.08850, the EUR/USD currency pair is expected to grow. The movement is tending to 1.09250-1.09500.
An alternative could be a drop in the EUR/USD quotes to 1.07900-1.07700.
The GBP/USD currency pair
Technical indicators of the currency pair:
Prev Open: 1.22303
Open: 1.23253
% chg. over the last day: +0.89
Day’s range: 1.22880 – 1.23528
52 wk range: 1.1466 – 1.3516
The GBP/USD currency pair is still being traded in a flat. There is no defined trend. Investors expect additional drivers. Today, the FOMC meeting minutes will be the key event. The local support and resistance levels are 1.22500 and 1.23450, respectively. We also recommend following current information regarding the distribution of COVID-19. We recommend opening positions from key levels.
The news feed on the UK economy is calm.
Indicators do not give accurate signals: the price has crossed 50 MA and 100 MA.
The MACD histogram is near the 0 mark.
Stochastic Oscillator is in the neutral zone, the %K line has crossed the %D line. There are no signals at the moment.
Trading recommendations
Support levels: 1.22500, 1.21650, 1.20500
Resistance levels: 1.23450, 1.24250, 1.24800
If the price fixes below 1.22500, GBP/USD quotes are expected to fall. The movement is tending to 1.21700-1.21200.
An alternative could be the growth of the GBP/USD currency pair to 1.24250-1.24800.
The USD/CAD currency pair
Technical indicators of the currency pair:
Prev Open: 1.41104
Open: 1.39921
% chg. over the last day: -0.82
Day’s range: 1.39823 – 1.40814
52 wk range: 1.2949 – 1.4668
USD/CAD quotes have moved away from local lows. Loonie is currently consolidating. The technical pattern is ambiguous. The key support and resistance levels are 1.40100 and 1.41000, respectively. Investors expect the publication of the FOMC meeting minutes. We also recommend paying attention to the dynamics of oil quotes. Positions should be opened from key levels.
The News Feed on Canada’s Economy:
– Building permits at 15:30 (GMT+3:00).
Indicators do not give accurate signals: the price has crossed 50 MA.
The MACD histogram is near the 0 mark.
Stochastic Oscillator is in the neutral zone, the %K line has crossed the %D line. There are no signals at the moment.
Trading recommendations
Support levels: 1.40100, 1.39450
Resistance levels: 1.41000, 1.41750, 1.42600
If the price fixes below 1.40100, a further drop in the USD/CAD quotes is expected. The movement is tending to 1.39500-1.39200.
An alternative could be the growth of the USD/CAD currency pair to 1.41500-1.41800.
The USD/JPY currency pair
Technical indicators of the currency pair:
Prev Open: 109.216
Open: 108.744
% chg. over the last day: -0.47
Day’s range: 108.505 – 109.005
52 wk range: 101.19 – 112.41
At the moment, the USD/JPY currency pair is consolidating. There is no defined trend. USD/JPY quotes are testing local support and resistance levels: 108.550 and 109.000, respectively. Publication of the FOMC meeting minutes is in the spotlight. We also recommend paying attention to the dynamics of US government bonds yield. Positions should be opened from key levels.
The news feed on Japan’s economy is quite calm.
Indicators do not give accurate signals: the price has fixed between 50 MA and 100 MA.
The MACD histogram is near the 0 mark.
Stochastic Oscillator is in the neutral zone, the %K line is below the %D line, which indicates the bearish sentiment.
Trading recommendations
Support levels: 108.550, 108.150, 107.600
Resistance levels: 109.000, 109.350, 110.100
If the price fixes above 109,000, further growth of the USD/JPY quotes is expected. The movement is tending to 109.400-109.800.
An alternative could be a decrease in the USD/JPY currency pair to 108.200-107.800.