To protect and grow wealth, investors need to carefully monitor other major factors – not just coronavirus, warns the CEO of one of the world’s largest independent financial advisory organisations.
The warning from deVere Group’s Nigel Green follows last week’s sharp rally in global markets – the MSCI experienced its biggest rise in more than a decade – but as first-quarter earnings results season gets underway this week.
Mr Green says: “We will get an insight this week into how heavy a hammer-blow coronavirus has delivered to corporate America and corporate Europe in the first three months of the year.
“Almost inevitably, the results will trigger widespread downward revisions.
“However, this sits against a growing optimistic investor sentiment as many countries move to ease lockdown restrictions and as many of the hardest-hit areas around the world see a flattening of their infection curves.
“Investors are now increasingly looking beyond the immediate poor data towards the likely recovery towards the end of 2020.”
He continues: “Yet Covid-19 is set to have a hold over investment decisions for a long time to come because it has, in many respects, fundamentally changed how we do business.
“For instance, in 2018, it was reported that more than half (56% – source: OWL Labs) the companies in the world allowed remote working. Of course, this figure is now going to be significantly higher as working remotely becomes increasingly the ‘new normal’ in many sectors across the globe.
“New industries will emerge, some existing sectors will rebound and strongly, whereas others will decline.”
Due to its far-reaching impact, investors around the world are not only monitoring the usual markers like the price of gold and oil and international fiscal and monetary policies, but they’re also tracking the global health policies and coronavirus-death tolls, insists Mr Green.
“This is as it should be. But there is also a concern that the all-encompassing coronavirus news could prevent investors from tracking other key factors that could significantly impact their returns.”
The deVere CEO observes that besides Covid-19, investors need to consider a raft of other potential headwinds.
“These include the uncertainty generated by this year’s U.S. presidential election,” he says.
“Uncertainty – something financial markets loathe – typically increases in election periods.
“The 2020 U.S. presidential election is seen by many as particularly important as not only will whoever wins be the CEO of the world’s largest economy, they will be in that role as the world economically readjusts following the global fallout of coronavirus.”
He goes on to say: “The risk of a no-deal Brexit for the UK, EU and global economies also remains a key headwind. The UK government has so far not withdrawn from its threat to walk out on critical and complex talks in June if no progress is being made, despite the mass financial disruption caused by the pandemic.
“Another concern should be the longer-term inflation threat.
“Already bloated central bank balance sheets are about to become larger still. As with the asset purchase initiatives rolled out in the last financial crash, they come with the risk that too much cash is being produced.
“When coronavirus passes, and cash is no longer stashed in the same way, will households and firms use very cheap loans and their cash piles to turbo-charge an economic recovery into inflation?”
Nigel Green concludes: “Clearly, coronavirus remains the number one investment headwind.
“However, to safeguard and grow their wealth, it is essential that investors don’t take their eye off other issues that are likely to impact their returns.”
About:
deVere Group is one of the world’s largest independent advisors of specialist global financial solutions to international, local mass affluent, and high-net-worth clients. It has a network of more than 70 offices across the world, over 80,000 clients and $12bn under advisement.
Caution and unease are set to engulf financial markets ahead of one of the most uncertain earnings seasons for years, as it is expected to offer a bitter appetiser of the painful blow the coronavirus outbreak has dealt to US corporations.
Nevertheless, investors remain somewhat hopeful that the pandemic may be peaking, and this sentiment was reflected across Asian markets on Tuesday morning. The flicker of optimism from Asia could lend support to European shares before earnings kick off later in the day with JPMorgan Chase, Wells Fargo and Johnson & Johnson reporting their numbers. Over the past few weeks, the negative impact of the coronavirus on the global economy has fueled speculation around first-quarter earnings disappointing forecasts. If expectations become reality, risk aversion will most likely make an unwelcome return, ultimately exposing global stocks to downside shocks.
Is the Dollar’s crown under threat?
The Dollar weakened against a basket of major currencies on Tuesday as investors braced for a challenging earnings season.
Buying sentiment towards the Greenback will be tested this quarter as investors evaluate corporate earnings and economic data from the United States, which has been hit hard by the virus. Where the Greenback closes this week will most likely be influenced not only by earnings, but also the latest retail sales and unemployment claims data.
If the coronavirus outbreak has left prolonged cracks in the largest economy in the world, the Dollar’s throne could be under threat with market players seeking safety in the Japanese Yen or Swiss Franc. With regard to the technical picture, the Dollar Index is under pressure on the daily charts with prices heading towards 99.00. A breakdown below this level may open the doors towards 98.90 and 98.30.
Commodity spotlight – Gold
Gold has scaled levels above $1724 not seen in more than seven years, thanks to Dollar weakness and global recession fears.
The precious metal remains in fashion, appreciating almost 13% since the start of 2020. Further gains may be on the cards this week if corporate earnings paint a gloomy picture and the Dollar weakens on disappointing data. Looking at the technical picture, prices could jump higher towards $1730 if a solid weekly close above $1700 is achieved. Alternatively, sustained weakness below may pave open the doors back towards $1675.
Disclaimer: The content in this article comprises personal opinions and should not be construed as containing personal and/or other investment advice and/or an offer of and/or solicitation for any transactions in financial instruments and/or a guarantee and/or prediction of future performance. ForexTime (FXTM), its affiliates, agents, directors, officers or employees do not guarantee the accuracy, validity, timeliness or completeness, of any information or data made available and assume no liability as to any loss arising from any investment based on the same.
– Our Adaptive Fibonacci Price Modeling system incorporates an intelligent “Inference Engine” into internal decision-making and future analysis. This type of “Adaptive Learning” is one of the core elements of Artificial Intelligence – the ability to read inputs, adapting to price structures and setups and infer expected outcomes/results based on a complex decision-making process. Today, we are alerting you that our Adaptive Fibonacci Price Modeling system is suggesting $26 is the next target level for Silver (which is currently trading near $15.65).
Learning how to interpret the data presented by our Adaptive Fibonacci Price Modeling system is simple – it does the internal analysis automatically and presents future target levels and trigger levels on the charts as lines and blocks. Trigger levels are set up as both GREEN and RED lines for current Bullish and Bearish Trends. Each of these trends also has target BLOCKS drawn out into the future representing where the Adaptive Fibonacci system believes the next price target will be located. These target levels are determined by the Adaptive Learning Inference Engine and represent the best outcome of the true Fibonacci price structure we can deliver.
Weekly Silver Chart
This Weekly Silver chart highlights the incredible +66% upside opportunity setting up based on our research. Silver continues to underperform compared to Gold and it continues to be overlooked as a safe-haven metal. Back in September 2019, we authored this article suggesting Silver would become the “Super-Hero” of precious metals. That research is still very valid today.
This Weekly Silver chart highlights our Adaptive Fibonacci Price Modeling system’s results and clearly shows you the upside price target near $26. We believe the US and Global stock markets may continue to weaken as earnings and forward guidance continue to rattle investors’ expectations. This uncertainty will translate into a continued upside price rally in Metals. Gold will obviously lead the way higher, yet we believe the sleeper metal is Silver. Once silver clears recent highs near $19.75, be prepared for an incredible parabolic upside move.
Daily Gold Chart
The other aspect of this move is that Gold will continue to move higher as well. The next upside target for gold is $1840, followed by a brief pause in price, then a continued rally to levels near $2000. If you think the metals rally it sputtering out right now, we urge you to reconsider your thinking.
Before we continue, be sure to opt-in to our free market trend signals before closing this page, so you don’t miss our next special report!
Weekly Gold Chart
Precious metals will likely continue to rally higher and higher, eventually entering a parabolic upside price rally, as global concerns reach a peak. After the US and Global stock markets set up a real price bottom, metals will continue to rally for 8 to 12+ months after that bottom has setup. Metals are about to become one of the fastest-growing assets on the planet and may not stop until well into 2021 or 2022.
Concluding Thoughts:
Do yourself a favor and take a minute to review some of our most recent market research and really prepare for the rally in metals. That last Weekly Gold chart highlights what we believe will be the initial upside price rally (in YELLOW) and shows how Gold will target $2000, then briefly pause, then attempt another upside move to levels above $2300. Our real upside price target for the long-term Fibonacci peak in Gold is near $3750 – that should tell you something really important.
As a technical analyst and trader since 1997, I have been through a few bull/bear market cycles in stocks and commodities. I believe I have a good pulse on the market and timing key turning points for investing and short-term swing traders. 2020 is going to be an incredible year for skilled traders. Don’t miss all the incredible moves and trade setups.
I hope you found this informative, and if you would like to get a pre-market video every day before the opening bell, along with my trade alerts. These simple to follow ETF swing trades have our trading accounts sitting at new high water marks yet again this week, not many traders can say that this year. Visit my Active ETF Trading Newsletter.
We all have trading accounts, and while our trading accounts are important, what is even more important are our long-term investment and retirement accounts. Why? Because they are, in most cases, our largest store of wealth other than our homes, and if they are not protected during a time like this, you could lose 25-50% or more of your entire net worth. The good news is we can preserve and even grow our long term capital when things get ugly like they are now and ill show you how and one of the best trades is one your financial advisor will never let you do because they do not make money from the trade/position.
If you have any type of retirement account and are looking for signals when to own equities, bonds, or cash, be sure to become a member of my Long-Term Investing Signals which we issued a new signal for subscribers.
Ride my coattails as I navigate these financial markets and build wealth while others lose nearly everything they own during the next financial crisis.
US stocks dip while Trump says will decide on reopening economy
US stock market ended mixed on Monday as President Trump said he’d soon make a decision “in conjunction” with governors on reopening states. The S&P 500 lost 1% to 2761.63. Dow Jones industrial fell 1.4% to 23390.77 led by 8.7% drop in Caterpillar after Bank of America downgraded it to underperform from neutral. The Nasdaq however gained 0.5% to 8192.42 led by 6% jump in Amazon. The dollar weakening halted as Treasury insisted on loans, not cash grants for $25 billion in airline industry aid: the live dollar index data show the ICE US Dollar index, a measure of the dollar’s strength against a basket of six rival currencies, added 0.2% to 100.77 but is lower currently. Futures point to higher openings today.
European markets reopen today
European stock markets will reopen today after Easter Monday holiday. The EUR/USD reversed climbing yesterday unlike GBP/USD , with both pairs higher currently. German health minister said yesterday the country was considering steps to return to a ‘new normal.’ Spain lifted some coronavirus lockdown measures while Italy recorded lowest daily deaths since March.
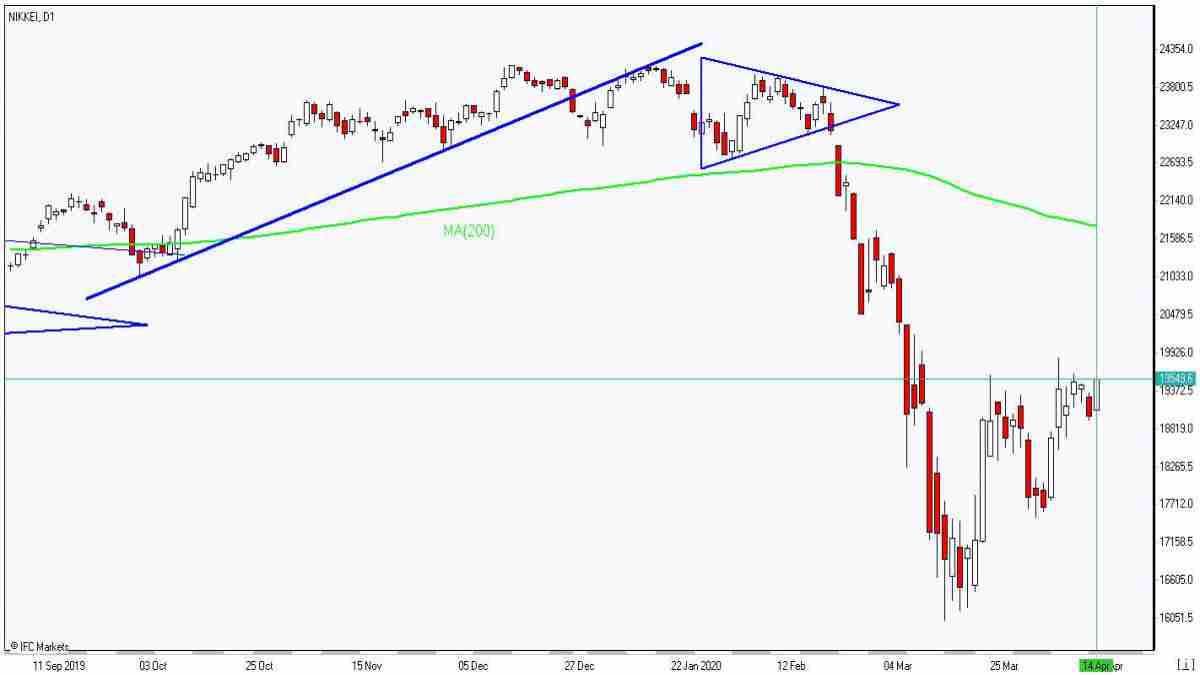
Nikkei leads Asian indexes rebound
Asian stock indices are higher today as investors continue to watch for signs that the coronavirus outbreak may be leveling off. Nikkei jumped 3.1% to 19631.15 as yen slowed its climb against the dollar. Markets in China are rising despite report China’s exports fell further in March amid coronavirus shutdowns: the Shanghai Composite Index is up 1.2% and Hong Kong’s Hang Seng Index is 0.7% higher. Australia’s All Ordinaries Index advanced 1.9% as Australian dollar’s climb against the greenback continued.
Brent futures prices are extending gains today. Members of the Organization of Petroleum Exporting Countries and its allies, collectively known as OPEC+, agreed Sunday to cut crude oil production by 9.7 million barrels a day starting on May 1 through June 30 of this year. Mexico had initially blocked the deal but President Trump intervened agreeing that the US will compensate what Mexico cannot add to the proposed cuts. June Brent crude closed 0.8% higher at $31.74 a barrel on Monday.
Gold advances as Dollar resumes weakening
Gold prices are extending gains today. June gold rose 0.5% to $1761.40 an ounce on Monday .
Note: This overview has an informative and tutorial character and is published for free. All the data, included in the overview, are received from public sources, recognized as more or less reliable. Moreover, there is no guarantee that the indicated information is full and precise. Overviews are not updated. The whole information in each overview, including opinion, indicators, charts and anything else, is provided only for familiarization purposes and is not financial advice or а recommendation. The whole text and its any part, as well as the charts cannot be considered as an offer to make a deal with any asset. IFC Markets and its employees under any circumstances are not liable for any action taken by someone else during or after reading the overview.
“All of the projection models were wrong. All of them,” admitted New York Governor Andrew Cuomo in an interview last week with MSNBC.
Governor Cuomo had been issuing frantic demands for tens of thousands of ventilators… that turned out not to be needed as the rate of new hospitalizations for COVID-19 infections in New York plunged with surprising speed.
Governor Cuomo had warned America that New York City was the canary in the coal mine, that other cities would soon suffer similar death rates.
Deeply flawed infection models have led to economic and societal devastation.
And based on models cited by Dr. Anthony Fauci just a few days ago, the United States was expected to rack up around 200,000 deaths from the virus – or more than 2 million if we failed to socially distance, according to other widely cited models.
Thankfully, all those models were wrong.
The new ones show daily death counts peaking out around now at dramatically lower than projected levels and new cases continuing to plunge, as is the typical seasonal pattern in April for cold and flu-like infections.
A sustained decline in coronavirus cases for the remainder of this month would likely mean the U.S. economy could begin to reopen unless myopic medical experts continue to get their way.
However, a lifting of lockdowns doesn’t mean things will return to normal anytime soon. The pre-virus economy as we knew it will likely never return.
Some businesses and business practices will be gone forever. Many consumer buying, saving, and investing habits will also likely change permanently and in ways nobody at this point can predict.
U.S. monetary policy certainly won’t be able to “normalize” back to pre-virus practices.
The Federal Reserve’s balance sheet is exploding, literally by the trillions every week, with purchases of government and corporate bonds. The Fed’s once-pristine balance sheet now includes junk bonds.
We are in uncharted territory in terms of what assets the Fed can buy, and there are no limits on how much cash it can create to buy them. Maybe next the central bank will buy up restaurants, casinos, cruise ships, farms and shopping malls. Maybe its next policy move will be to slash interest rates below zero.
No conventional economic models are able to account for the simultaneous collapse in economic demand to depression levels and the explosion in fiscal and monetary stimulus to hyperinflationary levels.
We could see GDP contract by 30% in the second quarter with unemployment spiking to 30% – a Great Depression scenario. But the metals markets could jump based on the artificial stimulus being pumped into the financial system that is debasing the dollar.
An inflationary depression would be a terrible environment for most investments in real terms. But it could potentially be a fantastic environment for gold and silver.
During most crisis investing environments – whether inflationary or deflationary – precious metals tend to outperform stocks.
Anyone who proffers a prediction on where the Dow Jones Industrials will be trading at the end of the year is just guessing. None of the so-called “experts” on Wall Street have a clue. The officials at the Fed who are trying to centrally manage a broken economy don’t know what the ultimate consequences of their interventions will be either.
After the initial outbreak of the Wuhan coronavirus, neither the World Health Organization nor our own Surgeon General had any idea of the global threat it posed.
They initially downplayed it, repeated false Chinese propaganda that it wasn’t transmissible from human to human, and then falsely (and selfishly) told us medical masks were ineffective when worn by the general public.
All of their projection models were wrong. And investors should be skeptical of any particular projection models for the economy or financial markets. They will all be wrong to some extent.
But investors can be confident that a portfolio diversified into gold and silver will mitigate downside risk in stocks and other paper assets – while also providing added upside potential, especially as inflationary pressures build.
The Money Metals News Service provides market news and crisp commentary for investors following the precious metals markets.
There are two main factors of demand for precious metals. First of all, they are the risks of a global economic downturn due to the coronavirus pandemic. For example, the international bank JPMorgan Chase estimated the loss of the global economy at $ 5.5 trillion within the next 2 years. The Institute of International Finance expects the world trade reduces by 30% this year. Earlier negative forecasts were issued by OECD, S&P Global Ratings and many others. The second important factor making gold attractive may be the risks of the world major currencies weakening due to an increase in their emissions. The Fed, the ECB, the Bank of England, the Bank of Japan and most other central banks announced stimulus programs for their economies affected by Covid-19. In the US, economic assistance will exceed $ 2 trillion, in the EU – 540 billion euros, etc. Against this background, gold may be in high demand as a protective asset. In turn, the depreciation of the yuan may be caused by lower rates of the Chinese Central Bank and the decrease in the world trade. Next week, important macroeconomic data able to affect the dynamics of XAUCNH will come out in China. Trade balance for March will be published on April 14. And the Chinese GDP for the 1st quarter will come out on April 17.
By CentralBankNews.info Mongolia’s central bank lowered its policy rate for the second time in as many months and extended the maturity of existing consumer loans by up to 12 months for borrowers experiencing difficulties to lessen the consequences of financial difficulties from the coronavirus and support economic activity. The Central Bank of Mongolia (Mongolbank) cut its policy rate by 100 basis points to 9.0 percent at an unscheduled meeting of its monetary policy committee and has now cut it up 200 points this year following a similar cut on March 11.
The bank’s policy committee had been scheduled to meet on June 19.
“The continued spread of COVID-19 has changed the external and domestic economic conditions in a short span of time, aggravating uncertainties, contracting business activities in the economy, weakening domestic demand, and resulting in difficulties in loan repayment,” Mongolbank said.
Mongolia’s inflation rate rose to 6.4 percent in February from 5.6 percent in January but the central bank said demand-induced inflation is expected to be subdued on economic slack this year while lower oil prices is expected to affect supply-driven inflation. Mongolia’s tughrik has been depreciating steadily since 2011 with the rate of its decline steady since October last year. In response to the rate cut, the tughrik firmed to trade around 2,783 to the U.S. dollar, but still down 1.6 percent since the start of this year.
The Central Bank of Mongolia issued the following statement:
“The Monetary Policy Committee held an unscheduled meeting on the 13th of April 2020. The Committee decided to lower the policy rate by 1 percentage point to 9 percent and to extend the maturity limit on consumer loans up to 12 months for lenders experiencing difficulty in their loan repayments.
Annual headline inflation reached 6.4 percent nationwide and 6.9 percent in Ulaanbaatar city as of February 2020. The demand induced inflation is expected to be subdued as the economic growth slacks this year. The supply-driven volatility in inflation is anticipated to decline if the supply of some imported foods remains stable, along with a falling domestic price of fuel following the drop in global oil price.
The continued spread of COVID-19 has changed the external and domestic economic conditions in a short span of time, aggravating uncertainties, contracting business activities in the economy, weakening domestic demand, and resulting in difficulties in loan repayments. Therefore, necessary monetary and macroprudential policy measures are being implemented to lessen the consequences of difficulties triggered by the disease and to support economic activities.
Considering the current macroeconomic and financial outlook, its prospects, and uncertainties in the domestic and external environment, the Monetary Policy Committee decided on the comprehensive policy measure of lowering the policy rate to stimulate economic growth and extending the maturity on consumer loans once up to 12 months for lenders experiencing difficulties, hence reducing the monthly loan repayments.
The monetary policy decision is aimed at ensuring economic and financial stability while keeping the inflation rate around the target rate.
Extracts of the meeting minutes will be released in two weeks on the Bank of Mongolia’s official website.”
– As we’ve attempted to illustrate the intuitive nature of the Adaptive Fibonacci Price Modeling system we as one of the tools to help us understand the markets and price setups, we now want to more clearly illustrate other components of the current global economic environment. We want to illustrate just how deep the current price move resonates against historical price norms.
In Part I of this article, we highlighted the Fibonacci system running on the ES (S&P 500) charts. The point of this example was to show that a new price low had already been established and a recent new price high (the all-time high peak) was now acting as a critical price peak. This suggests we are in the process of establishing a much deeper price low (bottom) that may come over the next few weeks as price attempts to “revalue” current economic expectations.
In Part II of this article, we highlighted the Fibonacci Price Theory concepts and attempted to teach you how to identify major and minor Fibonacci price pivot points. This was done to help you understand what we are attempting to share with you and to help you learn to use these techniques in the future. The conclusion of that, Part II, shared our expectations that a new, deeper low, would likely set up in the ES and NQ markets as price attempts to establish a future bottom setup.
In Part III of this article, we shared with you the NQ (Nasdaq) Fibonacci price analysis which was similar to the ES charts. We are attempting to share with you the reality that price will setup intermediate high and low price pivots over time. But we are really trying to explain how the major price pivots have now set up as a massive warning that a deeper low may be targeted as long as price fails to recover to levels near the all-time highs. As “obvious” as that may seem to you now, many traders are already entering the markets expecting a recovery similar to May 2018 or January 2019 to begin. We urge you to reconsider the scope of this disruption of the global economy.
Before we continue, be sure to opt-in to our free market trend signals before closing this page, so you don’t miss our next special report!
Weekly chart of our Custom Smart Cash Index
The first chart we want to share with you is a Weekly chart of our Custom Smart Cash Index. This chart clearly illustrates just how destructive the recent collapse in the global economy has been. Previous downside price rotations (Feb 2018 & October~December 2018) prompted downside price moves that stayed within the upward sloping price channel established from the 2015~2016 price range setup.
We believe this new downside price cycle will establish a new support channel for future price growth that may include a transition away from traditional economic measures. Essentially, a “new normal” related to debt and economic expectations.
We believe this COVID-19 virus event may be unwinding a large portion of capital appreciation that originated back in 2000~2002 – after the DOT COM and 9/11 Terrorist attacks in NY. Since that time, the US Fed and global central banks have engaged in a series of QE experiments designed to spark economic activity. We believe the core element of the current COVID-19 economic contagion is not related to the central bank’s inability to print more money to throw at the problems in the markets. The problem exists that a healthy market must remove risky debt/credit issues and unhealthy deficits in order to sustain real forward growth opportunities. See this ZeroHedge article for a clear example of what we are attempting to explain: www.zerohedge.com
Looking at some of the charts from the ZeroHedge article, it becomes clear that real economic growth (in relation to proper debt expansion and economic function) likely completed a transitional cycle end near 1999~2002. This came after the US Fed reached peak interest rate levels in the early 1980s and began a deficit spending binge that continues till today. As credit/debt became the new norm, we can see how the expansion of credit created a broader expansion of capital valuation levels (global stock market prices) and provided for an expansion of derivatives and global shadow banking operations. Debt begot more debt/credit – which begot more debt/credit. And the cycle continues until it breaks.
We believe the unwinding process of the global credit market is really just beginning. The COVID-19 virus event was just the catalyst for this event. The virus event prompted a collapse in the global economy because of the global economic shutdown that took place to prevent the spread of the virus. This shutdown strained the global economic/credit market and continues to do so today, by exposing many at-risk companies and business enterprises that were operating on the “fringe” – that space where lack of consumer engagement creates a void in income while debt levels continue to plague future operations. We believe this process of UN-leveraging debt will continue until the markets decide a suitable amount of risk has been removed from the markets. This is when global economic expansion and growth will begin to take hold.
Weekly Custom Volatility Index – Deleveraging Is The New Normal
This Weekly Custom Volatility Index highlights the potential for a “new normal” range as the recent deep low levels on this chart suggests a “deleveraging” process is currently taking place. Even as the US Fed and global central banks pour trillions into the markets, this Custom Volatility Index continues to suggest deleveraging is still ongoing throughout the global markets. Our research team believes the US Fed and global central banks are simply sucking up the immediate risk “froth” in the global markets while the “real meat” of the issue still persists.
Precious Metals Analysis Points To Higher Prices Long Term
This analysis leads us to Precious Metals – yes, we know, everyone is talking about Gold and Silver right now. Yet, the real reason we are talking about Gold and Silver is because we believe the current economic environment will present an incredible (once in a lifetime) opportunity for skilled traders. Once you truly understand the process that is taking place throughout the globe and how debt/credit expansion over the past 45+ years has propelled the capital markets to massive highs while the metals market has been ignored.
Recently, Gold has rallied to a 6+ year high and Silver is still trading near multi-year lows. The reality is that the global stock market is about to experience a credit/debt revaluation event that is unlike anything we’ve seen since 1929 and/or WWII. Precious metals are about to enter a phase that has never been experienced in recent history. What happens to safe-havens throughout the process of a global market credit/debt crisis event? What happens to metals as the global economy attempts to wash-away excessive debt, derivatives and shadow banking risks that have built up over the past 40+ years?
Concluding Thoughts:
If we are correct and our Fibonacci price modeling systems are correct, a deeper price low in the global markets is about to set up that will attempt to force a “wash-out” event in the global credit/debt markets. This process will likely send precious metals skyrocketing higher. The unknowns of this process are the same unknowns that happened after 1929 & WWII – what will the new financial functions and societal structure be composed of? Until that side of the future becomes more clear, expect a number of unknown factors to continue to drive excessive volatility and risk in the global markets.
As a technical analyst and trader since 1997, I have been through a few bull/bear market cycles in stocks and commodities. I believe I have a good pulse on the market and timing key turning points for investing and short-term swing traders. 2020 is going to be an incredible year for skilled traders. Don’t miss all the incredible moves and trade setups.
I hope you found this informative, and if you would like to get a pre-market video every day before the opening bell, along with my trade alerts. These simple to follow ETF swing trades have our trading accounts sitting at new high water marks yet again this week, not many traders can say that this year. Visit my Active ETF Trading Newsletter.
We all have trading accounts, and while our trading accounts are important, what is even more important are our long-term investment and retirement accounts. Why? Because they are, in most cases, our largest store of wealth other than our homes, and if they are not protected during a time like this, you could lose 25-50% or more of your entire net worth. The good news is we can preserve and even grow our long term capital when things get ugly like they are now and ill show you how and one of the best trades is one your financial advisor will never let you do because they do not make money from the trade/position.
If you have any type of retirement account and are looking for signals when to own equities, bonds, or cash, be sure to become a member of my Long-Term Investing Signals which we issued a new signal for subscribers.
Ride my coattails as I navigate these financial markets and build wealth while others lose nearly everything they own during the next financial crisis.
Lower Japan’s eco watchers index bullish for USDJPY
Japan’s economy watchers sentiment fell in March: the eco watchers index fell to 14.2 from 27.4 in February, when a decline to 22.2 was expected. While this is bullish for USDJPY, technical setup remains bearish.