Ichimoku Cloud Analysis 13.04.2020 (BTCUSD, USDRUB, XAUUSD)

Article By RoboForex.com

BTCUSD, “Bitcoin vs US Dollar”

BTCUSD is trading at 6673.00; the instrument is moving below Ichimoku Cloud, thus indicating a bearish tendency. The markets could indicate that the price may test the cloud’s downside border at 6725.00 and then resume moving downwards to reach 5625.00. Another signal to confirm further descending movement is the price’s rebounding from the neckline of a Head & Shoulder pattern. However, the scenario that implies further decline may be canceled if the price breaks the cloud’s upside border and fixes above 7105.00. In this case, the pair may continue growing towards 7605.00 without completing the reversal pattern. After breaking the rising channel’s downside border and fixing below 6255.00, the price may resume moving downwards.

BTCUSD
Risk Warning: the result of previous trading operations do not guarantee the same results in the future

USDRUB, “US Dollar vs Russian Ruble”

USDRUB is trading at 73.79; the instrument is moving below Ichimoku Cloud, thus indicating a descending tendency. The markets could indicate that the price may test the cloud’s downside border at 74.35 and then resume moving downwards to reach 68.75. Another signal to confirm further descending movement is the price’s rebounding from the descending channel’s upside border. However, the scenario that implies further decline may be canceled if the price breaks the cloud’s upside border and fixes above 77.55. In this case, the pair may continue growing towards 78.25.

USDRUB
Risk Warning: the result of previous trading operations do not guarantee the same results in the future

XAUUSD, “Gold vs US Dollar”

XAUUSD is trading at 1683.00; the instrument is moving above Ichimoku Cloud, thus indicating an ascending tendency. The markets could indicate that the price may test the cloud’s upside border at 1670.00 and then resume moving upwards to reach 1735.00. Another signal to confirm further ascending movement is the price’s rebounding from the rising channel’s downside border. However, the scenario that implies further growth may be canceled if the price breaks the cloud’s downside border and fixes below 1645.00. In this case, the pair may continue falling towards 1595.00.

GOLD

Article By RoboForex.com

Attention!
Forecasts presented in this section only reflect the author’s private opinion and should not be considered as guidance for trading. RoboForex LP bears no responsibility for trading results based on trading recommendations described in these analytical reviews.

Can EURUSD Establish Support At 1.0950?

By Orbex

The euro currency broke out past the resistance level of 1.0950 into Friday’s close.

Price action advanced slightly higher to highs of 1.0951 before retreating.

The current retracement will see EURUSD falling back to the 1.0950 level. If support forms here, then we expect the bullish momentum to resume.

The upside target of 1.1055 – 1.1030 will be the next main target levels, followed by a likely move higher toward the 1.1200 handle.

By Orbex


Fibonacci Retracements Analysis 13.04.2020 (GOLD, USDCHF)

Article By RoboForex.com

XAUUSD, “Gold vs US Dollar”

As we can see in the H4 chart, XAUUSD is forming a mid-term ascending wave towards the local high at 1703.17. If the pair breaks this level, it may reach 76.0% fibo at 1708.85. At the same time, the key upside targets are inside the post-correctional extension area between 138.2% and 161.8% fibo at 1798.90 and 1858.60 respectively. After testing this area, the price may correct downwards and then attack the all-time high at 1920.66. The support remains at 1451.18.

GOLD_H4
Risk Warning: the result of previous trading operations do not guarantee the same results in the future

In the H1 chart, there is a divergence within the uptrend, which may indicate a new pullback soon. The short-term support is 76.0% fibo at 1642.68.

GOLD_H1
Risk Warning: the result of previous trading operations do not guarantee the same results in the future

USDCHF, “US Dollar vs Swiss Franc”

As we can see in the H4 chart, the previous ascending wave has failed to break the local high at 0.9901 and reach 76.0% fibo at 0.9982. At the moment, USDCHF is falling and may form a Triangle pattern. However, the key target of the current movement is 61.8% fibo at 0.9453.

USDCHF_H4
Risk Warning: the result of previous trading operations do not guarantee the same results in the future

In the H1 chart, the divergence made the pair start a new decline, which is currently slowing down at 50.0% fibo due to a convergence om MACD indicating a possible reversal. However, as long as there is no “Golden Cross” on MACD, the instrument may yet continue trading downwards to reach 61.8% fibo at 0.9615. The resistance is at 0.9797.

USDCHF_H1

Article By RoboForex.com

Attention!
Forecasts presented in this section only reflect the author’s private opinion and should not be considered as guidance for trading. RoboForex LP bears no responsibility for trading results based on trading recommendations described in these analytical reviews.

Markets take a downturn after historic oil production cuts

By Hussein Sayed, Chief Market Strategist (Gulf & MENA), ForexTime

A price war between Saudi Arabia and Russia ended over the weekend as the world came together to slash oil output by more than 10%, which is the largest oil production cut ever agreed to. The only solid details revealed were that OPEC and its allies will slash production by 9.7 million barrels a day starting in May. Meanwhile, the impact of low oil prices will force other G20 nations to contribute an additional cut of almost 5 million barrels.

The deal seems to have put a floor under Oil prices, but judging from today’s reaction, investors aren’t convinced that prices will get a strong boost. At the time of writing, WTI and Brent crude were both trading 4% higher. That’s still 61% lower for WTI and 50% lower for Brent, year-to-date.

The lack of hard commitments from G20 countries shows obvious weakness in the deal. And when taking into consideration the drop in demand, which is expected to top 30 million barrels a day this month, the markets will remain in a supply glut. Going forward, traders need to monitor inventory levels and strategic petroleum reserves (SPR’s). Inventory levels are expected to continue to climb over the coming weeks, albeit at a slower pace. However, will the US and other nations absorb the additional supply through their SPR’s? That could determine whether prices continue to go higher from here or have possibly hit a wall.

Equity markets were not helped much by the Oil deal. Major US stock future indices declined by more than 1.4% early today after the S&P 500 recorded its largest weekly jump since 1974.

While COVID-19 pandemic news remains the most significant factor influencing investors’ decisions, the earning season which kick offs this week will provide more clarity on how much damage the virus has already done to US corporates.

It’s definitely going to be ugly across all sectors, but markets have already priced in a large chunk of this. Now the question becomes are we witnessing a new bull market or is there still more pain ahead before the rally becomes sustainable?

I think the answer lies in how long the global economy will remain shut, meaning will we see a ‘one lockdown and gradual reopen’ phase or will there be a need for an extended period of lockdowns? We may then be able to gauge how consumer behaviour will change after the pandemic.

We still have few answers to these questions at present, but the longer the pandemic stays without a treatment or a vaccine, the more time it will take to see a sustainable rally in equities. Monetary and fiscal policies can only support the markets to a certain extent, but it’s the fundamentals of the economy that will rule in the end.

Disclaimer: The content in this article comprises personal opinions and should not be construed as containing personal and/or other investment advice and/or an offer of and/or solicitation for any transactions in financial instruments and/or a guarantee and/or prediction of future performance. ForexTime (FXTM), its affiliates, agents, directors, officers or employees do not guarantee the accuracy, validity, timeliness or completeness, of any information or data made available and assume no liability as to any loss arising from any investment based on the same.


Forex-Time-LogoArticle by ForexTime

ForexTime Ltd (FXTM) is an award winning international online forex broker regulated by CySEC 185/12 www.forextime.com

The Analytical Overview of the Main Currency Pairs on 2020.04.13

by JustForex

The EUR/USD currency pair

Technical indicators of the currency pair:
  • Prev Open: 1.09280
  • Open: 1.09390
  • % chg. over the last day: +0.05
  • Day’s range: 1.09250 – 1.09677
  • 52 wk range: 1.0777 – 1.1494

EUR/USD quotes show a positive trend. The trading instrument has updated local highs. At the moment, the euro is testing a resistance level of 1.0970. The 1.0920 mark is already a “mirror” support. The technical pattern signals a further growth of the EUR/USD currency pair. The coronavirus pandemic is still in the spotlight. The number of infections in the world exceeded 1.85 million. Positions should be opened from key levels of support and resistance.

The Economic News Feed for 13.04.2020

  • Today, the publication of important economic releases is not planned. Trading activity may be reduced due to holidays in most countries of the world.
EUR/USD

Indicators signal the power of buyers: the price has fixed above 50 MA and 100 MA.

The MACD histogram has started to rise, indicating the bullish sentiment.

Stochastic Oscillator is in the neutral zone, the %K line is above the %D line, which gives a signal to buy EUR/USD.

Trading recommendations
  • Support levels: 1.0920, 1.0885, 1.0835
  • Resistance levels: 1.0970, 1.1030

If the price fixes above the level of 1.0970, further growth of the EUR/USD currency pair is expected. The movement is tending to 1.1000-1.1030.

An alternative could be a drop in the EUR/USD quotes to 1.0890-1.0870.

The GBP/USD currency pair

Technical indicators of the currency pair:
  • Prev Open: 1.24480
  • Open: 1.24583
  • % chg. over the last day: +0.04
  • Day’s range: 1.24514 – 1.25369
  • 52 wk range: 1.1466 – 1.3516

Purchases prevail on the GBP/USD currency pair. The British pound has overcome and fixed above key extremes. At the moment, GBP/USD quotes are testing the 1.2535 mark. The 1.2480 level is already a “mirror” support. A trading instrument has the potential for further growth. We recommend following the latest information regarding the COVID-19 spread. Positions should be opened from key levels.

The news feed on the UK economy is calm.

GBP/USD

Indicators signal the power of buyers: the price has fixed above 50 MA and 100 MA.

The MACD histogram is in the positive zone, indicating the bullish sentiment.

Stochastic Oscillator has reached the overbought zone, the %K line has crossed the %D line. There are no signals at the moment.

Trading recommendations
  • Support levels: 1.2480, 1.2425, 1.2360
  • Resistance levels: 1.2535, 1.2600

If the price fixes above 1.2535, further growth of GBP/USD quotes is expected. The movement is tending to the round level of 1.2600.

An alternative could be a decrease in the GBP/USD currency pair to 1.2440-1.2420.

The USD/CAD currency pair

Technical indicators of the currency pair:
  • Prev Open: 1.39720
  • Open: 1.39236
  • % chg. over the last day: -0.15
  • Day’s range: 1.39236 – 1.40006
  • 52 wk range: 1.2949 – 1.4668

The technical pattern is still ambiguous on the USD/CAD currency pair. The loonie is in a sideways trend. Investors expect additional drivers. At the moment, the key support and resistance levels are 1.3920 and 1.4000, respectively. We recommend paying attention to the dynamics of oil quotes. Positions should be opened from key levels.

The news feed on Canada’s economy is calm.

USD/CAD

Indicators signal the power of sellers: the price has fixed below 50 MA and 100 MA.

The MACD histogram is in the negative zone, indicating the bearish sentiment.

Stochastic Oscillator is in the neutral zone, the %K line is above the %D line, which gives a signal to buy USD/CAD.

Trading recommendations
  • Support levels: 1.3920, 1.3900, 1.3850
  • Resistance levels: 1.4000, 1.4065, 1.4100

If the price fixes below 1.3920, USD/CAD quotes are expected to fall. The movement is tending to 1.3890-1.3870.

An alternative could be the growth of the USD/CAD currency pair to 1.4030-1.4060.

The USD/JPY currency pair

Technical indicators of the currency pair:
  • Prev Open: 108.430
  • Open: 108.388
  • % chg. over the last day: -0.12
  • Day’s range: 107.792 – 108.518
  • 52 wk range: 101.19 – 112.41

The bearish sentiment prevails on the USD/JPY currency pair. The trading instrument has set new local lows. USD/JPY quotes found support at 107.80. The 108.20 mark is already a “mirror” resistance. Demand for “safe haven” currencies is still high. The yen has the potential for further growth against the greenback. Positions should be opened from key levels.

The news feed on Japan’s economy is calm.

USD/JPY

Indicators signal the power of sellers: the price has fixed below 100 MA.

The MACD histogram is in the negative zone, indicating the bearish sentiment.

Stochastic Oscillator is in the oversold zone, the %K line has crossed the %D line. There are no signals at the moment.

Trading recommendations
  • Support levels: 107.80, 107.50, 107.10
  • Resistance levels: 108.20, 108.60, 109.00

If the price fixes below 107.80, a further drop in the USD/JPY quotes is expected. The movement is tending to 107.50-107.30.

An alternative could be the growth of the USD/JPY currency pair to 108.40-108.60.

by JustForex

EUR/USD Will Decide on Direction

By Dmitriy Gurkovskiy, Chief Analyst at RoboForex

On Monday morning, the major currency pair is barely moving: a lot of investors from the Catholic world have been rather inactive since last Friday due to the Easter holidays, that’s why today’s economic calendar is almost empty.

When the market is calm and there is no news, it’s high time to learn different opinions and predictions for the future. For example, the CBA (Commonwealth Bank of Australia) attracted attention by saying that it might make sense to buy the Euro against the USD with the target at 1.16. The argument is that effective economic policies and measures taken by the Eurozone will provide the financial stability of the region.

Indeed, last week, finance ministers on the Eurozone agreed on a new tool to support the region, the ESM, which is an extended credit line for the alliance members. The countries that suffered most from the coronavirus pandemic and its consequences will get access to a huge amount of liquidity. The ESM will be an additional measure to already existing support mechanisms and the combined effect will help the Eurozone to recover rather quickly.

Such a strategy really looks very promising, but it’s better to wait for the first results.

In the H4 chart, after returning to 1.0940, EUR/USD is consolidating at the top of this ascending wave. After breaking the rising channel’s downside border, the pair may form a new descending wave with the first target at 1.0888. Later, the market may start another growth to reach 1.0920 and then resume trading inside the downtrend. From the technical point of view, this scenario is confirmed by MACD Oscillator: its signal line is moving outside the histogram area but still above 0. If the line breaks 0 to the downside, the pair may boost its decline on the price chart.

As we can see in the H1 chart, the pair has completed the rising wave towards 1.0966, thus finishing the current uptrend. According to the main scenario, EUR/USD is expected to fall to reach 1.0920. Later, the market may form one more ascending structure towards 1.0940 and then return to 1.0920. After breaking this level downwards, the instrument may continue falling with the target at 1.0888. From the technical point of view, this scenario is confirmed by Stochastic Oscillator: its signal line has rebounded from 50 to the downside, thus indicating another decline towards 20.

Disclaimer

Any predictions contained herein are based on the authors’ particular opinion. This analysis shall not be treated as trading advice. RoboForex shall not be held liable for the results of the trades arising from relying upon trading recommendations and reviews contained herein.


Coronavirus Pandemic Continues to Impact Markets Negatively

by JustForex

The US dollar continued to decline against a basket of major currencies. On Friday, the dollar index (#DX) closed in the red zone (-0.66%). Last week, a report on the jobless claims was published. According to the report, the number of claims increased even more and counted to 6.606K, while experts expected 5.250K. The American currency is under pressure due to the further spread of the coronavirus. Over the weekend, US President D. Trump has declared a major disaster in 50 states. This happened for the first time in history. In the United States, 557,590 COVID-19 cases were recorded.

At the same time, the Japanese currency is strengthening for the fourth day in a row amid continued demand for the “safe haven” assets in the context of the coronavirus pandemic. The yen is also supported by the decision of the Japanese government to provide about $1 trillion to support the economy, including direct payments to citizens.

The “black gold” prices have declined as investors still concerned about the sharp drop in global oil demand. On Sunday, the OPEC+ group agreed to reduce oil production by about 10 percent of global supplies in order to maintain oil prices amid the spread of coronavirus. However, despite this, investors are still worried about raw material consumption forecasts. Currently, futures for the WTI crude oil are testing the $23.20 mark per barrel.

Market indicators

On Friday, there was the bullish sentiment in the US stock market: #SPY (+1.52%), #DIA (+1.20%), #QQQ (+0.14%).

The 10-year US government bonds yield has not changed. At the moment, the indicator is at the level of 0.72-0.73%.

The news feed on 2020.04.13:
  • Today, the publication of important news is not expected. Most financial markets are closed due to the Easter holidays.

by JustForex

The USD/JPY enters a bearish short-term season – is 105.00 a target?

By Admiral Markets

Economic Events

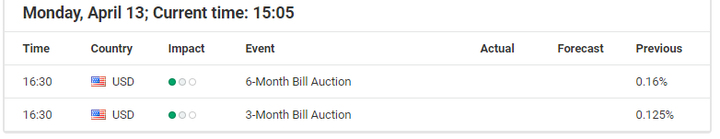
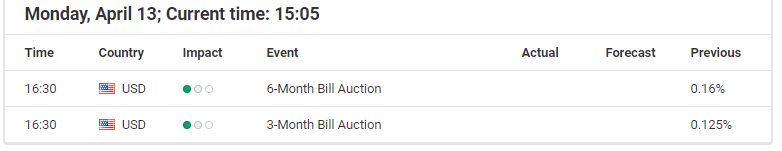
Source: Economic Events April 13, 2020 – Admiral Markets’ Forex Calendar

After high volatility in Treasury and FX markets over the last weeks, the Easter weekend gives traders some air to breathe.

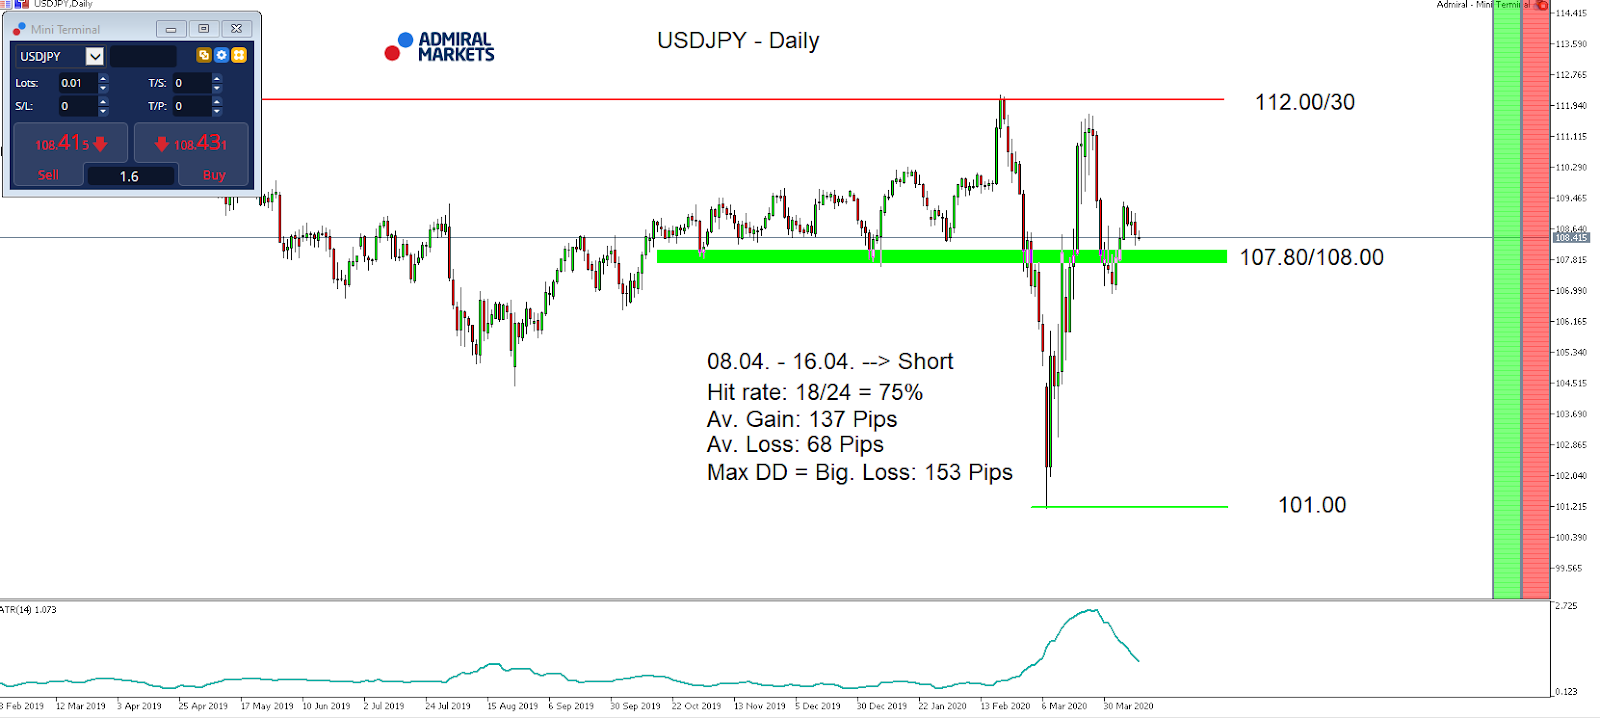
Still, the picture in the USD/JPY looks fairly interesting: technically, the currency pair made back some of its recent losses after its drop back below 108.50/109.00, with the overall mode staying choppy, but in our opinion an overall bearish touch.

Reason for our “bearishness” is the to be expected pressure on 10-year-US Treasury yields, where technically only recapturing 1.20% would brighten the bearish outlook.

Besides that, the currency pair currently also finds itself in a bearish seasonal window: over the last 24 years, USD/JPY dropped between April 8 – 16, by an average of 137 pips while it rose in the remaining six years on average 68 pips with a max drawdown of 153 pips.

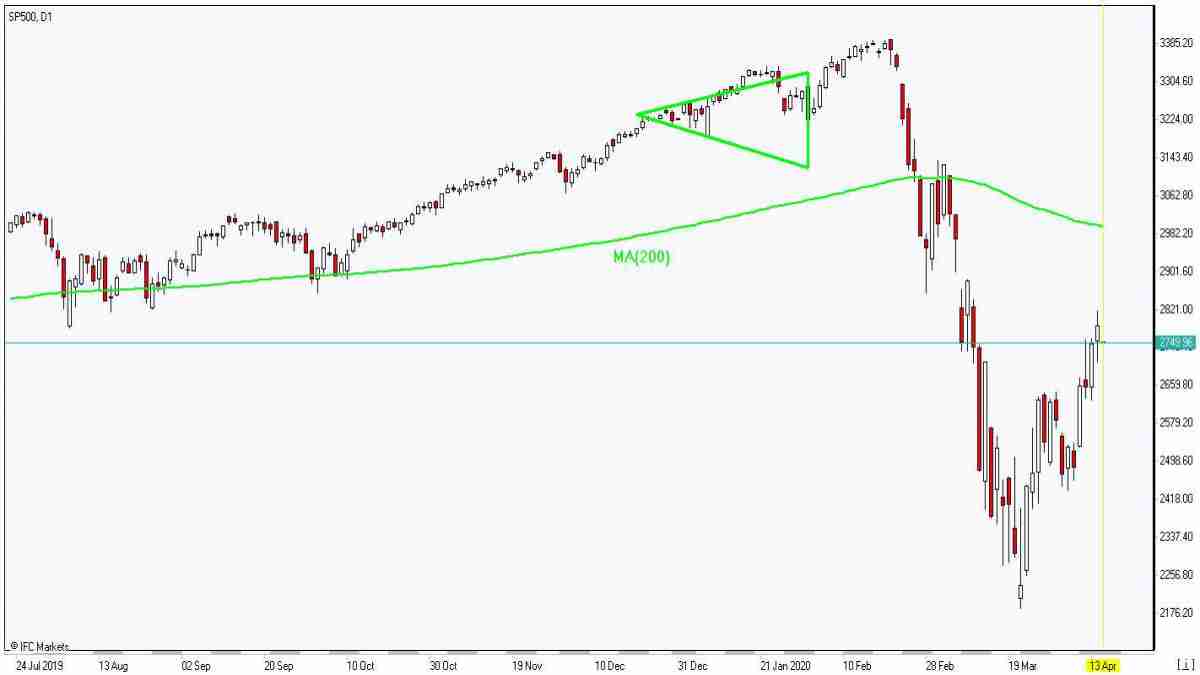
And while we still consider a new wave of risk-off hitting global financial markets to be a serious option and thus under “normal” market conditions a driver lower for the USD/JPY, currently such a risk-off-wave would likely going hand in hand with an increasing demand for the USD, given the global USD shortage.

Should such a USD squeeze materialize in the days/weeks ahead, a test, probably even break of the region around 112.00/30 would be an option.

Still, a sustainable drop below 107.00 would potentially level the path down to 105.00:

 Daily chart

Source: Admiral Markets MT5 with MT5-SE Add-on USD/JPY Daily chart (between February 18, 2019, to April 10, 2020). Accessed: April 10, 2020, at 10:00pm GMT – Please note: Past performance is not a reliable indicator of future results, or future performance.

In 2015, the value of the USD/JPY increased by 0.5%, in 2016 it fell by 2.8%, in 2017 it fell by 3.6%, in 2018 it fell by 2.7%, in 2019 it fell by 0.85%, meaning that after five years, it was down by 9.2%.

Discover the world’s #1 multi-asset platform

Admiral Markets offers professional traders the ability to trade with a custom, upgraded version of MetaTrader 5, allowing you to experience trading at a significantly higher, more rewarding level. Experience benefits such as the addition of the Market Heat Map, so you can compare various currency pairs to see which ones might be lucrative investments, access real-time trading data, and so much more. Click the banner below to start your FREE download of MT5 Supreme Edition!

Download MetaTrader 5 and begin trading today!

Disclaimer: The given data provides additional information regarding all analysis, estimates, prognosis, forecasts or other similar assessments or information (hereinafter “Analysis”) published on the website of Admiral Markets. Before making any investment decisions please pay close attention to the following:

  1. This is a marketing communication. The analysis is published for informative purposes only and are in no way to be construed as investment advice or recommendation. It has not been prepared in accordance with legal requirements designed to promote the independence of investment research, and that it is not subject to any prohibition on dealing ahead of the dissemination of investment research.
  2. Any investment decision is made by each client alone whereas Admiral Markets shall not be responsible for any loss or damage arising from any such decision, whether or not based on the Analysis.
  3. Each of the Analysis is prepared by an independent analyst (Jens Klatt, Professional Trader and Analyst, hereinafter “Author”) based on the Author’s personal estimations.
  4. To ensure that the interests of the clients would be protected and objectivity of the Analysis would not be damaged Admiral Markets has established relevant internal procedures for prevention and management of conflicts of interest.
  5. Whilst every reasonable effort is taken to ensure that all sources of the Analysis are reliable and that all information is presented, as much as possible, in an understandable, timely, precise and complete manner, Admiral Markets does not guarantee the accuracy or completeness of any information contained within the Analysis. The presented figures refer that refer to any past performance is not a reliable indicator of future results.
  6. The contents of the Analysis should not be construed as an express or implied promise, guarantee or implication by Admiral Markets that the client shall profit from the strategies therein or that losses in connection therewith may or shall be limited.
  7. Any kind of previous or modeled performance of financial instruments indicated within the Publication should not be construed as an express or implied promise, guarantee or implication by Admiral Markets for any future performance. The value of the financial instrument may both increase and decrease and the preservation of the asset value is not guaranteed.
  8. The projections included in the Analysis may be subject to additional fees, taxes or other charges, depending on the subject of the Publication. The price list applicable to the services provided by Admiral Markets is publicly available from the website of Admiral Markets.
  9. Leveraged products (including contracts for difference) are speculative in nature and may result in losses or profit. Before you start trading, you should make sure that you understand all the risks.

By Admiral Markets

Oil prices see gentle lift from historic OPEC+ deal

By Han Tan, Market Analyst, ForexTime

In the hours before markets began trading for the week, the OPEC+ alliance struck an unprecedented agreement to remove 9.7 million barrels a day from global output, starting May 1. In response to what is now the single largest production cut in history, Crude Oil is seeing a five percent lift towards the psychological $30/bbl level, while Brent is climbing by more than four percent towards the $35/bbl handle.


Despite Mexico initially threatening to scupper the tentative agreement, having first rejected its share of the prescribed output cuts quantum, the deal was ultimately pushed over the line after some Easter weekend intervention by US President Donald Trump. It is tremendously ironic that the OPEC+ alliance had to be salvaged by arguably its most famous critic.

Judging by the initial market reaction, investors are looking past the theatrics and have assessed that the supply cuts would not balance out the supply-demand equation. In a bid to stem Covid-19’s spread, the severe pullback in global economic activity has seen global consumption plummet by an estimated 20-30 million barrels per day. The act of removing nearly 10 percent of total global output for two months before gradually easing up on the production cuts through April 2022, falls short of fully restoring markets in the near-term.

At least Oil investors can take heart from the fact that the price war between Saudi Arabia and Russia has officially ended, a bruising battle that had eroded the credibility of the OPEC+ alliance, threatened the fiscal standings of member countries, and contributed to Oil prices registering its lowest levels in 18 years. In other words, this deal has, at best, deterred the worst-case scenario of flooding the world with cheap supplies and is expected to firm up support beneath Oil prices. With the removal of this supply-side uncertainty, the ailing global consumption outlook is now expected to dominate the narrative over Oil’s near-term performance.

Disclaimer: The content in this article comprises personal opinions and should not be construed as containing personal and/or other investment advice and/or an offer of and/or solicitation for any transactions in financial instruments and/or a guarantee and/or prediction of future performance. ForexTime (FXTM), its affiliates, agents, directors, officers or employees do not guarantee the accuracy, validity, timeliness or completeness, of any information or data made available and assume no liability as to any loss arising from any investment based on the same.


Forex-Time-LogoArticle by ForexTime

ForexTime Ltd (FXTM) is an award winning international online forex broker regulated by CySEC 185/12 www.forextime.com

Futures decline as New York death toll stays above 700

By IFCMarkets

US stocks booked best week since 1974

US stock market will reopen today after Good Friday holiday. Futures point to lower openings as the daily death toll for the New York state, the state with highest number of cases in US, topped 700 on Sunday for the sixth straight day. Market ended the holiday shortened week on positive note Thursday. The S&P 500 ended up 12.1% for the week at 2789.82, its best weekly gain since 1974. Dow Jones industrial rallied 12.67% to 23719.37. The Nasdaq ended 10.59% higher at 8153.58. The dollar weakening slowed while data showed consumer price index declined a more than expected 0.4% over month in March. The live dollar index data show the ICE US Dollar index, a measure of the dollar’s strength against a basket of six rival currencies, slipped 0.1% to 99.44 and is lower currently.

SP500 slips below MA(200) 4/13/2020 Market Overview IFC Markets chart

European markets will remain closed for Easter Monday

Markets in Britain, Germany, Switzerland and France will remain closed for Easter Monday today. Both the EUR/USD and GBP/USD continued climbing on Friday with both pairs higher currently. The Stoxx Europe 600 Index closed 7% higher last week. Last Thursday the Bank of England agreed to temporarily finance UK government deficit if funds cannot immediately be borrowed from debt markets. Pope Francis on Sunday proposed considering a universal basic income in a letter – “ a universal basic wage,” a proposal similar to providing free cash for everyone that was the basis of a US presidential candidate Yang Andrew Yang’s campaign.

Nikkei leads Asian indexes pullback

Asian stock indices are lower today. Nikkei lost 2.3% to 19043.40 as yen accelerated its climbing against the dollar. Stock markets in China are falling: the Shanghai Composite Index is down 0.5%. Markets in Hong Kong, Australia and New Zealand are closed for the Easter Monday holiday.

Brent retreats

Brent futures prices are pulling back today after major oil producers reached an agreement on crude oil output cuts. OPEC and major producers, collectively known as OPEC+, agreed to cut overall production by 10 million barrels a day starting on May 1 through June 30 of this year. The reductions would then ease to 8 million barrels per day from July 1 through December 31, followed by 6 million barrels in cuts from January 1, 2021 to April 30, 2022. The baseline for the cuts will be oil production in October 2018, except for Saudi Arabia and Russia, which will each cut from a baseline of 11 million barrels per day. Brent for June settlement fell 4.1% to $31.48 a barrel Thursday, losing 7.7% for the week.

Gold slips

Gold prices are inching lower today. Prices jumped on Thursday: gold for June delivery rose 4.1% to $1752.80 an ounce.

Market Analysis provided by IFCMarkets

Note:
This overview has an informative and tutorial character and is published for free. All the data, included in the overview, are received from public sources, recognized as more or less reliable. Moreover, there is no guarantee that the indicated information is full and precise. Overviews are not updated. The whole information in each overview, including opinion, indicators, charts and anything else, is provided only for familiarization purposes and is not financial advice or а recommendation. The whole text and its any part, as well as the charts cannot be considered as an offer to make a deal with any asset. IFC Markets and its employees under any circumstances are not liable for any action taken by someone else during or after reading the overview.