Underowned and Underloved

Sector expert Michael Ballanger offers his take on how investment tactics have changed over time, as well as on recent market moves.

By The Gold Report – Source: Michael Ballanger for Streetwise Reports   04/13/2020

Back in the Dark Ages, before cellular phones and the Internet, I was studying to complete the Ontario Securities course one afternoon when I came across the part discussing “asset allocation” and “portfolio construction.” This section covered the recommended mix of bonds and stocks, and everything revolved around the word “risk.” When the customer was in early adulthood, they advised being overweight stocks and underweight bonds, and as the customer matured toward middle age and retirement, the weightings slowly reversed, resulting in an entirely fixed income portfolio generating returns of around 10%.

In other words, a $1,000,000 pool of retirement capital threw off $100,000 of annual income upon which to comfortably retire. With that kind of return, there was little need for the risk associated with stocks, and proof of that was the firm for which I toiled, McLeod Young Weir Ltd., known primarily as a “bond house” with the vast majority of their operations and research geared to fixed income.

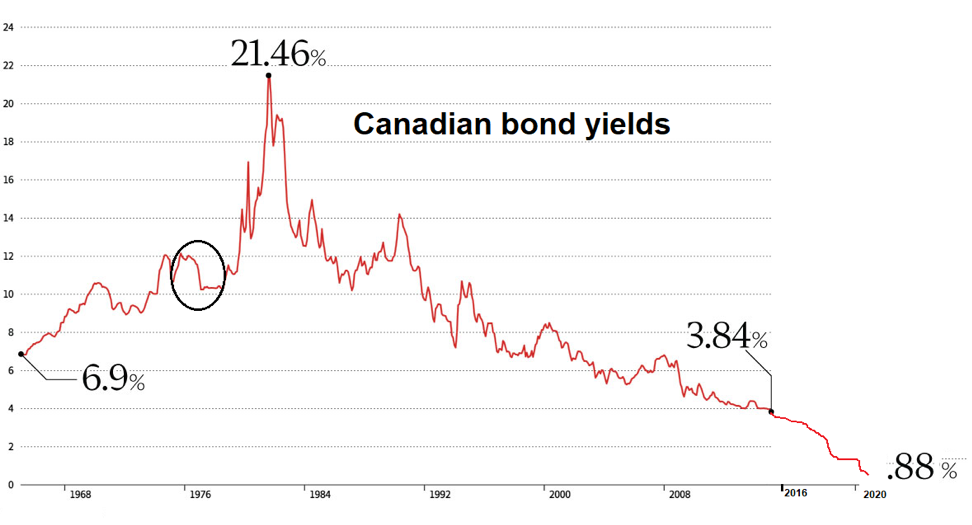
However, over the years, as central bankers gained more and more sway over policy and as bond yields began to sink, the importance of the risk-free return as a benchmark for performance was replaced by more aggressive styles of portfolio construction. Though “financial engineering,” new products driven by derivatives and leverage were designed to augment these diminishing yields, and instead of investing their $1,000,000 of retirement capital with the “lender of last resort,” the Bank of Canada, retirees today are forced to follow the advice of the financial wizards of Wall and Bay Streets. They invest in alternative products or outright stocks and, in doing so, move from “risk-free” to “risk-fraught” and very uncertain returns. As you can see from the chart shown above, $1,000,000 invested today generates a 0.88% return, or a paltry $8,800 of annual income, which is pathetic.

More importantly, after the shellacking taken by stocks in the last quarter, coupled with the 2008 financial crisis, the new mantra for retirees is no longer return on capital, but rather the certainty of a return of capital as the paramount consideration.

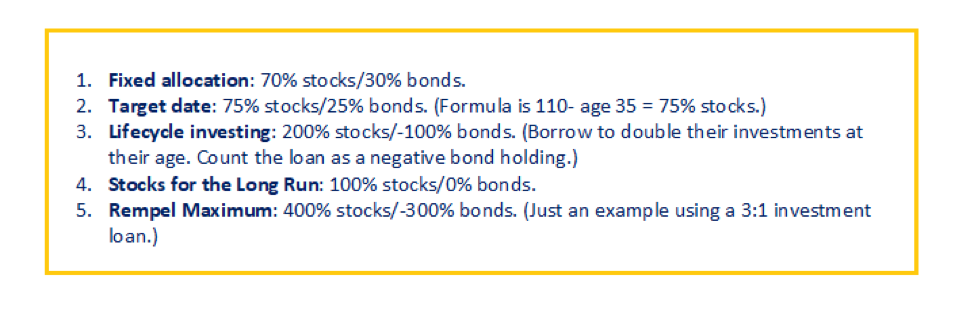
I did an ad hoc Google search of “asset allocations,” and arrived at the following example of a few different types of allocations. You can see that all of these include stocks, with the most outrageous being the Rempel Maximum, which has a person leveraged to the gills to own stocks. Imagine the poor retiree that must generate income by moving to stocks, who is today down 17.1% year to date (TSX Composite), which amounts to a loss of $171,000 on his million-dollar nest egg. Now that’s “real money.”

Where I am going with this train of thought is simple. Nowhere in any of these “models” is there an option for precious metals. It is either Door #1 to Hades, or Door #2 to Purgatory. I can go “overweight” risky assets and “underweight” riskier assets, or vice-versa, but at the end of the day, I have a retirement fund made up of risky paper.

Thanks to the wizardry of central banking and financial engineering, prices for things that used to be the domain of the natural flows of capital, driven purely by the forces of demand and supply, have become pre-set, orchestrated prices that are either suppressed (as in gold and interest rates) or inflated (as in stocks and real estate and anything else vaguely resembling banker collateral). This unnatural interference in the flows of capital is diabolically dangerous, and it the reason why we are seeing these grotesque moves by the ever-merging life forms called the U.S. Treasury and the Federal Reserve. What I saw last week was beyond surreal, and it is not going to end well.

There was a revealing interview on CNBC last week in which the guest, a money manager named Chamath Palihapitiya, tells the anchor (Scott Wapner) that there should be no bailout of the airline industry. The anchor asks, with a pained expression verging on abject horror, “But you would let all these people lose their jobs?” The gentleman then proceeds to lay to waste any and all shreds of credibility in the CNBC clown by explaining to him what happens when a company goes bankrupt, and how the employees actually benefit in some cases, and how the only losers are the speculators and the unsecured debt holders that gambled in the first place! It was priceless, and it was exactly what I wrote about in 2009 when all the billions of bailout dollars rescued the speculators and riverboat gamblers in the U.S. banking business and threw homeowners under the bus.

The numerous tweets I sent off late last week were an effort to wake more than a few people up to what is turning out to be the Second Major Financial Heist of the New Millennium. The banco-politico alliance is once again remembering to “never let a good crisis go to waste,” and are lining up at the trough again to gorge themselves on taxpayer slop. It drives me to absolutely madness.

Moving on to the markets once again, it is imperative to understand one thing before I proceed. The stock market is, for the current U.S. president, not only “of interest;” it is an obsession. Because of this, and because of the current panic gripping the Fed and the Treasury, aided and abetted by the mainstream media, I have zero confidence in the effectiveness of either technical or fundamental analysis of the financial markets here in April 2020. The lines dividing the executive and legislative branches of governments around the world have become blurred, and the fallacy of Fed “independence” has been shown for what it is – fallacy.

The specter of a prolonged bear market brought on by the government lockdown is the logical projection based upon the initial economic feedback and history, but as these are not normal times. As this is an American election year, with a global pandemic surrounding them, these are, in fact, extremely abnormal times. The $6 trillion Fed balance sheet and the Congressional act granting $2.3 trillion in stimulus funding is testimony to the urgency of rescuing the stock market (and voters), so betting heavily on a resumption of the downturn in stocks is unwise at the best, and a fool’s folly at worst.

Similarly, expecting that gold and silver are going to be allowed to move to unfathomable heights unimpeded by the invisible hand of the banco-politico alliance is equally naïve. While conditions supporting such a move are ideal, covert operations designed to nullify such a move have been used in the past.

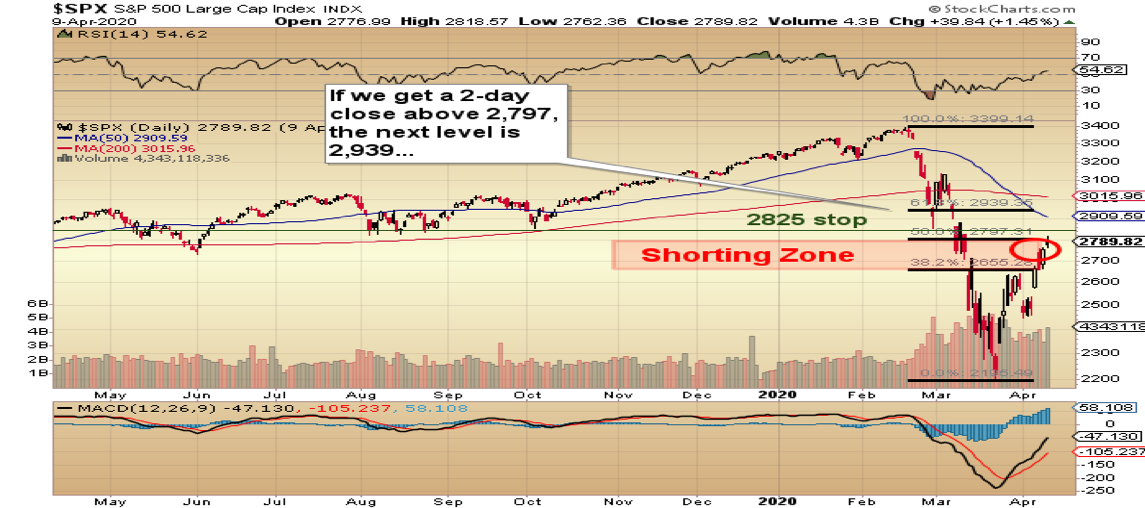
That said, the Dow Jones had the best week since 1938 last week, and CNBC must have flashed it fifty times Thursday afternoon before I turned off the set. Of course, that 1938 rally was a classic bear market rally, with the ultimate lows coming in 1942. The Fibonacci study I did back in late March suggested that the 2,655–2,797 range was the most logical distribution zone for the rebound to end, but it doesn’t rule out an extension move toward 2,940.

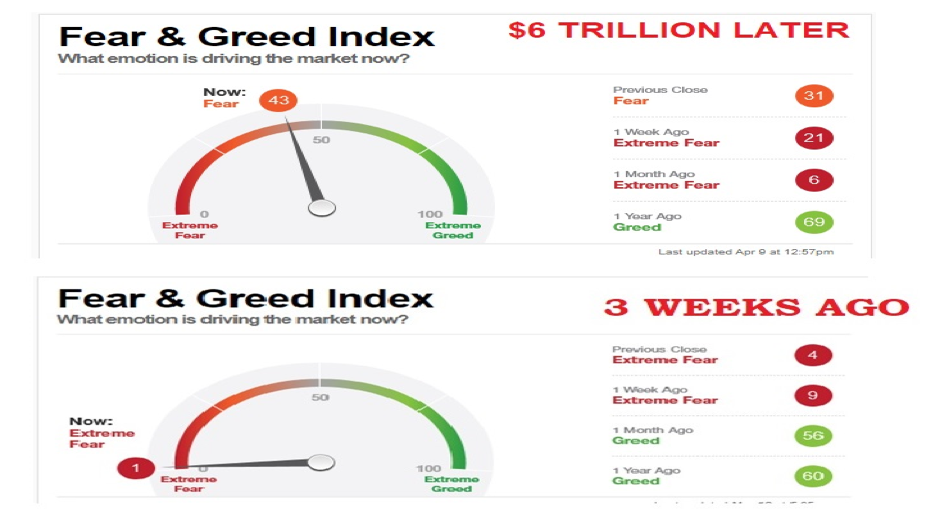
The rebound itself comes as no surprise to my subscribers; the CNN Fear-Greed Index hit an unheard-of reading of “1” around mid-March and has now risen from “Extreme Fear” to just “Fear” and a “43.” Give me a few more Trump tweets and Mnuchin messages; throw in a pinch of Powell pressers, and we will be north of 50 and back in the “Greed” mode, with all systems “go” and stocks a-chargin’.

I am very modestly short the SPY, from $272 and a 50% position in May put options, but it is an outright “punt” on a retest and taken from the “Crash 101” textbook. I “should” get a retest, but with the New York Fed putting in triple overtime, it might get “bypassed” as it did in 2019.

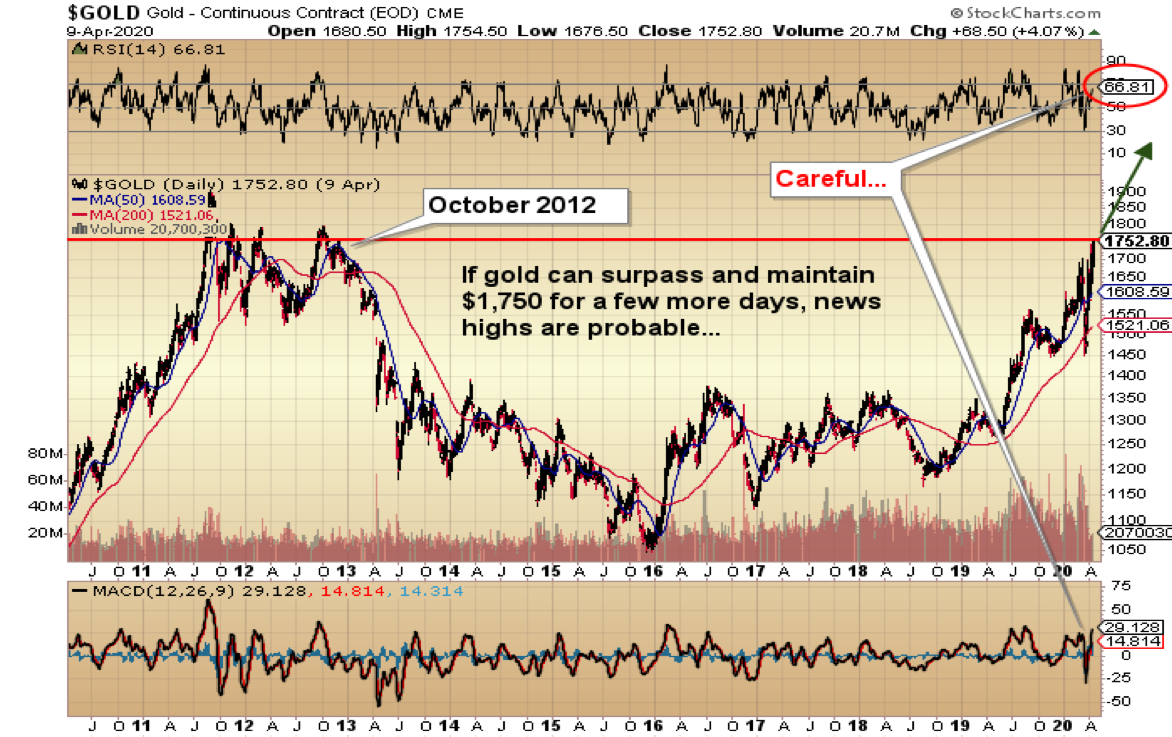
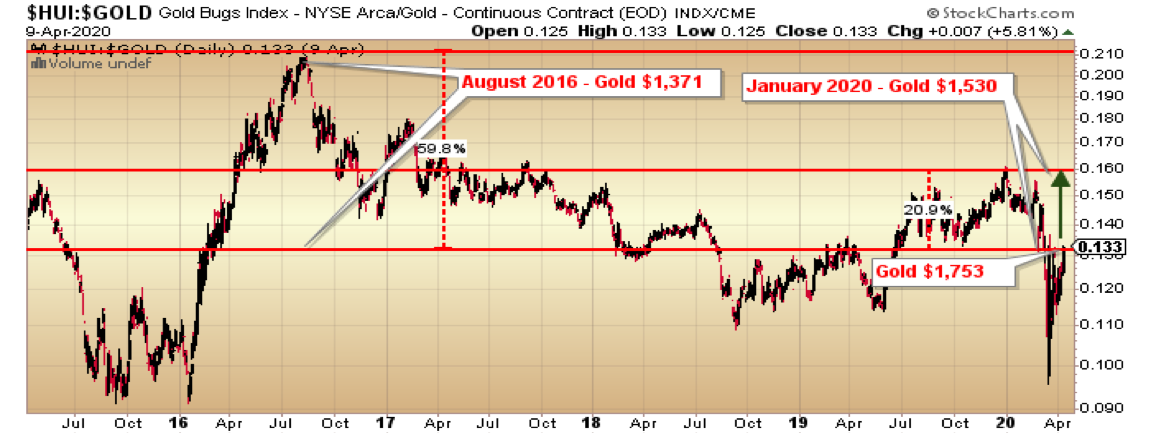
The big news on the week was the new eight-year high registered in gold, and despite the $10 pullback after the close of the pit session, the technical picture looks impressive, verging upon exciting. The HUI had an equally impressive move to 232, going out near the highs of the day and week. However, interestingly, the HUI:Gold ratio remains 20.9%, below the level it hit in late December when gold was priced $120 lower at $1,530/ounce and 59.8% lower than in August 2016, with gold at $1,371/ounce. If gold miners were valued relative to gold prices at the 2016 levels, the HUI would be 371, which is 55% higher then we are today.

That is the reason that I added to positions taken three weeks ago after I posted the two “Generational Buying Opportunity” charts of the Senior Gold (GDX:US) and Junior Gold (GDXJ:US) Miner exchange-traded funds (ETFs). If you assign 2016 valuations to GDX and GDXJ, you get $45.12 GDX and $55.25 GDXJ. In fact, although I took a few trading account shekels off the table into the advance, I still hold August calls in GDX from that Monday morning when it gapped down to $16.18, and I still have 133 days until expiry, which is cool.

They say that entry points are the key to successful speculation, whether it is real estate or stocks, so whenever you get panic as thick as it was in mid-March, you have to ignore CNBC and BNN and your “wealth advisor,” and close your eyes, pinch your nose, and buy.

Silver remains an enigma, although it has advanced over 37% off the lows. It has also cleared the first two Fibonacci levels, with only USD $16.64 remaining as a hurdle.

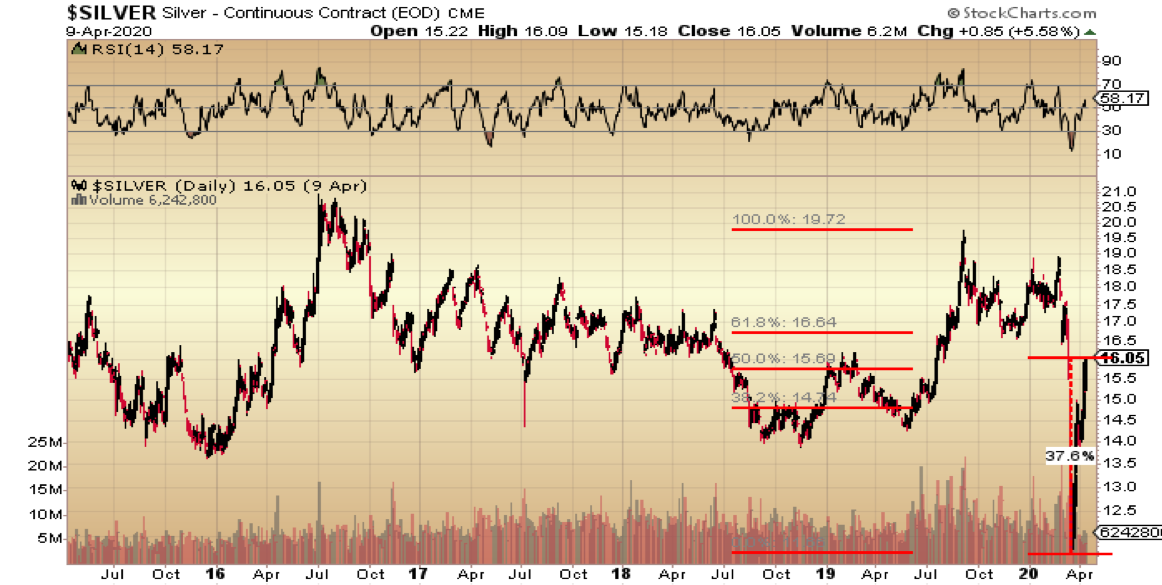
Much as I love silver, I also hate silver, because it is the most easily tampered-with pricing mechanism in the history of commerce. While we all like to think of silver as the “poor man’s gold,” it is still suffers from 57% industrial demand versus only 8% for gold, so when the world goes into a viral lockdown, silver demand plunges off a cliff, and price with it.

I am still rethinking my position on silver and how to play it for the rest of the year, but the challenge lies in this: If I opt for added alpha by going for the huge leverage and added volatility of silver, I sacrifice the certainty of being on board gold, whose fundamental and technical set-ups are spectacular. I like the certainty of gold, but I also love the excitement of a rampaging short squeeze in silver. I have been through two of them, in 1980 and in 2011, and came out with my arms, legs and face intact, and only minor damage to my liver. The exhilaration of the silver ride is matched only by the violence of its terminus, and the attendant piles of malodorous body bags at the side of the trading pit. Surviving one of them is tantamount to three tours of duty in an Asian jungle armed with a broken hockey stick and a roll of tape.

I made a prediction on Twitter last week, which is this: “Give me a 2-day close above USD $1,750 in gold and I’ll show you a $2,000 price by Queen Victoria’s birthday.” For those heathens unfamiliar with the Great Queen Victoria, we Canucks celebrate her date of birth every May 24 weekend, usually with great vigor and always with great respect. As it is usually the first chance to get the first real sunburn of the year after a grueling winter, we affectionally nicknamed it the May “Two-Four” weekend. That’s because, back in the day, every Friday included a lineup at what was called, a few decades back, “The Brewer’s Retail,” and the hard-core “players” came out of the store with a case (or several) of twenty-four bottles of Molsons or Labatts beer, affectionately and appropriately called “The Two-Four.” You didn’t order a “case” or a “dozen” or a “six-pack;” the real players ordered a “Two-Four,” and because the first really fine spring weekend of the Canuck year is usually a long weekend spent at some poor lad’s parents’ cottage, you always arrived (invited or not) with a “Two-Four.” More often than not, one left with only a few “empties,” so as to not burden the host, but that is the reason most Canucks refer to this holiday as “The May Two-Four Weekend.”

So, as is customary of the upcoming festive part of May, I raise a glass both in advance and in salute of the breakout in gold prices and the birth date of the regal Lady from whom the phrase “We are not amused” found its origin.

The last thing to discuss, notwithstanding the Herculean efforts of Bill Murphy and Chris Powell, founders of GATA, is that, at long last, we are finally witnessing the fruits of labor drawn from the hearts and loins of true believers in “free market capitalism,” the identity of whom you will be hard-pressed to find in today’s banco-politico alliance.

The domination of the mainstream media (MSM) by the owners of digital, literary and monetary printing presses, can only be described with one adjective—vile. The true role of gold has always been to protect wealth and was never meant to be a cognizant threat to the U.S. dollar because the Founding Fathers, who drafted the American Constitution, designed it that way. They knew precisely the outcome of uncontrolled and opportunistic politico-banco alliances, which was why they built currency debasement safeguards within the document.

But, as is always the case, over time the documents gets subverted through Constitutional “amendments” that are argued in defense of “modern conditions.” These “modern conditions” are at the very heart of why societies move from “free” to “enslaved,” because the elite would have you all believe that moves they are allowed to make and laws they are allowed to break are justification for outcomes rarely intended and never expected.

The indiscriminate trashing of the domestic currency of any country is a crime in over 90% of the globe’s sovereign countries. but laws protecting currency debasement are waived when the perpetrators are politicians or bankers. The average citizen goes to jail while the banco-political alliance is applauded. Abominations like this have only one defense; you don’t play their game. You have to pay your bills with dollars or euros or yuan or yen, but you don’t have to invest in them—and nor should you.

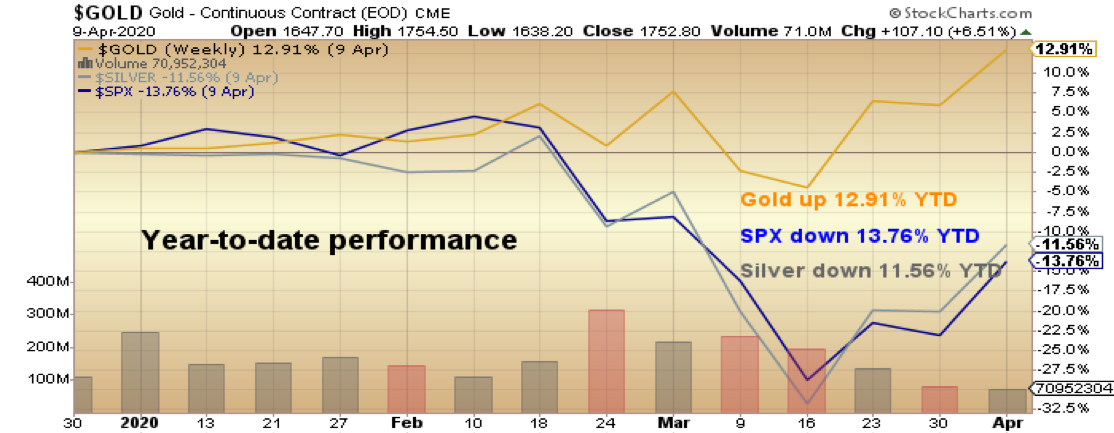
Looking out on the horizon, you must realize that the vast majority of portfolio managers around the world have, for decades, been managing money without any exposure to precious metals. In that context, gold has been an orphan, under-owned and unloved in a relative sense. With the trillions upon trillions of investible assets having ignored the space for so many years, there remains an entire generation of managers only just waking up to its portfolio utility. Having gold up 12.91% year to date has allowed those very few advisors to protect their client assets, but they are so rare that they represent a tiny fraction of the fund flows that move markets.

As soon as the Q1 performance numbers begin to surface, I predict a tsunami of new money flooding into the precious metals space. We are already seeing it, with gigantic volume and percentage moves in the big boys like Newmont Goldcorp Corp. (NEM:NYSE) and Barrick Gold Corp. (ABX:TSX; GOLD:NYSE), but when all of these imitative and herd-mentality fund managers get the memo, trillions of dollars will be chasing a very small and completely underowned sector. When this Hadrian’s Wall of demand hits the Lilliputian paucity of supply, precious metals producers, developers and explorers are going to experience exponential price moves that will dwarf the moves seen in 1976–1980 and 2002–2011.

Make sure you have your positions, because you won’t recognize these prices by the time summer rolls around.

Originally published on April 10, 2020

Follow Michael Ballanger on Twitter @MiningJunkie.

Originally trained during the inflationary 1970s, Michael Ballanger is a graduate of Saint Louis University where he earned a Bachelor of Science in finance and a Bachelor of Art in marketing before completing post-graduate work at the Wharton School of Finance. With more than 30 years of experience as a junior mining and exploration specialist, as well as a solid background in corporate finance, Ballanger’s adherence to the concept of “Hard Assets” allows him to focus the practice on selecting opportunities in the global resource sector with emphasis on the precious metals exploration and development sector. Ballanger takes great pleasure in visiting mineral properties around the globe in the never-ending hunt for early-stage opportunities.

Sign up for our FREE newsletter at: www.streetwisereports.com/get-news

Disclosure:
1) Michael J. Ballanger: I, or members of my immediate household or family, own securities of the following companies mentioned in this article: None. My company has a financial relationship with the following companies referred to in this article: None. I determined which companies would be included in this article based on my research and understanding of the sector. Additional disclosures are below.
2) The following companies mentioned in this article are billboard sponsors of Streetwise Reports: None. Click here for important disclosures about sponsor fees.
3) Statements and opinions expressed are the opinions of the author and not of Streetwise Reports or its officers. The author is wholly responsible for the validity of the statements. The author was not paid by Streetwise Reports for this article. Streetwise Reports was not paid by the author to publish or syndicate this article. Streetwise Reports requires contributing authors to disclose any shareholdings in, or economic relationships with, companies that they write about. Streetwise Reports relies upon the authors to accurately provide this information and Streetwise Reports has no means of verifying its accuracy.
4) This article does not constitute investment advice. Each reader is encouraged to consult with his or her individual financial professional and any action a reader takes as a result of information presented here is his or her own responsibility. By opening this page, each reader accepts and agrees to Streetwise Reports’ terms of use and full legal disclaimer. This article is not a solicitation for investment. Streetwise Reports does not render general or specific investment advice and the information on Streetwise Reports should not be considered a recommendation to buy or sell any security. Streetwise Reports does not endorse or recommend the business, products, services or securities of any company mentioned on Streetwise Reports.
5) From time to time, Streetwise Reports LLC and its directors, officers, employees or members of their families, as well as persons interviewed for articles and interviews on the site, may have a long or short position in securities mentioned. Directors, officers, employees or members of their immediate families are prohibited from making purchases and/or sales of those securities in the open market or otherwise from the time of the interview or the decision to write an article until three business days after the publication of the interview or article. The foregoing prohibition does not apply to articles that in substance only restate previously published company releases. As of the date of this article, officers and/or employees of Streetwise Reports LLC (including members of their household) own securities of Newmont Goldcorp, a company mentioned in this article.

Charts provided by the author.

Michael Ballanger Disclaimer:
This letter makes no guarantee or warranty on the accuracy or completeness of the data provided. Nothing contained herein is intended or shall be deemed to be investment advice, implied or otherwise. This letter represents my views and replicates trades that I am making but nothing more than that. Always consult your registered advisor to assist you with your investments. I accept no liability for any loss arising from the use of the data contained on this letter. Options and junior mining stocks contain a high level of risk that may result in the loss of part or all invested capital and therefore are suitable for experienced and professional investors and traders only. One should be familiar with the risks involved in junior mining and options trading and we recommend consulting a financial adviser if you feel you do not understand the risks involved.

South Africa cuts rate 3rd time as economy shrinks

By CentralBankNews.info
South Africa’s central bank cut its policy rate for the second time in less than a month and for the third time this year as it now expects the economy to contract by 6.1 percent this year before bouncing back in 2021 from the impact of the coronavirus.
At an extraordinary policy meeting, the South African Reserve Bank (SARB) cut its benchmark repo rate by another 100 basis points to 4.25 percent following cuts in January and March and has now cut it by 225 basis points this year.
Since July 2019, when it began a monetary easing cycle, the rate has been cut by 250 basis points.
SARB said a more prolonged lockdown and a slower economic recovery creates downside risks to inflation, which would allow further space for monetary policy to respond to the virus-induced demand shock. However, future policy decisions are highly dependent on data.
“The Covid-19 outbreak will have a major health and social impact, and forecasting domestic economic activity presents unprecedented uncertainty,” SARB’s Governor  Lesetja Kganyago said.
The policy path implied by SARB’s quarterly projection model indicates 5 repo rate cuts of 25 basis points each extending into the first quarter of 2021, with SARB noting this projection is a broad policy guide that can change from meeting to meeting in response to new data.
In addition to rate cuts. SARB has ensured liquidity in both money markets and government bond markets and eased some of its capital requirements, such as its liquidity coverage ratio.
On March 25 SARB also said it would begin buying government bonds in secondary markets but has stressed this is not a form of quantitative easing but a tool to “reduce dysfunctionality” in markets and part of its responsibility of ensuring financial markets work smoothly.
In its bi-annual monetary policy review last week SARB estimated the country’s economy could shrink by 2 to 4 percent this year and raised this estimate today to a contraction 6.1 percent from an estimated 0.8 percent in 2019.
The economic contraction is expected to be the deepest in the second quarter of this year with some recovery in the third quarter.
The strength of the recovery in the fourth quarter and in 2021 will depend on how quickly countries open up for economic activity in a safe manner, with growth next year seen rising by 2.2 percent and then 2.7 percent in 2022.
“Global economic and financial conditions are expected to remain highly volatile for the foreseeable future,” Kganyago said, adding the sustainability of the recovery in asset prices remains uncertain and global financial markets remain in a risk-off mode, which has implications for investors’ appetite for South African bonds and equities.
While lower commodity, oil prices and demand are dragging down inflation, negative global sentiment, fiscal risks and ratings downgrades have led to a 22.6 percent fall in South Africa’s rand against the U.S. dollar since January, putting upside pressure in inflation.
The timing and size of these contradictory impulses suggest they are not perfectly offsetting, SARB said, with weaker inflation in the near term likely giving way to higher inflation.
SARB now forecasts headline inflation averaging 3.6 percent this year, 4.5 percent for 2021 and 4.4 percent for 2022.
This compares with its March forecast of 3.8 percent for this year, 4.6 percent for 2021 and 4.4 percent for 2022.

The South African Reserve Bank’s monetary policy committee issued the following statement by its governor, Lesetja Kganyago:

“Since the March meeting of the Monetary Policy Committee (MPC), the Covid-19
pandemic has spread globally and its impact is being felt through all economies.
Current estimates from the IMF show global growth contracting this year by about

2.9%. 1) Economic contractions are expected to be deepest in the second quarter of 2020, with some recovery expected in the third quarter of the year. The strength of the recovery into the fourth quarter and 2021 will depend on how quickly countries are able to open up for economic activity safely, requiring sustainable social distancing rules, safety processes put in place by businesses and public institutions, and capacity of hospitals to accommodate those in need. Current indications from the World health Organisation are that the pandemic is unlikely to end quickly, with shorter, less virulent waves hitting over time.

The uncertainties of the crisis have led to extremely high volatility in financial asset prices, with sharp and deep market sell-offs followed by a partial recovery. At this stage, the sustainability of that recovery remains uncertain, and global markets remain in risk-off mode. This has implications for emerging markets and South Africa in particular, as investor appetite for rand-denominated equities and bonds is expected to remain weak.
Policy responses to the crisis have generally been robust, with the magnitudes dependent on the degree of policy space available to countries. The US Federal Reserve has taken further steps to expand its balance sheet. The European Central Bank (ECB) has made similar commitments. Emerging and developing economies generally have less policy space available and credit is more expensive, and for this reason, the International Financial Institutions (the IMF, the World Bank) and others have made available extraordinary levels of emergency financial support.
The Covid-19 outbreak will have a major health and social impact, and forecasting domestic economic activity presents unprecedented uncertainty. With that in mind, the Bank expects GDP in 2020 to contract by 6.1%, compared to the -0.2% expected just three weeks ago. GDP is expected to grow by 2.2% in 2021 and by 2.7% in 2022.
South Africa’s lockdown has been extended by an additional 14 days, bringing the total lockdown period to 35 days. Both the supply and demand effects of this extension reduce growth and deepen it in the short-term, as businesses stay shut for longer and households with income spend less. This will likely also increase job losses, with further consequences for aggregate demand. The impacts will be particularly severe for small businesses, and individuals with earnings in the informal sector.

Some factors will support growth, including where businesses are able to open under the current rules, new jobs being created to service more needs under the lockdown, and sustained government spending, both through normal operations and crisis- related spending and programmes. The faster the global economy recovers from the crisis, as China appears to be gradually doing now, the more positive growth spillovers will strengthen for South Africa, including healthy price levels for commodity exports.
Nonetheless, prices for many commodities have fallen as a result of weaker demand globally. The spot price for Brent crude oil is currently around $31 per barrel, despite a new agreement reached by Opec and other producers to make large oil production cuts. For our forecast, the Brent crude oil price is expected to average $42 per barrel in 2020 and $45 per barrel in 2021, very close to the March forecast.
As noted earlier, while advanced economies conduct exceptionally accommodative policies, global financing conditions are no longer supportive of emerging market currency and asset values. Credit risk has risen back to 2008 levels and about R100 billion of local assets have been sold by non-resident investors. The rand has depreciated by 22.6% against the USD since January and by 17.3% since the March meeting of the MPC. The implied starting point for the rand forecast is R17.80 to the US dollar, compared with R15.40 at the time of the previous meeting.
Slightly lower oil prices and sharply lower domestic growth pulls down on the inflation forecast, while negative global sentiment and fiscal risks have led to equally aggressive currency depreciation and upside pressure on inflation. The timing and
size of these contradictory impulses suggests that they are not perfectly offsetting, with weaker inflation in the near term likely giving way to higher inflation later in the forecast period.

The Bank’ s headline consumer price inflation forecast averages 3.6% for 2020, 4.5% for 2021, and 4. 4% in 2022. The forecast for core inflation is lower at 3.8% in 2020, 4.0% in 2021, and 4.2% in 2022.
The overall risks to the inflation outlook at this time appear to be to the downside. Electricity pricing remains a concern but has moderated somewhat. Risks to inflation from recent currency depreciation are expected to be muted as pass-through is slow. Global producer price inflation has decelerated. Lower oil prices will reduce petrol prices in the near term. International food prices have eased and local food price inflation is expected to remain low, in part due to higher domestic production levels.
Expectations of future inflation broadly remain around the mid-point of the band, although market-based expectations have recently ticked up in response to the depreciation of the currency 2)

Weaker domestic growth and greater fiscal risks have resulted in a downgrade by Moody’s credit rating agency and confirmation of a negative outlook by Fitch, a weaker currency and higher borrowing costs for government, banks and firms. South Africa’s risk profile has increased.
Despite this rise in country risk, the Committee notes that the more prolonged lockdown and slower recovery creates downside risk to inflation and allows further space for monetary policy to respond to the virus-induced demand shock to the economy. Barring severe and persistent currency and oil shocks, inflation is expected to be well contained, remaining below the midpoint of the target in 2020 and close to the midpoint in 2021.

Against this backdrop, the MPC decided to cut the repo rate by 100 basis points. This takes the repo rate to 4.25% per annum, with effect from 15 April 2020. The decision was unanimous.
The implied path of policy rates over the forecast period generated by the Quarterly Projection Model indicates five repo rate cuts of 25 basis points extending into the first quarter of 2021.
Monetary policy can ease financial conditions and improve the resilience of households and firms to the economic implications of Covid-19. In addition to continued easing of interest rates, the Bank has taken steps to ensure adequate liquidity in money and government bond markets and to ease capital requirements to free capital for onlending by financial institutions. Each of these steps make more capital available to households and firms.
Monetary policy however cannot on its own improve the potential growth rate of the economy or reduce fiscal risks. These should be addressed by implementing prudent macroeconomic policies and structural reforms that lower costs generally, and increase investment opportunities, potential growth and job creation. Such steps will further reduce existing constraints on monetary policy and its transmission to lending.
Global economic and financial conditions are expected to remain highly volatile for the foreseeable future. In this highly uncertain environment, future decisions will continue to be highly data dependent, sensitive to the balance of risks to the outlook and will seeks to look through temporary price shocks. As usual, the repo rate projection from the QPM remains a broad policy guide which can change from meeting to meeting in response to changing data and risks.”


Global growth in the QPM model is a trade-weighted average. For 2020 this is now at -2.6% and 4% for 2021.

The latest Bureau for Economic Research (BER) survey has expectations for 2020 down by 0.4ppts to 4.4% and to .4.6% (from 5.0%) for 2021. Five-year-ahead inflation expectations also eased to 4.7% (from 4.9%). Market analysts (Reuters Econometer) expect inflation to be, 4.2% (from 4.4%) for 2020, 4.6% (from 4.7%) in 2021 and 4.5% (from 4.6%) for 2022. Market-based rates are calculated from the break-even inflation rate, which is the yield differential between conventional and inflation-linked bonds. These sit at 4.7% for the 5-year and well over 6% on the 10-year breakeven.”

    www.CentralBankNews.info


Stocks are ‘on fire’ – but a second coronavirus wave isn’t priced in

By George Prior

U.S. stock markets might be ‘on fire’ as earnings season begins – but Wall Street has not priced in a second wave of coronavirus, warns the CEO of one of the world’s largest independent financial advisory organizations.

The warning from deVere Group’s chief executive Nigel Green comes as the S&P 500 gained over 2 per cent in early trading, following gains in European and the Asia-Pacific markets.

Mr Green notes: “This week, with earnings season underway, we are going to see just the beginning of how corporate America and Europe have been hit by the coronavirus pandemic. The results are likely to be dismal and forecasts for the rest of the year can be expected to be revised down.

“However, investors are overlooking this. Instead, they are clinging on to relatively positive economic news from China, hints that some major lockdowns in Europe and elsewhere are being eased, and that confirmed cases are falling –meaning economic activity can be revived.”

He continues: “It’s truly astonishing that as global economic growth forecasts are looking bleak and most countries are battling potentially one of the worst downturns in a generation, the markets are on fire and trading as though these are normal times.

“They are not normal times. We are in unchartered waters. This isn’t the time to be complacent as I doubt the bear market is over. We shouldn’t call the bottom yet.

“It would appear that the financial markets are oblivious to the obvious and serious financial threat of a potential second wave of the coronavirus.  Alarmingly, this does not seem to have been priced in.”

Mr Green goes on to add: “The markets’ bullish sentiment during this mass disruption and dislocation would be baffling enough, but there are also other headwinds on the horizon.”

These, he notes, include the U.S. Presidential election, the threat of a no-deal Brexit, and the longer-term inflation risks.

The deVere CEO observes: “We can expect markets to remain volatile in the short-term.

“Many savvy investors will be riding the wave of volatility to build up their portfolios through lower entry points and seeking value and decent returns in order to grow their wealth. Why? Because history teaches us that over the longer-term the performance of stock markets is fairly predictable: they go up.”

Nigel Green concludes: “The markets are growing more positive about the Covid-19 crisis.

“But to sidestep taking a potentially massive hit, investors must avoid complacency and emotional decisions through solid financial strategies.”

About:

deVere Group is one of the world’s largest independent advisors of specialist global financial solutions to international, local mass affluent, and high-net-worth clients.  It has a network of more than 70 offices across the world, over 80,000 clients and $12bn under advisement.

Indonesia holds rate but boosts intervention amid risks

By CentralBankNews.info
Indonesia’s central bank left its policy rate steady but strengthened its intervention in financial markets and the banking system to “maintain external stability amidst heightened global financial market uncertainty.”
Although Bank Indonesia (BI) maintained its benchmark 7-day reverse repo rate at 4.50 percent, it left little doubt it will cut the rate if needed, saying there is “adequate space to lower the policy rate due to mild inflationary pressures and the urgent need to stimulate economic growth.”
BI has already lowered its benchmark rate twice this year by 50 basis points following cuts in February and March. Today it also left the rates on its deposit and lending facilities at 3.75 and 5.25 percent, respectively.
In another lengthy statement, BI laid out its latest steps in countering the threat from the spread of the coronavirus, or COVID-19, to the stability of financial markets and economic growth.
“The risk of global economic recession will peak in the second and third quarters of 2020, mirroring the COVID-19 pandemic, with a recovery expected to begin in the fourth quarter of 2020,” BI said.
Indonesia’s economy is expected to mirror the global path due to the impact of disruptions to global supply chains, the fall in global demand and commodity prices, with the economic downturn peaking in the second and third quarters before upward momentum in the fourth quarter of this year.
Due to the decline in domestic demand from lower household incomes and investment, BI now expects domestic growth of around 2.3 percent this year and then a significant rebound in 2021, mirroring the expected global economic recovery.
On March 19 BI cut its 2020 growth forecast to 4.2-4.9 percent from an earlier forecast of 5.1-5.5 percent and 2019’s growth of 5.02 percent.
Last month BI also forecast a rebound to growth of 5.2-5.6 percent in 2021 but it didn’t mention this forecast in today’s statement.
Today’s initiatives by BI include strengthening “the intensity” of its triple intervention policy, which refers to interventions in the spot and domestic non-deliverable forward foreign exchange markets “to stabilize and strengthen rupiah exchange rates,” along with its purchases of government securities, including sharia bonds, in the secondary market.
After plunging almost 14 percent from March 1 to March 23, the rupiah has bounced back in the last week on an influx of foreign capital and a US$60 billion repo agreement with the Federal Reserve, and rose further today to around 15,651 to the U.S. dollar.
But the rupiah it is still down 11 percent since the start of the year.
“Bank Indonesia is confident that the current value of the rupiah is adequate to support economic rebalancing, as the currency is fundamentally undervalued,” BI said, adding its expects the currency to strengthen toward 15,000 per U.S. dollar at the end of 2020.
“To support national economic recovery efforts from the deleterious COVID-19 impact, Bank Indonesia will increase monetary easing through quantitative easing,” it said.
So far this year BI has already injected liquidity to money markets and banks totaling nearly 300 trillion rupiah through the purchase of 166 billion of government securities, by injecting more than 56 trillion in liquidity to the banking system through term repos, by lowering the rupiah reserve requirement for some banks on April 1 which added 22 trillion of liquidity, and lowering the foreign currency reserve requirement, boosting liquidity by some US$3.2 billion.
The steps BI is taking today include expanding its monetary operations by providing banks and corporates with 1-year term repos in which government securities can be used as collateral, lowering the reserve requirement by 200 basis points for conventional banks and by 50 basis points for Islamic banks as of May 1, and relaxing the additional demand deposit obligations to meet the macro prudential intermediation ratio by one year.
To strengthen liquidity management in the banking industry and in relation to the lower reserve requirement, BI raised the macroprudential liquidity buffer (MLB) by 200 basis points for conventional banks and by 50 points for Islamic banks as of May 1, with banks required to meet this additional buffer through the purchase of government securities in the primary market.
BI also said it was adjusting some of its payment system policy instruments to increase the uptake of non-cash payments to help ease the COVID-19 impact, including relaxing some of the rules for credit card payments, including minimum payment requirements and penalties for late payments, and supporting government programs to accelerate non-cash social aid disbursements by expediting the electrification of some social programs.

Bank Indonesia issued the following statement:

“The BI Board of Governors agreed on 13th and 14th April 2020 to hold the BI 7-Day Reverse Repo Rate at 4.50%, while also maintaining the Deposit Facility (DF) and Lending Facility (LF) rates at 3.75% and 5.25%.The decision considers the need to maintain external stability amidst heightened global financial market uncertainty, while Bank Indonesia perceives adequate space to lower the policy rate due to mild inflationary pressures and the urgent need to stimulate economic growth.
1.      To stabilise and strengthen rupiah exchange rates, Bank Indonesia has strengthened the intensity of triple intervention policy through the spot and Domestic Non-Deliverable Forward (DNDF) markets, as well as purchasing SBN in the secondary market.
2.      To support national economic recovery efforts from the deleterious COVID-19 impact, Bank Indonesia will increase monetary easing through quantitative easing as follows:
a.      Expand monetary operations by providing banks and the corporates a term-repo mechanism with SUN/SBSN underlying transactions of tenors up to one year.
b.      Lower the rupiah reserve requirement ratios by 200bps for conventional commercial banks and by 50bps for Islamic banks/Islamic business units, effective from 1st May 2020.
c.      Relax the additional demand deposit obligations to meet the Macroprudential Intermediation Ratio (MIR) for conventional commercial banks as well as Islamic banks/Islamic business units for a period of one year, effective from 1st May 2020.
3.     To strengthen liquidity management in the banking industry and in relation to the lower rupiah requirements, Bank Indonesia has raised the Macroprudential Liquidity Buffer (MLB) by 200bps for conventional commercial banks and by 50bps for Islamic banks/Islamic business units, effective from 1st May 2020.  The banking industry is required to meet the additional MLB through purchases of government issued SUN/SBSN in the primary market.
4.     To increase the uptake of non-cash payment instruments in order to mitigate the COVID-19 impact, Bank Indonesia is increasing various payment system policy instruments as follows:
a.      Supporting government programs to accelerate non-cash social aid program (bansos) disbursements to members of the public in conjunction with payment system service providers by expediting the electronification of relevant social programs, including the Family Hope Program (PKH), Noncash Food Assistance Program (BPNT), Pre-Employment Card and Smart Indonesian Card (KIP).
b.     Increasing public socialisation activities in collaboration with payment system service providers to increase the uptake of non-cash payment instruments through digital banking, electronic money and broader QRIS acceptance.
c.     Relaxing credit card policy by lowering the upper limit for credit card interest, minimum payment requirements and the penalties for late payments, while supporting credit card issuer policy to extend the due date for customers.
Further clarification concerning the lower reserve requirements, higher MLB ratio and credit card policy is provided in the attachment to this press release.
Bank Indonesia’s policy mix is part of the policy synergy coordinated closely with the Government as well as through the Financial System Stability Committee as well as other relevant authorities to maintain macroeconomic and financial system stability, while striving to recover the national economy from COVID-19.  Bank Indonesia will continue to monitor economic and global financial market dynamics as well as the spread of COVID-19 and its economic impact on Indonesia over time, while implementing the coordinated follow-up policies required with the Government and Financial System Stability Committee to maintain macroeconomic and financial system stability, and supporting the national economic recovery.
The COVID-19 pandemic has spread to all corners of the world and intensified the risk of a global economic recession in 2020, while its impact on global financial market panic is gradually subsiding.  The risk of a global economic recession in 2020 has increased due to compressed demand and production disruptions caused, amongst others, by limited individual mobility and other restrictions to reduce COVID-19 transmission. Congruently, economic contraction is predicted in advanced economies for 2020, including the United States and various countries in Europe, despite ultra-accommodative fiscal and monetary policies.  In addition, the economic growth outlook for developing economies has also been downgraded.  The risk of global economic recession will peak in the second and third quarters of 2020, mirroring the COVID-19 pandemic, with a recovery expected to begin in the fourth quarter of 2020.  In 2021, world economic growth is expected to rebound strongly due to the various policies implemented worldwide in addition to the base effect.  Meanwhile, global financial market panic, which peaked in March 2020, has begun to subside in line with positive sentiment concerning the global policy response.  Global financial market risk has faded, as confirmed by a decline in the VIX volatility index from a level of 85.4 on 18thMarch 2020 to 41.2 on 14th April 2020.
Global economic decline and the spread of COVID-19 in Indonesia are expected to hamper domestic economic growth momentum.  Exports in 2020 are predicted to decline on compressed global demand, global supply chain disruptions and low international commodity prices.  Meanwhile, social restrictions to contain COVID-19 have eroded private incomes and reduced production, thus lowering domestic demand in the form of household consumption and investment.  Domestic economic moderation in Indonesia is projected to peak in the second and third quarters of 2020, mirroring the anticipated global economic contraction and economic impact of COVID-19 containment measures.  Notwithstanding, the national economy is expected to regain upward momentum in the fourth quarter of 2020, with overall growth for the year projected around 2.3% before increasing significantly in 2021.  In addition to the expected global economic improvements, the national economic recovery will also be driven by various policies implemented by the Government, Bank Indonesia and other relevant authorities.
A narrow current account deficit is projected.  Despite an export decline on dwindling demand and lower international commodity prices, the trade balance is expected to improve due to a deeper import contraction on falling domestic demand as well as less demand for production inputs for export activities.  Furthermore, a narrower services trade deficit is also expected due to lower import transportation costs and lower-than-projected tourism receipt.  The primary income account deficit has also reduced in line with shrinking foreign holdings of domestic financial instruments.  Overall, the current account deficit is projected below 1.5% of GDP in the first quarter of 2020.  Meanwhile, foreign capital inflows are expected to gradually return to Indonesia as global financial market panic continues to ease and the domestic economy gains momentum.  Overall, the solid BOP outlook will reinforce external sector resilience in Indonesia.  At the end of March 2020, the position of reserve assets stood at USD121.0 billion, equivalent to 7.2 months of imports or 7.0 months of imports and servicing government external debt, which is projected to increase at the end of April 2020.  Bank Indonesia is confident that the current position of international reserves is more than adequate to meet imports, service government external debt and stabilise rupiah exchange rates.
The rupiah regained some of its lost value in the second week of April 2020 as global financial market panic began to subside.  On 13th April 2020, the rupiah appreciated 4.35% (ptp) on the level recorded at the end of March 2020.  Notwithstanding, the rupiah has still depreciated by around 11.18% on the level recorded at the end of 2019.  The rupiah appreciated in April 2020 in response to an influx of foreign capital flows to domestic financial markets after various policies were implemented around the world to mitigate the economic impact of COVID-19, including in Indonesia.  The stronger rupiah was also supported by the maintained supply of foreign exchange from domestic players, which underpinned rupiah exchange rate stability.  Bank Indonesia is confident that the current value of the rupiah is adequate to support economic rebalancing, as the currency is fundamentally undervalued.  Furthermore, rupiah stability is expected as the currency strengthens towards Rp15,000 per US dollar at the end of 2020.  Moving forward, Bank Indonesia will continue to bolster rupiah stabilisation policy in line with the currency’s fundamental value and market mechanisms.  To that end, Bank Indonesia will increase the intensity of triple intervention policy through the spot and Domestic Non-Deliverable Forward (DNDF) markets, as well as purchasing SBN in the secondary market.  To boost the effectiveness of exchange-rate policy, therefore, Bank Indonesia will continue to optimise monetary operations in order to ensure sound market mechanisms and adequate liquidity in the money and foreign exchange markets.
Inflation remains low, thus supporting economic stability.  CPI inflation in March 2020 was recorded at 0.10% (mtm), down from 0.28% (mtm) the month earlier, influenced by weak demand and adequate goods supply, including food, as well as a smooth distribution chain.  By component, low headline inflation stemmed from controlled core inflation as well as deflation of volatile foods and administered prices.  Core inflation, excluding gold, remains under control due to policy consistency by Bank Indonesia to anchor rational inflation expectations to the target corridor, together with low exchange-rate pass-through.  Gold prices were edged up by international gold prices in line with higher demand as a safe haven asset during this period of heightened global financial market uncertainty.  Meanwhile, volatile food deflation was accounted for by price corrections affecting several commodities, such as various chili varieties, fresh fish, garlic and cooking oil.  In addition, further corrections to airfares contributed to the deflationary pressures on administered prices.  Consequently, annual CPI inflation in March 2020 remained under control at 2.96% (yoy), down marginally from 2.98% (yoy) in February 2020.  Going forward, Bank Indonesia will consistently maintain price stability and strengthen policy coordination with the central and local governments to control low and stable inflation in the 3.0%±1% range in 2020 and 2021.
Effective transmission of the accommodative monetary policy stance is supported by adequate liquidity in the banking industry.  Monetary policy transmission through the interest rate channel to the money market remains effective, as reflected by a further 150bps decline in the overnight interbank rate to 4.34% and a 166bps decrease in the 1-week Jakarta Interbank Offered Rate (JIBOR) to a level of 4.58% since the end of June 2019, prior to the policy rate (BI7DRR) reductions initiated in July 2019.  Meanwhile, transmission of lower interest rates to deposit rates and lending rates in the banking industry continued in February 2020.  Consequently, the weighted average deposit rate from the end of June 2019 to February 2020 fell 67bps to 6.16%, with the average lending rate on working capital loans falling 35bps to 10.07%.  Monetary policy transmission through the interest rate channel is supported by Bank Indonesia’s policy response to maintain adequate liquidity in the banking system.  Thus far in 2020, Bank Indonesia has injected liquidity to the money market and banking industry totalling nearly Rp300 trillion through various policy measures, including: (i) purchasing Rp166 trillion of SBN in the secondary market; (ii) injecting liquidity to the banking industry totalling more than Rp56 trillion through a term-repo mechanism with underlying SBN transactions held by the banking industry; (iii) lowering the rupiah reserve requirement by another 50bps, effective from 1st April 2020, generating Rp22 trillion of additional liquidity, after lowering the reserve requirements in 2019 and at the beginning of 2020, which already added around Rp53 trillion of liquidity; and (iv) lowering the foreign currency reserve requirement by 4% to increase foreign currency liquidity in the banking industry by around USD3.2 billion.  The policy response taken by Bank Indonesia maintained adequate liquidity in the money market and banking industry, as reflected by a high average daily transaction value in the interbank money market in March 2020 at Rp12.8 trillion, together with a high ratio of liquid assets to deposits of 22.81% in February 2020.  Bank Indonesia will continue to ensure adequate liquidity and enhance money market efficiency, while strengthening transmission of the accommodative policy mix.  In addition, Bank Indonesia is also confident that the latest round of fiscal stimuli introduced by the Government will further strengthen the effective transmission of liquidity injections by Bank Indonesia to the real sector.
Financial system stability has been maintained, although the potential risks associated with the COVID-19 impact on macroeconomic and financial system stability must still be anticipated.  Financial system stability was reflected by a high Capital Adequacy Ratio (CAR) of 22.27% in February 2020, coupled with a low level of non-performing loans (NPL) at 2.79% (gross) and 1.04% (nett).  A softening in the domestic economy and increasing economic uncertainty due to the COVID-19 pandemic has undermined demand for new loans and increased cautious and selective bank lending.  Bank Indonesia will focus macroprudential policy measures on efforts to maintain financial system stability and anticipate potentially higher risks in the financial sector due to COVID-19.  Coordination with financial authorities and relevant government ministries/agencies will constantly be improved in terms of formulating an optimal policy mix and to mitigate escalating risk in the financial system.


Payment system availability, both cash and non-cash, remains uninterrupted.  The position of currency in circulation accelerated to 7.53% (yoy) in March 2020 in anticipation of growing demand for cash during the COVID-19 containment period.  Meanwhile, non-cash transactions using ATM/debit cards, credit cards and electronic money in February 2020 were observed to decrease in line with less economic activity.  Nevertheless, payments using digital transactions in March 2020 are expected to increase as a consequence of growing demand for digital financial and economic transactions during the period of mobility restrictions.  Bank Indonesia appreciates the various efforts of players in the digital economy and finance to promote the use of non-cash payments, while backing government programs to disburse social aid program assistance through non-cash channels.  Such efforts have not only supported day-to-day economic activities yet also increased economic efficiency.  In conjunction with payment system service providers, Bank Indonesia will strengthen digital transformation for the Indonesian economy through implementation of the Indonesia Payment System Blueprint 2025, including broader QRIS acceptance amongst MSME merchants and traditional markets, education facilities, social institutions and places of worship.”


Crude OIL Analysis: OPEC + agreement signed

By IFCMarkets

OPEC + agreement signed

23 OPEC + member countries, including Russia, agreed to reduce oil production by around 10 million barrels per day (bpd). Other oil producing countries will also join them. Particularly, Brazil and a number of other states have already stated this. The USA and Canada may also participate. Thus, according to the Energy Intelligence Agency, the total volume of world oil production may be reduced by 20 million bpd. The OPEC agreement is expected to remain in force until May 2022. OPEC + will limit oil production from May 1, 2020. The exact dates of other countries’ accession are not yet known, but it is expected to happen before the end of June. Let us recall that due to the quarantine amidst the coronavirus pandemic, excess oil in the world market is estimated by various international organizations and banks in the amount of 16 to 30 million bpd.

IndicatorVALUESignal
RSIBuy
MACDBuy
MA(200)Neutral
FractalsNeutral
Parabolic SARBuy
Bollinger BandsNeutral


Summary of technical analysis

OrderBuy
Buy stopAbove 30,5
Stop lossBelow 20,5

Market Analysis provided by IFCMarkets

Ichimoku Cloud Analysis 14.04.2020 (AUDUSD, USDJPY, USDCHF)

Article By RoboForex.com

AUDUSD, “Australian Dollar vs US Dollar”

AUDUSD is trading at 0.6427; the instrument is moving above Ichimoku Cloud, thus indicating a bullish tendency. The markets could indicate that the price may test Tenkan-Sen and Kijun-Sen at 0.6395 and then resume moving upwards to reach 0.6535. Another signal to confirm further ascending movement is the price’s rebounding from the rising channel’s downside border. However, the scenario that implies further growth may be canceled if the price breaks the cloud’s downside border and fixes below 0.6225. In this case, the pair may continue falling towards 0.6175.

AUDUSD
Risk Warning: the result of previous trading operations do not guarantee the same results in the future

USDJPY, “US Dollar vs Japanese Yen”

USDJPY is trading at 107.67; the instrument is moving below Ichimoku Cloud, thus indicating a descending tendency. The markets could indicate that the price may test the cloud’s downside border at 107.95 and then resume moving downwards to reach 105.25. Another signal to confirm further descending movement is the price’s rebounding from the descending channel’s upside border. However, the scenario that implies further decline may be canceled if the price breaks the cloud’s upside border and fixes above 109.35. In this case, the pair may continue growing towards 110.05.

USDJPY
Risk Warning: the result of previous trading operations do not guarantee the same results in the future

USDCHF, “US Dollar vs Swiss Franc”

USDCHF is trading at 0.9645; the instrument is moving below Ichimoku Cloud, thus indicating a descending tendency. The markets could indicate that the price may test the cloud’s upside border at 0.9660 and then resume moving downwards to reach 0.9565. Another signal to confirm further descending movement is the price’s rebounding from the descending channel’s upside border. However, the scenario that implies further decline may be canceled if the price breaks the cloud’s upside border and fixes above 0.9695. In this case, the pair may continue growing towards 0.9775.

USDCHF

Article By RoboForex.com

Japanese Candlesticks Analysis 14.04.2020 (GOLD, NZDUSD, GBPUSD)

Article By RoboForex.com

XAUUSD, “Gold vs US Dollar”

As we can see in the H4 chart, after testing another resistance level and forming several reversal patterns, such as Harami, Gold is trying to reverse. The current situation implies that the pair may form a correction and then resume the rising tendency. In this case, the upside target may be at 1750.00. At the same time, there is another scenario, according to which the instrument may correct towards 1685.00.

GOLD
Risk Warning: the result of previous trading operations do not guarantee the same results in the future

NZDUSD, “New Zealand vs. US Dollar”

As we can see in the H4 chart, the rising channel continues. After finishing a Harami reversal pattern, NZDUSD is reversing. Possibly, the pair complete the correction and resume trading upwards. The upside target may be at 0.6190. Still, one shouldn’t exclude another scenario, which says that the instrument may continue the pullback towards 0.6050.

NZDUSD
Risk Warning: the result of previous trading operations do not guarantee the same results in the future

GBPUSD, “Great Britain Pound vs US Dollar”

As we can see in the H4 chart, the pair continues growing within the rising channel. By now, GBPUSD has formed several reversal patterns, such as Doji, close to the support level. At the moment, the pair is reversing and may later resume growing with the target at 1.2675. However, there is another scenario, which implies that the instrument may fall and test 1.2425.

GBPUSD

Article By RoboForex.com

The Analytical Overview of the Main Currency Pairs on 2020.04.14

by JustForex

The EUR/USD currency pair

Technical indicators of the currency pair:
  • Prev Open: 1.09390
  • Open: 1.09084
  • % chg. over the last day: -0.16
  • Day’s range: 1.09016 – 1.09487
  • 52 wk range: 1.0777 – 1.1494

The EUR/USD currency pair has become stable. At the moment, the technical pattern is ambiguous. Financial markets participants expect additional drivers. The local support and resistance levels are 1.0915 and 1.0965, respectively. We do not exclude further growth of the single currency. Positions should be opened from key support and resistance levels.

Chinese exports and imports slowed down the decline in March after falling earlier this year. At the same time, most experts agree that a confident recovery in trade is not expected in the near future.

The Economic News Feed for 14.04.2020

  • Today, the publication of important economic releases is not planned.
EUR/USD

Indicators do not give accurate signals: the price has crossed 50 MA.

The MACD histogram is near the 0 mark.

Stochastic Oscillator is in the neutral zone, the %K line is below the %D line, which indicates the bearish sentiment.

Trading recommendations
  • Support levels: 1.0915, 1.0885, 1.0835
  • Resistance levels: 1.0965, 1.1010, 1.1035

If the price fixes above 1.0965, further growth of the EUR/USD currency pair is expected. The movement is tending to 1.1000-1.1020.

An alternative could be a drop in the EUR/USD quotes to 1.0885-1.0860.

The GBP/USD currency pair

Technical indicators of the currency pair:
  • Prev Open: 1.24583
  • Open: 1.24975
  • % chg. over the last day: +0.42
  • Day’s range: 1.24971 – 1.25739
  • 52 wk range: 1.1466 – 1.3516

GBP/USD quotes show a steady uptrend. The trading instrument has updated local highs again. The British pound found resistance at 1.2570. The round level of 1.2500 is already a “mirror” support. We do not exclude further growth of the GBP/USD currency pair. We recommend following the latest information regarding the COVID-19 spread. Positions should be opened from key levels.

The news feed on the UK economy is calm.

GBP/USD

Indicators signal the power of buyers: the price has fixed above 50 MA and 100 MA.

The MACD histogram is in the positive zone, indicating the bullish sentiment.

Stochastic Oscillator has started to exit the overbought zone, the %K line is below the %D line, which indicates a possible correction of the GBP/USD currency pair.

Trading recommendations
  • Support levels: 1.2500, 1.2440, 1.2400
  • Resistance levels: 1.2570, 1.2650

If the price fixes above 1.2570, further growth of GBP/USD quotes is expected. The movement is tending to 1.2620-1.2650.

An alternative could be a decrease in the GBP/USD currency pair to 1.2470-1.2440.

The USD/CAD currency pair

Technical indicators of the currency pair:
  • Prev Open: 1.39236
  • Open: 1.38912
  • % chg. over the last day: -0.47
  • Day’s range: 1.38627 – 1.39060
  • 52 wk range: 1.2949 – 1.4668

The USD/CAD currency pair has been declining. The trading instrument has updated local lows. The loonie is currently consolidating near the support level of 1.3855. The 1.3925 mark is already a “mirror” resistance. The Canadian dollar has the potential for further growth against the greenback. We recommend paying attention to the dynamics of oil quotes. Positions should be opened from key levels.

The news feed on Canada’s economy is calm.

USD/CAD

Indicators signal the power of sellers: the price has fixed below 50 MA and 100 MA.

The MACD histogram is in the negative zone, indicating the bearish sentiment.

Stochastic Oscillator is in the neutral zone, the %K line is above the %D line, which gives a signal to buy USD/CAD.

Trading recommendations
  • Support levels: 1.3855, 1.3800
  • Resistance levels: 1.3925, 1.4000, 1.4070

If the price fixes below 1.3855, a further drop in the USD/CAD quotes is expected. The movement is tending to the round level of 1.3800.

An alternative could be the growth of the USD/CAD currency pair to 1.3960-1.4000.

The USD/JPY currency pair

Technical indicators of the currency pair:
  • Prev Open: 108.388
  • Open: 107.745
  • % chg. over the last day: -0.52
  • Day’s range: 107.536 – 107.756
  • 52 wk range: 101.19 – 112.41

The USD/JPY currency pair continues to show a negative trend. The trading instrument has updated local lows again. At the moment, USD/JPY quotes are consolidating in the range of 107.50-107.85. Demand for the “safe haven” currencies is still high. The yen has the potential for further growth against the greenback. We recommend paying attention to the dynamics of US government bonds yield. Positions should be opened from key levels.

The news feed on Japan’s economy is calm.

USD/JPY

Indicators signal the power of sellers: the price has fixed below 50 MA and 100 MA.

The MACD histogram is in the negative zone, indicating the bearish sentiment.

Stochastic Oscillator is in the neutral zone, the %K line is below the %D line, which also gives a signal to sell USD/JPY.

Trading recommendations
  • Support levels: 107.50, 107.15, 106.90
  • Resistance levels: 107.85, 108.20, 108.60

If the price fixes below 107.50, a further drop in the USD/JPY quotes is expected. The movement is tending to the round level of 107.00.

An alternative could be the growth of the USD/JPY currency pair to 108.10-108.30.

by JustForex

NZDUSD Analysis: Falling visitor arrivals in New Zealand bearish for NZDUSD

By IFCMarkets

Falling visitor arrivals in New Zealand bearish for NZDUSD

Visitor arrivals dropped in New Zealand in February: it dropped 7.7% after 1.3% decline in January, according to state statistics agency report. This is bearish for NZDUSD.

IndicatorVALUESignal
RSINeutral
MACDSell
Donchian ChannelSell
MA(200)Buy
FractalsNeutral
Parabolic SARSell


Summary of technical analysis

OrderSell
Buy stopBelow 0.6075
Stop lossAbove 0.6129

Market Analysis provided by IFCMarkets

Optimistic Data from China Brought Investors Hope

by JustForex

Yesterday, the US dollar did not change a lot against a basket of major currencies. Trading activity was reduced due to the Easter holidays. Today, the US currency has been declining, and more risky currencies have risen, as fairly optimistic economic data were published in China. Signs of a slowdown in the spread of coronavirus in China gave hope that the peak of the pandemic could be behind. Thus, Chinese exports and imports decreased by 6.6% and 0.9%, respectively, while experts forecasted a decrease by 14% and 9.5%.

The Fed and the US Congress, in turn, “have precluded the prospect of a complete economic collapse.” The number of deaths from COVID-19 in the United States per day also fell sharply, and the country began to plan a resumption of economic activity. To date, there are 1,925,811 people infected with coronavirus, of which 582,594 are in the United States.

The “black gold” prices have fallen again. Currently, futures for the WTI crude oil are testing the $22.05 mark per barrel. At 23:30 (GMT+3:00), API weekly crude oil stock will be published.

Market indicators

Yesterday, there was a variety of trends in the US stock market: #SPY (-0.91%), #DIA (-1.34%), #QQQ (+1.08%).

The 10-year US government bonds yield rose slightly. At the moment, the indicator is at the level of 0.75-0.76%.

The news feed on 2020.04.14:
  • – Export and import price indices in the US at 15:30 (GMT+3:00).

by JustForex