Here’s what should happen during a bear-market rally as sentiment rises
By Elliott Wave International
A question was posed to Elliott Wave International President Robert Prechter for a classic Elliott Wave Theorist (Prechter’s monthly publication about financial markets and social trends since 1979):
Under the Wave Principle, what is the most important thing to watch other than price?
Prechter answered:
Volume.
You see, high trading volume means that traders are displaying a great deal of conviction about a given market, whether the trend is up or down. Low trading volume means a lack of enthusiasm.
In other words, during strong bull markets, up days are often accompanied by high trading volume, while countertrend declines usually occur on low trading volume. In bear markets, down days are generally powered by tons of trading volume with rallies occurring on weak volume.
When a bear market is near an end, price declines usually begin to occur on contracting volume. Likewise, when a bull market is exhausted, price rises are usually accompanied by waning volume.
For example, here’s a chart and commentary from EWI’s Oct. 5, 2007 U.S. Short Term Update:
Note how weak the volume pattern has been in the push from the August 16 low, which is one of the reasons that we keep saying the rise is “narrow.” The middle clip on the chart shows the 10-day average of NYSE New Highs minus New Lows, showing yet another indicator that is lagging as prices make new highs.
Less than a week later, the S&P 500 index hit a then intraday record high before beginning a bear market slide.
Now, let’s consider the current market environment, and this chart and commentary from the April 20, 2020 U.S. Short Term Update:
The power of a second-wave rally should wane as sentiment rises. So far, the market’s advance since March 23 fits this profile. As the chart shows, daily market volume has contracted steadily as the advance has progressed. The 3-day average has come back to nearly the level it was in late-February, when the Dow was still above 27,000.
Now, let’s get back to that question from the classic Theorist about “the most important thing to watch other than price.”
The question itself implies that no other indicator is as important as price — or price patterns, to be more exact. And that is absolutely correct.
As Frost & Prechter’s Elliott Wave Principle: Key to Market Behavior notes:
Since wave analysis is based upon price patterns, a pattern identified as having been completed is either over or it isn’t. If the market changes direction, the analyst has caught the turn. If the market moves beyond what the apparently completed pattern allows, the conclusion is wrong, and any funds at risk can be reclaimed immediately.
You can read the online version of this Wall Street classic book in its entirety — 100% free. Simply sign up for a free Club EWI membership for instant access.
This article was syndicated by Elliott Wave International and was originally published under the headline This Major Stock Market Indicator is Flashing a HUGE Signal. EWI is the world’s largest market forecasting firm. Its staff of full-time analysts led by Chartered Market Technician Robert Prechter provides 24-hour-a-day market analysis to institutional and private investors around the world.
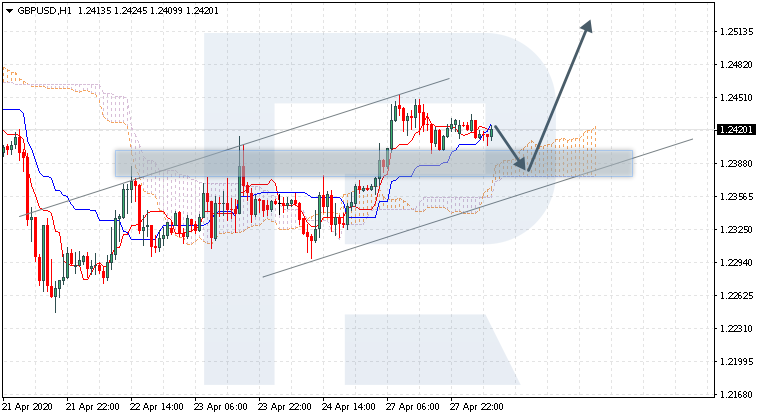
GBPUSD is trading at 1.2420; the instrument is moving above Ichimoku Cloud, thus indicating a bullish tendency. The markets could indicate that the price may test the cloud’s downside border at 1.2380 and then resume moving upwards to reach 1.2525. Another signal in favor of further ascending movement is the price’s rebounding from the rising channel’s downside border. However, the scenario that implies further growth may no longer be valid if the price breaks the cloud’s downside border and fixes below 1.2350. In this case, the pair may continue falling towards 1.2285.
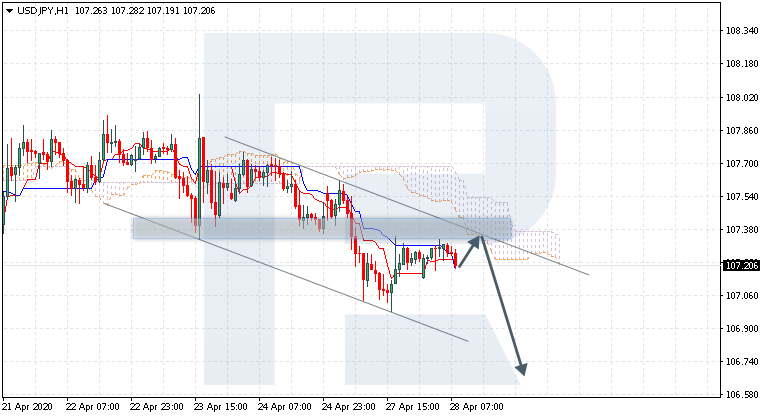
USDJPY, “US Dollar vs Japanese Yen”
USDJPY is trading at 107.20; the instrument is moving below Ichimoku Cloud, thus indicating a descending tendency. The markets could indicate that the price may test the cloud’s downside border at 107.35 and then resume moving downwards to reach 106.65. Another signal to confirm further descending movement is the price’s rebounding from the descending channel’s upside border. However, the scenario that implies further decline may be canceled if the price breaks the cloud’s upside border and fixes above 107.65. In this case, the pair may continue growing towards 108.35.
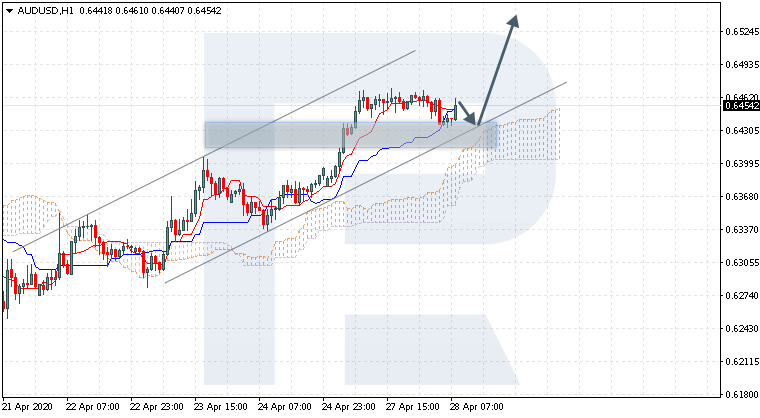
AUDUSD, “Australian Dollar vs US Dollar”
AUDUSD is trading at 0.6454; the instrument is moving above Ichimoku Cloud, thus indicating a bullish tendency. The markets could indicate that the price may test the cloud’s upside border at 0.6430 and then resume moving upwards to reach 0.6535. Another signal to confirm further ascending movement is the price’s rebounding from the support level. However, the scenario that implies further growth may be canceled if the price breaks the cloud’s downside border and fixes below 0.6365. In this case, the pair may continue falling towards 0.6285.
Attention! Forecasts presented in this section only reflect the author’s private opinion and should not be considered as guidance for trading. RoboForex LP bears no responsibility for trading results based on trading recommendations described in these analytical reviews.
Most of that is aimed at individual Americans in the form of additional unemployment insurance or the so-called economic impact checks. About $1.2 trillion – and counting – represent bailouts for American companies, large and small.
And more than 60% of that is in the form of grants or other financial assistance that will likely become grants – funds that will not be recovered by taxpayers. The Congressional Budget Office estimated on April 23 that the company-related coronavirus bailouts, excluding the fourth one just signed into law, will ultimately cost more than $400 billion over 10 years. Given that most of the latest bailout, worth $484 billion, will most likely end up becoming grants to small businesses as well, the price tag is bound to get a lot higher.
It may not come as a surprise that taxpayers ultimately foot the bill when lawmakers spend their money to bail out a corporate industry – such as Wall Street during the Great Recession – or the entire economy today. But this is actually the exception, not the rule.
The truth is, as my research shows, the vast majority of business bailouts passed by Congress over the past half century have either broken even or generated a profit.
Image by MotionStudios / Pixabay
Profitable bailouts
As part of my ongoing research on economic policymaking during recessions, I studied 10 corporate bailouts approved by Congress since 1969.
I only looked at bailouts that involved direct assistance – in the forms of loans, guarantees, grants or capital injections – by Congress to a company or industry in financial distress. I excluded the Savings and Loan crisis of the 1980s and 1990s because that was less of a bailout and more of an expensive regulatory wind-down. All of the figures below have been adjusted for inflation.
I found that half of the bailouts made a clear profit for taxpayers.
For example, Lockheed Martin ran into financial difficulties in 1971 because the planes, helicopters and other military equipment it was making for the U.S. Department of Defense cost more than the Pentagon agreed to pay, which led to significant losses and fees. The defense contractor pinned its survival on making money off its state-of-the-art TriStar airliner but struggled to secure enough financing to finish the project.
Congress, concerned with the loss of at least 25,000 jobs if Lockheed went bankrupt, provided Lockheed with a lifeline in the form of loan guarantees. That is, it agreed to back a $1.62 billion private loan in exchange for a fee. Although the TriStar was a flop, it was enough to keep Lockheed solvent, and taxpayers earned $198 million.
Similarly, automaker Chrysler found itself in financial peril in late 1979 in part due to its slow reaction to market shifts brought about by the 1970s energy crisis. Consumers wanted more fuel efficient cars; Chrysler made too many gas guzzlers. Post-bailout studies suggested the company was headed toward insolvency.
The potential loss of 250,000 jobs and the adverse impact on automotive dealers and suppliers spurred Congress to offer Chrysler up to $4.98 billion in loan guarantees. As a precondition for this help, Chrysler, in addition to paying fees on the loans, granted the U.S. government rights to buy 14.4 million company shares at a set price. This arrangement provided taxpayers with $1.03 billion – on $4 billion worth of loans – when the government sold the shares in 1983.
And more recently, Congress pledged trillions of dollars saving the financial system in 2008. For my purposes, I split the aid to companies into four distinct bailouts, three of which made large profits.
One in particular, the much-deridedTroubled Asset Relief Program, was a $854 billion bailout for financial companies. Ultimately, $382 billion was dispersed to Wall Street firms like Citigroup, JPMorgan and AIG in exchange for preferred stock and other compensation. Taxpayers earned $32.5 billion.
A separate bailout to Fannie Mae and Freddie Mac was even more lucrative. The U.S. government received preferred stock for the $234 billion invested in the two housing giants. Taxpayers got its money back as well as $123 billion in profits.
There were also two bailouts – for the Farm Credit System in 1987 and the Steel and Oil and Gas industries in 1999 that likely made money, but I was unable to find all the details necessary to do the full analysis. At a minimum, my review suggests both broken even.
Losses (mostly) by design
Three bailouts approved by Congress since 1969 cost taxpayers’ money. In two of the cases, this was by design.
The railroad industry, from 1960 to 1970, saw its total net income cut in half due, in part, to mismanagement, market shifts in transportation from rail to vehicles and poor oversight by regulatory agencies. Its collapse not only ensured a large spike in unemployment, it meant losing a mode of transportation that, at the time, moved 41% of the nation’s goods and shipped U.S. military equipment domestically.
Congress, seeing this industry as vital to U.S. commerce and defense, wanted to ensure the railroad industry remained afloat. Beginning in 1970, several ailing railroad companies received $25.3 billion worth of loan guarantees and grants that were never meant to be repaid. Eventually, seven bankrupt rail companies were consolidated into one profit-making corporation on the taxpayers’ dime.
The terrorist attacks on 9/11 shut down the national aviation system for three days and significantly reduced airline traffic for the remainder of 2001. The airline industry, which made up close to 10% of U.S. GDP at the time, was expected to lose $5 billion by the end of 2001.
Congress quickly provided the industry with $22.1 billion in financial assistance to ensure its stability and viability. A third of this assistance came in the form of grants never meant for repayment as compensation for losses stemming from 9/11 and the three-day shutdown of the national aviation system. The remainder came in the form of loan guarantees that produced a slight profit.
And with extra money left over from the Troubled Asset Relief Program, the U.S. Treasury loaned automakers General Motors and Chrysler and their financing units about $97.2 billion in exchange for the right to purchase stock at a set price. This was in addition to a $30.5 billion loan issued in September 2008 to finance more fuel-efficient cars. While most of the aid actually disbursed was paid back, taxpayers lost $14.9 billion after both companies went bankrupt.
Coronavirus bailouts
Like the bailouts for the railroad and airline industries, a large chunk of the coronavirus aid is never meant to be paid back.
As long as small businesses keep workers on their payrolls, they won’t have to pay back the $659 billion in total assistance under the payroll protection program.
The airline industry has received $61 billion in financial assistance from Congress, including a little more than half in grants. Small passenger airlines, the bulk of applicants, will not repay this assistance, while large airlines are expected to.
Congress also authorized Treasury Secretary Steven Mnuchin to provide distressed corporations and state and local governments with up to $454 billion in loans and $17 billion for public companies deemed critical to national security. Taxpayers will get interest and possibly equity stakes in some cases.
At the end of the day, Congress knows that when literally tens of millions of jobs, millions of small businesses and dozens of vital industries are at stake, you don’t haggle over the details. You just rescue them.
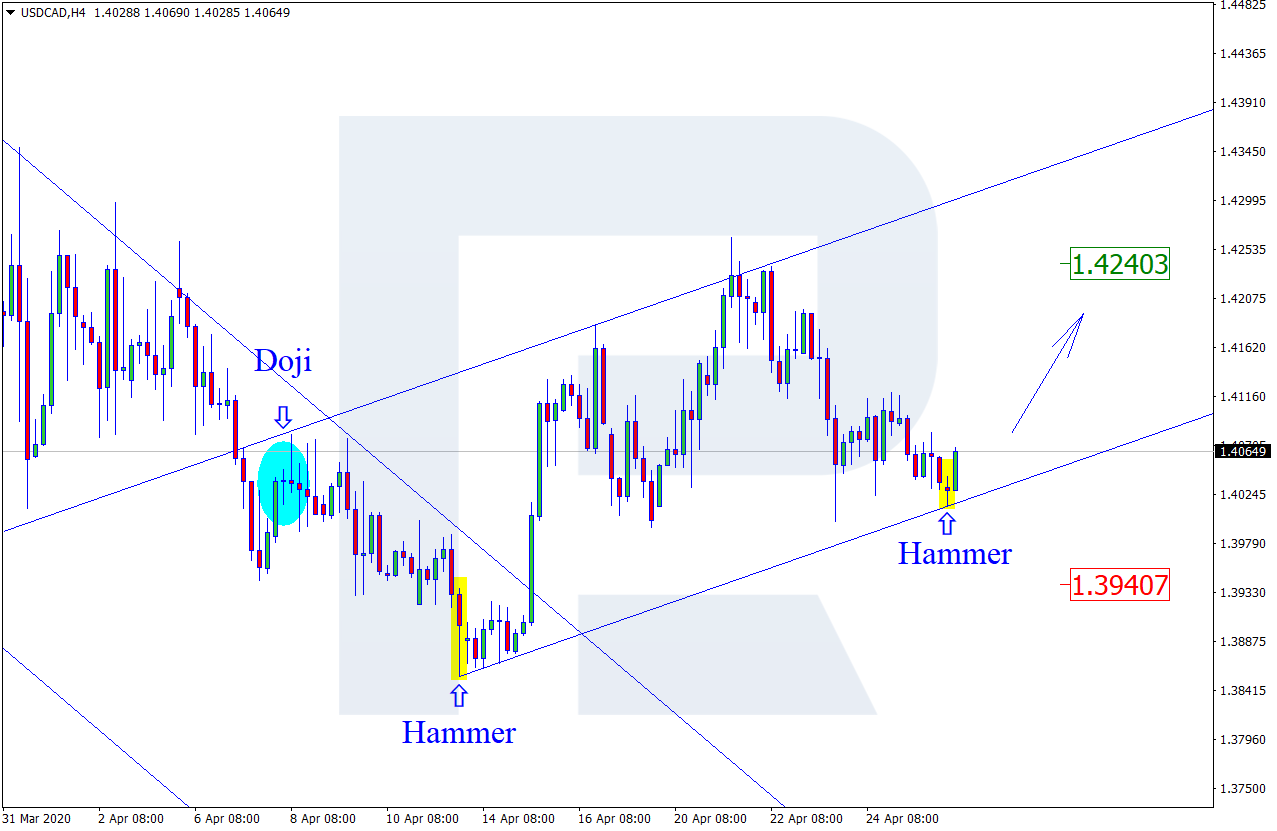
As we can see in the H4 chart, the ascending tendency continues. At the moment, after completing the pullback towards the channel’s downside border, USDCAD has formed a Hammer pattern. The upside target may be at 1.4240. At the same time, there might be another scenario, which implies that the instrument may fall towards the support level at 1.3940.
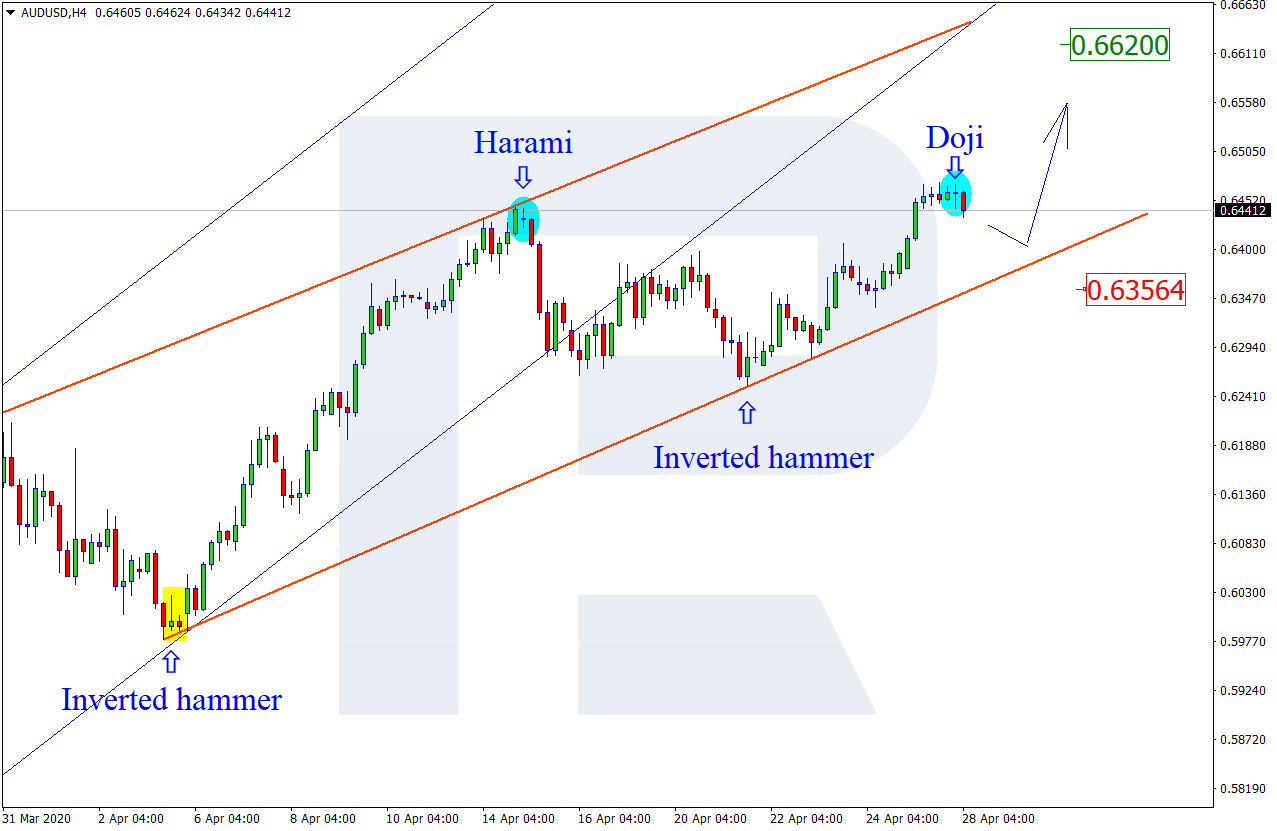
AUDUSD, “Australian Dollar vs US Dollar”
As we can see in the H4 chart, the ascending tendency continues. After completing a Doji pattern not far from the resistance level, the price is expected to reverse and start a new pullback towards the channel’s downside border. The downside target may be at 0.6356. Still, the instrument may choose an opposite scenario and continue trading upwards to test 0.6620 without reversing.
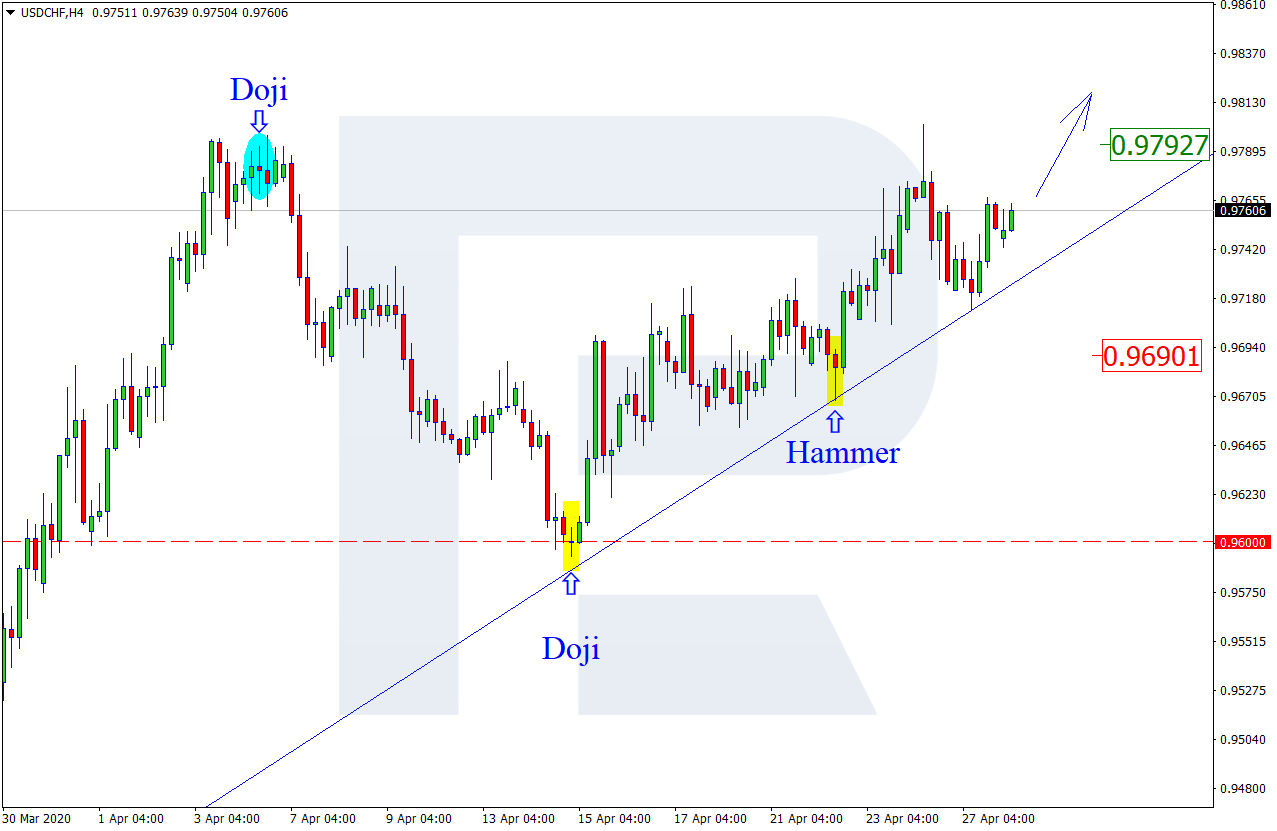
USDCHF, “US Dollar vs Swiss Franc”
As we can see in the H4 chart, the pair continues the ascending tendency. By now, USDCHF has formed several reversal patterns, such as Hammer, near the channel’s downside border. The current situation suggests that after reversing the pair may continue the ascending tendency. In this case, the upside target may be at 0.9792. However, one shouldn’t ignore another scenario, according to which the instrument may fall and return to 0.9690.
Attention! Forecasts presented in this section only reflect the author’s private opinion and should not be considered as guidance for trading. RoboForex LP bears no responsibility for trading results based on trading recommendations described in these analytical reviews.
Yesterday, the US dollar weakened against a basket of major currencies. The US dollar index (#DX) closed in the negative zone (-0.34). US President, Donald Trump, has accused China of the fact that the country could stop the coronavirus before it spreads around the world. It should be recalled that the US administration is conducting a “serious investigation” of the occurrence and spread of the virus. US Secretary of State, Mike Pompeo, says that the USA is sure that Beijing did not report the outbreak on time and hid the danger of the virus. Today, the number of victims of coronavirus has reached 3 million.
The Australian dollar has updated monthly highs, as signs of progress in restarting economies have helped the currency to recover some of its losses after sharp sales in March. Australia has managed to avoid a large number of deaths from COVID-19, and now the country is starting to ease restrictions on movement.
British Prime Minister, Boris Johnson, recovered from the coronavirus and returned to work yesterday. During his speech, the official stated his confidence that the country will be able to overcome the coronavirus, but he also emphasized that it is too early to weaken quarantine. This will happen only when the United Kingdom is convinced that there will be no second virus peak.
The “black gold” prices continue to decline. At the moment, the WTI crude oil futures are testing the mark of $11.60 per barrel. At 23:30 (GMT+3:00) weekly crude oil inventories according to the American Petroleum Institute will be published.
Market indicators
Bullish sentiments were observed yesterday in the US stock market: #SPY (+1.44%), #DIA (+1.47%), #QQQ (+0.80%).
The 10-year US government bonds yield is recovering. At the moment, the indicator is at the level of 0.66-0.67%.
The news feed on 2020.04.28:
– CB Consumer Confidence in the USA at 17:00 (GMT+3:00).
There was no love for king Dollar on Tuesday as investors became increasingly optimistic over countries across the globe easing coronavirus lockdown measures.
The noticeable jump in global sentiment and risk appetite is bad news for safe-haven assets with the Greenback likely to weaken further as market players rush to equities and emerging market currencies.
Technical traders will continue to observe how the Dollar Index behaves below 100.00. Sustained weakness under this point should open the doors towards 98.90.
USDJPY tumbles towards 106.50
Over the past 24 hours, the Japanese Yen has appreciated against every single G10 currency excluding the Swedish Krona and Norwegian Krone.
As risk-on makes a return, investors are less inclined to purchase the Dollar but the same can also be said for the Japanese Yen. Expect the Yen to weaken further this week, especially if the market mood continues to brighten.
Looking at the techicals, the USDJPY is under pressure on the daily charts. A decisive breakdown below 106.50 could open the doors towards 105.80 and possibly lower. Alternatively, if 106.50 proves to be reliable support, prices may rebound towards 108.00.
EURGBP breakout opportunity in play
Since the beginning of April 2020, the EURGBP has traded within a wide 160 pip range with support at 0.8680 and resistance at 0.8850.
Sustained weakness below 0.8770 could encourage a decline towards 0.8680 and 0.8570. Alternatively, a breakout above 0.8770 may open a path towards 0.8850.
Crude Oil depressed and unloved
US oil prices fell tumbled on Tuesday as concerns over storage capacity rekindled fears over WTI Crude descending back into negative territory.
The West Texas Intermediate contract for June delivery shed 20 per cent to a low of $10.07 a barrel in early London trading before clawing back some loses later in the afternoon. For as long as global recession fears and concerns over lack of storage capacity remain dominant themes, the path of least resistance for Oil remains south.
Commodity spotlight: Gold
Gold dropped below $1,700 on Tuesday as risk appetite made a return.
The easing of lockdown restrictions in several countries, coupled with rising stock markets exerted downside pressure on Gold. With optimism in the air over the coronavirus developments, Gold and other safe-haven assets are positioned to weaken in the short term.
Regardless of the recent dip in prices, the technical still remain positive and in favour of bulls. Should $1700 prove to be a solid support level, Gold may re-test $1735 and $1750, respectively. Alternatively, a breakdown and daily close below $1700 should open doors to $1675 and $1650.
Disclaimer: The content in this article comprises personal opinions and should not be construed as containing personal and/or other investment advice and/or an offer of and/or solicitation for any transactions in financial instruments and/or a guarantee and/or prediction of future performance. ForexTime (FXTM), its affiliates, agents, directors, officers or employees do not guarantee the accuracy, validity, timeliness or completeness, of any information or data made available and assume no liability as to any loss arising from any investment based on the same.
There is an ambiguous technical pattern on the EUR/USD currency pair. Quotes are currently consolidating. The local support and resistance levels are 1.0810-1.0835. Demand for risky assets has started resuming amid reduced restrictions in most countries of the world. Investors expect the Fed and the ECB meetings which will be held this week. The single currency is tending to grow. We recommend opening positions from key levels.
At 17:00 (GMT+3:00), CB consumer confidence index will be published.
Indicators do not give accurate signals: the price has crossed 50 MA and 100 MA.
The MACD histogram is near the 0 mark.
Stochastic Oscillator is in the neutral zone, the %K line is above the %D line, which indicates the bullish sentiment.
Trading recommendations
Support levels: 1.0810, 1.0785, 1.0755
Resistance levels: 1.0835, 1.0860, 1.0890
If the price fixes above 1.0835, the EUR/USD currency pair is expected to grow. The movement is tending to 1.0870-1.0900.
An alternative could be a decrease in the EUR/USD quotes to 1.0780-1.0750.
The GBP/USD currency pair
Technical indicators of the currency pair:
Prev Open: 1.23626
Open: 1.24281
% chg. over the last day: +0.51
Day’s range: 1.24041 – 1.24375
52 wk range: 1.1466 – 1.3516
The GBP/USD currency pair is consolidating. There is no defined trend. GBP/USD quotes are testing local support and resistance levels: 1.2400 and 1.2450, respectively. The technical pattern signals a possible growth of the trading instrument. We expect statistics from the US. We recommend opening positions from key support and resistance levels.
The news feed on the UK economy is calm.
Indicators do not give accurate signals: 50 MA has started crossing 200 MA.
The MACD histogram is rising again, which indicates the growth of the GBP/USD currency pair.
Stochastic Oscillator is in the neutral zone, the %K line is above the %D line, which also gives a signal to buy GBP/USD.
Trading recommendations
Support levels: 1.2400, 1.2370, 1.2300
Resistance levels: 1.2450, 1.2515
If the price fixes above the resistance level of 1.2450, further growth of GBP/USD quotes is expected. The movement is tending to 1.2500-1.2525.
An alternative could be a decrease in the GBP/USD currency pair to 1.2350-1.2330.
The USD/CAD currency pair
Technical indicators of the currency pair:
Prev Open: 1.40948
Open: 1.40330
% chg. over the last day: -0.56
Day’s range: 1.40138 – 1.40727
52 wk range: 1.2949 – 1.4668
The loonie is still being traded in a flat. There is no defined trend. At the moment, the local support and resistance levels are 1.4020 and 1.4070, respectively. USD/CAD quotes are tending to decline. Today, investors will assess economic reports from the US. We also recommend paying attention to the dynamics of “black gold” prices. Positions should be opened from key levels.
The news feed on Canada’s economy is calm.
Indicators do not give accurate signals: the price has crossed 50 MA.
The MACD histogram is near the 0 mark.
Stochastic Oscillator is in the neutral zone, the %K line is below the %D line, which indicates the bearish sentiment.
Trading recommendations
Support levels: 1.4020, 1.3975, 1.3925
Resistance levels: 1.4070, 1.4120, 1.4180
If the price fixes below the support level of 1.4020, USD/CAD quotes are expected to fall. The movement is tending to 1.3980-1.3960.
An alternative could be the growth of the USD/CAD currency pair to 1.4120-1.4150.
The USD/JPY currency pair
Technical indicators of the currency pair:
Prev Open: 107.543
Open: 107.243
% chg. over the last day: -0.26
Day’s range: 107.043 – 107.338
52 wk range: 101.19 – 112.41
The USD/JPY currency pair is in a sideways trend. There is no defined trend. At the moment, USD/JPY quotes are testing a round level of 107.00. The 107.35 mark is the key resistance. A trading instrument is tending to decline. Today we recommend paying attention to economic reports, as well as to the dynamics of US government bonds yield. Positions should be opened from key levels.
Indicators signal the power of sellers: the price has fixed below 50 MA and 100 MA.
The MACD histogram has started declining again, indicating the bearish sentiment.
Stochastic Oscillator is in the neutral zone, the %K line is below the %D line, which also gives a signal to sell USD/JPY.
Trading recommendations
Support levels: 107.00, 106.50
Resistance levels: 107.35, 107.60, 107.75
If the price fixes below the support level of 107.00, USD/JPY quotes are expected to fall. The movement is tending to 106.70-106.50.
An alternative could be the growth of the USD/JPY currency pair to 107.50-107.70.
Markets are mixed today as concerns over continuing fall in crude oil prices overshadow news more countries around the globe are opening their economies gradually. And as earnings season rolls on investors are gearing up for a busy week on the monetary policy front with Federal Reserve two-day meeting starting today and the European Central Bank (ECB) meeting Thursday.
Forex news
Currency Pair
Change
EUR USD
+0.15%
GBP USD
+0.32%
USD JPY
-0.2%
AUD USD
+0.22%
The Dollar weakening is intact today. The live dollar index data show the ICE US Dollar index, a measure of the dollar’s strength against a basket of six rival currencies, lost 0.2% Monday as Federal Reserve expanded its $500 billion Municipal Liquidity Facility to include debt issued by smaller cities and counties and to finance them for longer than the initial program allowed. The focus is again on the central bank as it meets today after the former Minnesota Federal Reserve President Kocherlakota said over weekend the Federal Reserve should take interest rates below zero. Both EUR/USD and GBP/USD continued climbing Monday with both pairs higher currently. AUD/USD continued climbing Friday while USD/JPY continued sliding with the Australian dollar resuming declines against the dollar.
Stock Market news
Indices
Change
Dow Jones Index
+0.91%
Nikkei Index
+3.12%
US Dollar Index
-0.17%
Futures on three main US stock indexes are edging higher currently after ending higher fourth session in a row Monday. 3M, Pfizer and IBM are among nearly a third of the companies in the SP 500 reporting quarterly results today. So far 122 constituents of the SP 500 have reported first-quarter numbers, with earnings down by 22.7% in aggregate. Stock indexes in US extended gains on Monday : the three main US stock indexes posted gains ranging from 1.1% to 1.5%. European stock indexes resumed advancing Monday but are down currently. Asian indexes are mixed, Hang Seng Index leading advancers with 0.9% gain.
Commodity Market news
Commodities
Change
Brent Crude Oil
-2.75%
WTI Crude
-14.91%
Brent is extending losses today as worldwide oil storage is dwindling rapidly. Oil prices slumped on Monday as traders deem the drop in demand due to coronavirus shutdowns was not met by a matching cut in global crude oil output. Organization of the Petroleum Exporting Countries and other major producers agreed to commence cuts equating to 9.7 million a barrel a day, about 13% of global production, on May 1 through June. US shale oil producers have been forced to cut production too as evidenced by the Baker Hughes Friday report that the number of active US rigs drilling for oil dropped by 60 to 378 last week. The US oil benchmark West Texas Intermediate (WTI) futures plunged Monday: June WTI dropped 24.6% and is falling currently. June Brent crude closed 6.8% lower at $19.99 a barrel.
Gold Market News
Metals
Change
Gold
-0.65%
Gold prices are extending losses today. June gold lost 0.7% to $1711.90 an ounce on Monday.
Note: This overview has an informative and tutorial character and is published for free. All the data, included in the overview, are received from public sources, recognized as more or less reliable. Moreover, there is no guarantee that the indicated information is full and precise. Overviews are not updated. The whole information in each overview, including opinion, indicators, charts and anything else, is provided only for familiarization purposes and is not financial advice or а recommendation. The whole text and its any part, as well as the charts cannot be considered as an offer to make a deal with any asset. IFC Markets and its employees under any circumstances are not liable for any action taken by someone else during or after reading the overview.
Preparing for the publication of economic statistics and the ECB meeting
The upward movement of this currency pair means the weakening of the Swiss franc against the euro. Market participants do not rule out that a significant increase in deposits may mean the Swiss Central Bank is inclined to take some measures to limit the further strengthening of its currency. The total amount of SNB deposits reached 650 billion Swiss francs. Let us recall that on April 23, EURCHF came close to the minimum again since July 2015. Changes in the SNB rate (-0.75%) are not yet expected. It is much lower than the ECB’s rate (0%). Note that the next meeting of the European regulator will take place on 30 April. Eurozone GDP data for the 1st quarter of 2020 and the preliminary inflation for April will be published at the same time. All this can support the euro. This week, KOF retail sales and indicators of business activity will come out in Switzerland.