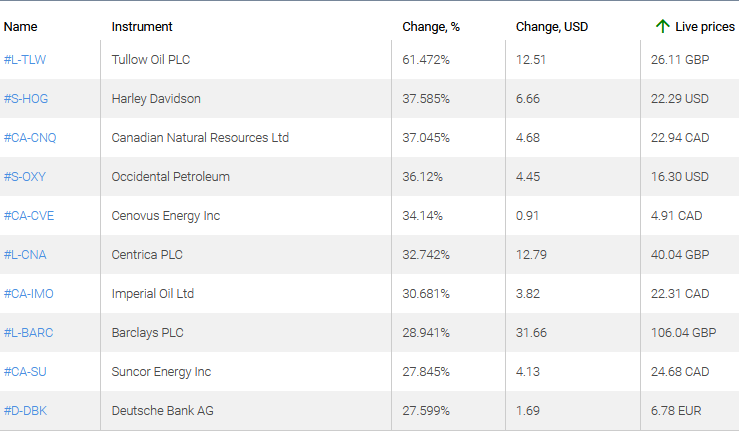
Oil quotes stabilized in the world market. Starting May 1, OPEC countries will limit оил production by 10 million barrels per day. Almost immediately after that, the United States and Canada are going to consider joining this restriction. A number of countries have eased quarantine requirements. All this contributed to a slight increase in oil demand. Accordingly, the currencies of commodity countries, such as the Russian ruble, the Australian and New Zealand dollars, the South African rand, strengthened, as well as the stocks of oil companies.
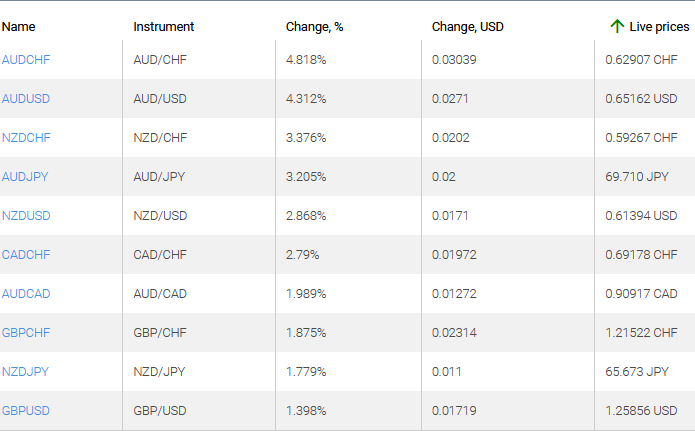
1. AUDCHF, AUDUSD – the growth of these charts means the strengthening of the Australian dollar against the American dollar and the Swiss franc.
2. NZDCHF, AUDJPY – the growth of these charts means the weakening of the Swiss franc against the New Zealand dollar and the Japanese yen against the Australian dollar.
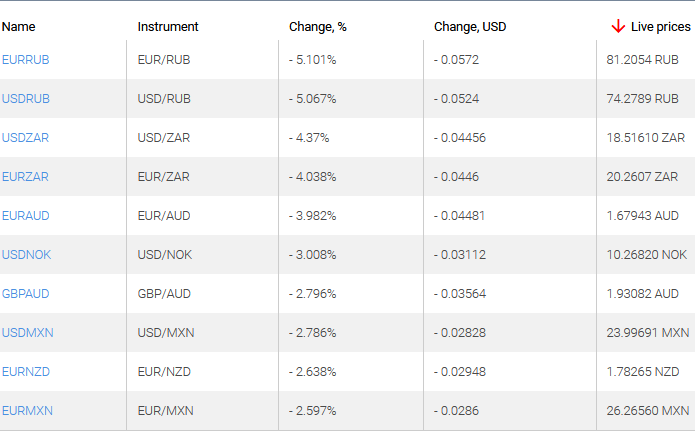
Top Losers – Foreign Exchange Market (Forex)
1. USDRUB, EURRUB – the drop of these charts means the strengthening of the Russian ruble against the US dollar and the euro.
2. USDZAR, EURZAR – the drop of these charts means the weakening of the US dollar and the euro against the South African rand.
Note: This overview has an informative and tutorial character and is published for free. All the data, included in the overview, are received from public sources, recognized as more or less reliable. Moreover, there is no guarantee that the indicated information is full and precise. Overviews are not updated. The whole information in each overview, including opinion, indicators, charts and anything else, is provided only for familiarization purposes and is not financial advice or а recommendation. The whole text and its any part, as well as the charts cannot be considered as an offer to make a deal with any asset. IFC Markets and its employees under any circumstances are not liable for any action taken by someone else during or after reading the overview.
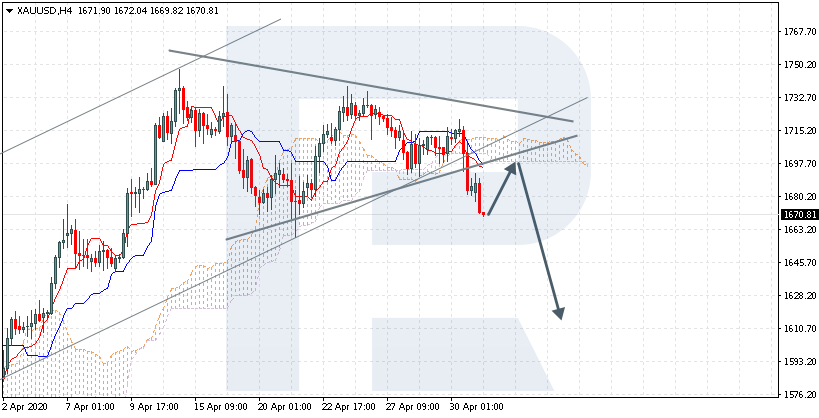
XAUUSD is trading at 1670.00; the instrument is moving below Ichimoku Cloud, thus indicating a bearish tendency. The markets could indicate that the price may test the cloud’s downside border at 1697.00 and then resume moving downwards to reach 1610.00. Another signal to confirm further descending movement is the price’s rebounding from the downside border of the Triangle pattern. However, the scenario that implies further decline may be canceled if the price breaks the cloud’s upside border and fixes above 1720.00. In this case, the pair may continue growing towards 1765.00.
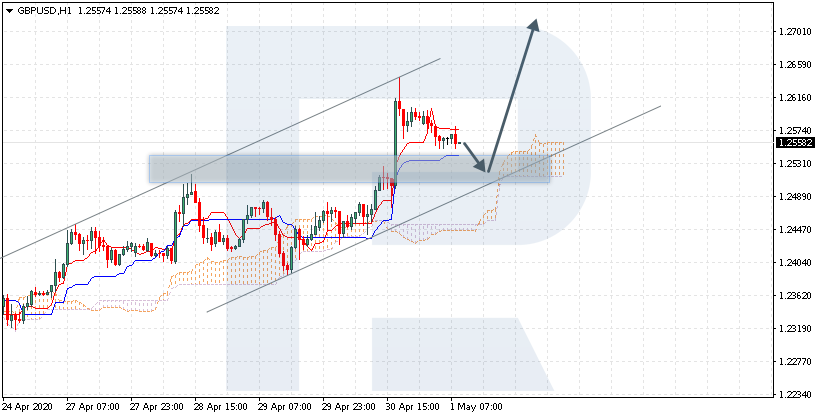
GBPUSD, “Great Britain Pound vs US Dollar”
GBPUSD is trading at 1.2558; the instrument is moving above Ichimoku Cloud, thus indicating a bullish tendency. The markets could indicate that the price may test the cloud’s upside border at 1.2530 and then resume moving upwards to reach 1.2705. Another signal in favor of further ascending movement is the price’s rebounding from the rising channel’s downside border. However, the scenario that implies further growth may no longer be valid if the price breaks the cloud’s downside border and fixes below 1.2425. In this case, the pair may continue falling towards 1.2335.
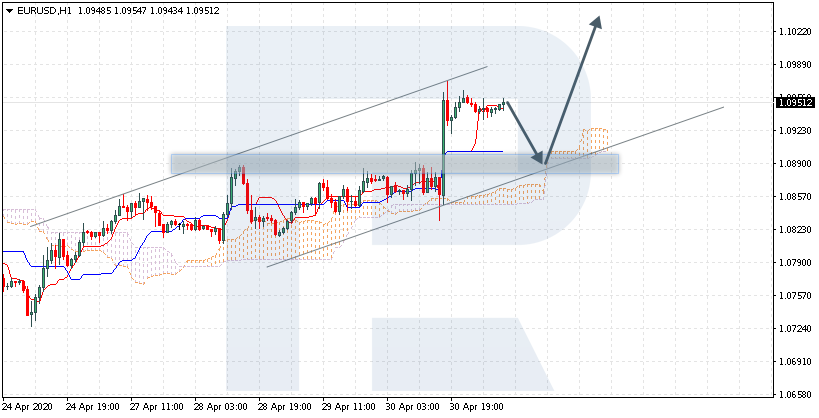
EURUSD, “Euro vs US Dollar”
EURUSD is trading at 1.0951; the instrument is moving above Ichimoku Cloud, thus indicating a bullish tendency. The markets could indicate that the price may test the cloud’s upside border at 1.0890 and then resume moving upwards to reach 1.1025. Another signal to confirm further ascending movement is the price’s rebounding from the rising channel’s downside border. However, the scenario that implies further growth may be canceled if the price breaks the cloud’s downside border and fixes below 1.0825. In this case, the pair may continue falling towards 1.0745.
Attention! Forecasts presented in this section only reflect the author’s private opinion and should not be considered as guidance for trading. RoboForex LP bears no responsibility for trading results based on trading recommendations described in these analytical reviews.
United Kingdom’s Manufacturing PMI was revised lower in April from a preliminary estimate: Markit revised its Manufacturing PMI to 32.6 in April 2020 from a preliminary estimate of 32.9. This is bearish for GBPUSD.
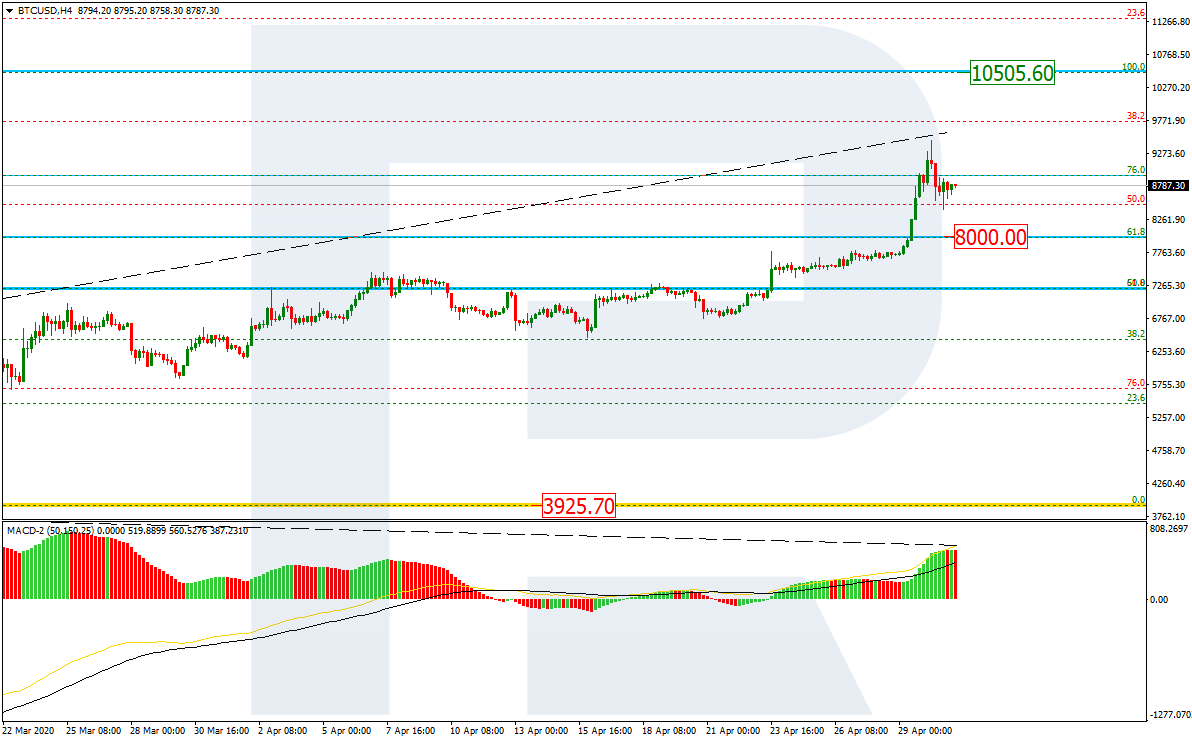
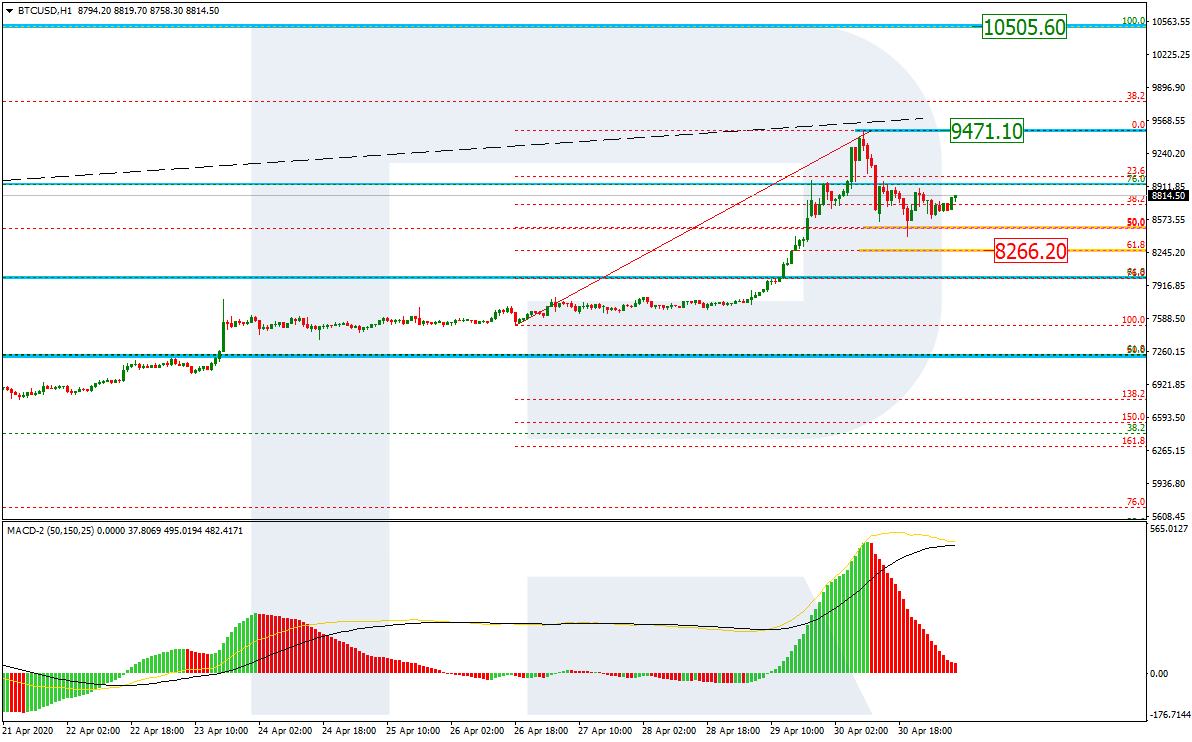
As we can see in the H4 chart, the asset is forming a stable rising tendency and has already reached 76.0% fibo. At the same time, the MACD indicator is forming a divergence, which hints at possible reversal or a pullback. The support is 61.8% fibo at 8000.00. A breakout of this level will be another signal in favor of the trend reversal. However, if the current tendency continues, the next rising impulse may be heading towards the fractal resistance at 10505.60.
In the H1 chart, the descending impulse has reached 50.0% fibo and may yet continue towards 61.8% fibo at 8266.20. If the pair continues moving upwards, the next short-term target will be the high at 9471.10.
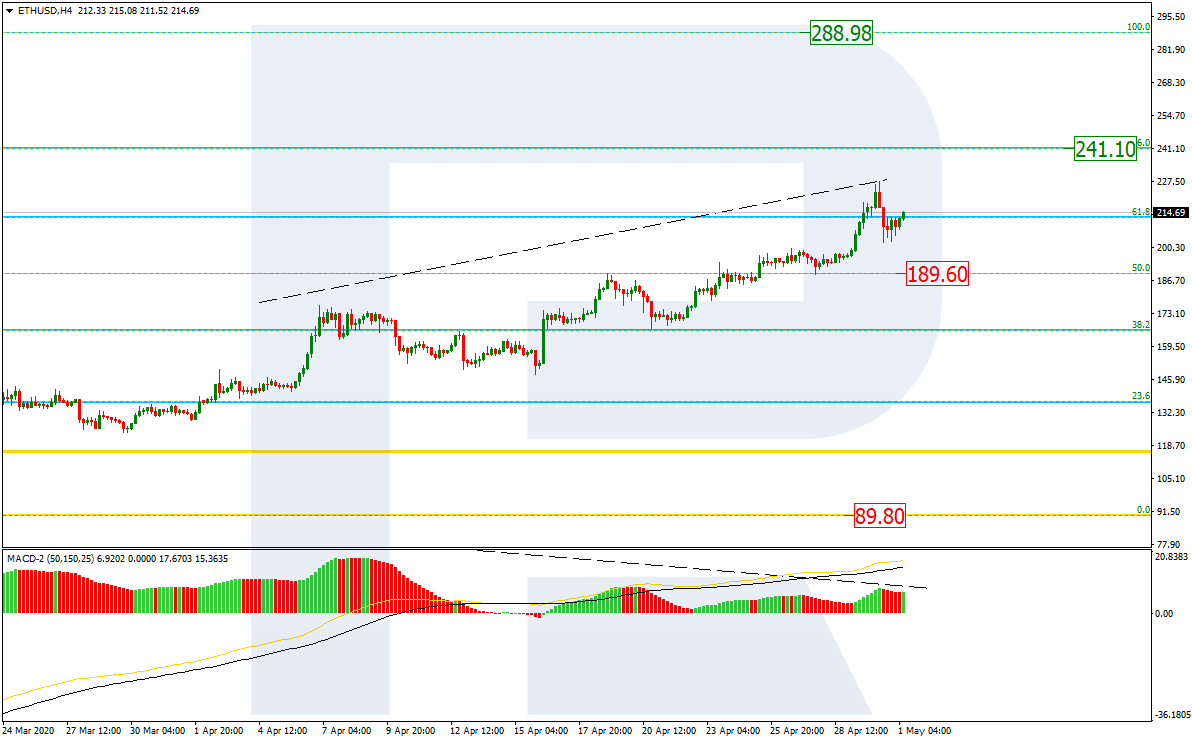
ETHUSD, “Ethereum vs. US Dollar”
As we can see in the H4 chart, after breaking the previous high, another rising impulse has reached 61.8% fibo. The next upside target is 76.0% fibo at 241.10. However, considering the divergence on MACD, the pair may reverse soon. The support is 50.0% fibo at 189.60. A breakout of this level will be the key signal in favor of the trend reversal.
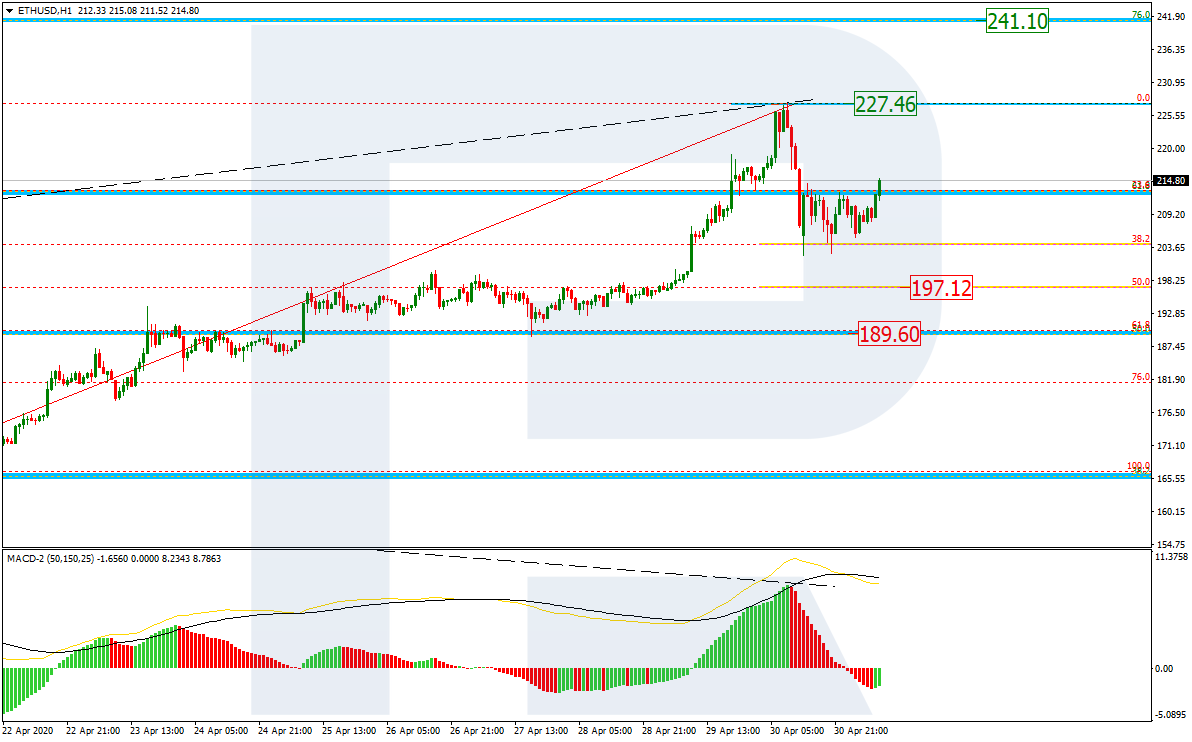
In the H1 chart, the price is correcting downwards to reach 38.2% fibo and may later form a new descending impulse towards 50.0% fibo at 197.12. Still, the target of the next rising impulse will be the high at 227.46.
Attention! Forecasts presented in this section only reflect the author’s private opinion and should not be considered as guidance for trading. RoboForex LP bears no responsibility for trading results based on trading recommendations described in these analytical reviews.
Current technical setup is bullish for cocoa after a steep decline in a period of one month. Cocoa price fell over 27% below the February high to a low of $2189 per ton in mid-March. It is rebounding currently but a few factors related to coronavirus shutdowns weigh on it. Many companies in cocoa and chocolate industry are shutting down production lines to protect employees and manage significant business disruptions in their supply chains as they face financial uncertainty and economic risks, according to World Cocoa Foundation. This is a downside risk for cocoa demand. However the infection can have a negative impact on cocoa supply as cocoa beans inventories could accumulate with processing plants reducing or stopping production. This is an upside risk for cocoa.
– This portion of our continued research into the Covid-19 virus event, one of the greatest disruptions to the global economy over the past 50+ years, concludes in this article. In Part I of this article, we highlighted how price factors and economic data continue to suggest the US and the global stock market will likely attempt to retest recent lows or fall further, as the extent of the virus event continues to play out. In this second portion, we’ll highlight some of this data and present the opposite aspect of the technical/data-driven research we’ve been providing to you.
Recently, something very important has happened in the US stock market – a breakout of sorts. The weakness we expected to see last week prior to the new $500 billion in new stimulus appeared to end this past week. Not only have the markets opened a bit higher this week, but they have continued to push higher over the past 3+ days. From a technical standpoint, as long as the support channels and current trends do not falter, the US stock market may continue to push higher before breaking this uptrend.
Before we continue, be sure to opt-in to our free market trend signals before closing this page, so you don’t miss our next special report!
NASDAQ 100 Daily Chart
This NASDAQ 100 Daily chart highlights the upside price trend that originated a bottom just as the US Fed initiated a massive stimulus program. Weakness in the market, from a technical perspective, is still the overall trend because of the move away from the February highs. At this point, even if the markets continue to rally, we would need to see a substantially higher price move to establish a new bullish trend. Yet, as long as price stays above the RSI price channel and the relatively low price channel on this chart, the upside potential is higher than the downside price trend we have been predicting.
SPY Daily Chart
This SPY Daily chart highlights the same type of setup. We can easily see the minor rotation in price last week which prompted us to issue a warning that price may be turning lower near key Fibonacci levels. Yet, early this week stock prices pushed higher – even as far weaker global economic data was published. As long as this upward trend holds, price should continue to move higher. If it breaks below these price channels we’ve highlighted on this chart – look out below.
At this point, it appears the market is more about a battle between the US Fed and the global central bankers dumping capital into the market to prevent a greater price collapse vs. the data that is starting to support a global economic collapse that may be bigger than the 2008-09 credit crisis. Currently, it appears global traders and investors are banking on the central bank’s capacity to pour capital into the markets to suppress risks that appear to be growing.
The next series of charts highlight the US economic data as we are just entering a reporting period that reflects the contraction in the US and global economies. Pay attention to this data and the scope of the collapse compared to the 2008-09 crisis event.
Redbook Retail Sales Index (WoW)
This first chart is the Redbook Retail sales index (WoW) data. The collapse this week and last is far greater than the lowest levels in 2008~09.
This next chart is the Richmond Manufacturing Index – again, the newest data is near twice as deep as the 2008-09 credit crisis levels at their deepest levels. Remember, we are just starting to see the data from the Covid-19 virus event.
This next chart is the US Quarterly GDP data. The -4.8% level is deep, but still a bit away from the -6.3% level that happened in the 2008-09 credit crisis. Yet, we believe the Q2 GDP data could offer a number below -8~10%.
This Pending Home Sales chart confirms a very broad contraction in home buying activity. In the midst of the 2008-09 crisis, this data printed a -29.9% data point in July 2010 – well after the bottom in the markets had completed. We believe the next few months will present even deeper sales data.
Real consumer spending has collapsed. Consumer engagement makes up a large portion of all global GDP numbers. As long as consumers stay away from normal activities, the global GDP levels will continue to contract.
From a technical standpoint, at this point, as long as price continues to track within the upward sloping price trend, the bullish trend may continue for a bit longer. Once price breaks below this channel though, look out below.
Our longer-term price modeling systems continue to suggest price is still in a Bearish price trend and this move is a bullish price recovery in a bearish price trend. Time will tell if the markets have enough resilience to push higher even further. We believe the data is pointing to a very real potential for a new bearish price trend to emerge.
As a technical analyst and trader since 1997, I have been through a few bull/bear market cycles in stocks and commodities. I believe I have a good pulse on the market and timing key turning points for investing and short-term swing traders. 2020 is an incredible year for traders and investors. Don’t miss all the incredible trends and trade setups.
Subscribers of my Active Swing Trading Newsletter had our trading accounts close at a new high watermark. We not only exited the equities market as it started to roll over in February, but we profited from the sell-off in a very controlled way with TLT bonds for a 20% gain. This week we closed out SPY ETF trade taking advantage of this bounce and entered a new trade with our account is at another all-time high value.
Ride my coattails as I navigate these financial markets and build wealth while others watch most of their retirement funds drop 35-65% during the next financial crisis.
Just think of this for a minute. While most of us have active trading accounts, what is even more important are our long-term investment and retirement accounts. Why? Because they are, in most cases, our largest store of wealth other than our homes, and if they are not protected during the next bear market, you could lose 25-50% or more of your net worth. The good news is we can preserve and even grow our long term capital when things get ugly like they are now and ill show you how and one of the best trades is one your financial advisor will never let you do because they do not make money from the trade/position.
If you have any type of retirement account and are looking for signals when to own equities, bonds, or cash, be sure to become a member of my Passive Long-Term Investing Signals which we issued a new signal for subscribers.
OPEC+ will begin lowering its production levels starting today, which is enabling Crude Oil to climb back above the $20/bbl psychological level and trade around its highest levels since April 21, while Brent is edging closer towards $30/bbl. Although the announced 10 million barrels per day (bpd) reduction is far higher than the actual net reduction from Q1 output levels (estimated 4 million bpd), Oil markets are also drawing hope that more of the global economy can reopen and raise demand for the commodity.
China’s reopening has already gained traction, while some US states begun the process a few days ago. The likes of Germany and France are set to follow suit in the coming weeks. The easing of lockdown measures in these major economies have lent themselves to nascent signs that the demand destruction has bottomed out, with last week’s 549k bpd jump in US gasoline demand also adding to Crude’s tailwinds.
However these are still early days. With storage space still tremendously scarce, especially in the US, that could put a cap on Crude Oil’s upside until the supply-demand equation can show meaningful signs of reaching a sustainable equilibrium in the current global economic climate.
The risk of a second wave of coronavirus cases worldwide also remains on the table. Should such an event trigger another round of lockdowns across major economies, that could see Oil prices capitulate once more.
Dollar starts off May on stable note ahead of US April manufacturing data
The Dollar index (DXY) has found support at the 99 handle, and is expected to continue trading within the 98.5 – 101 range for the time being, as the Federal Reserve works in tandem with central banks around the world ensure Dollar-funding operations remain stable.
The risk off tone in the global markets on Friday is also helping to shore up demand for the Greenback. The US Dollar is now stronger against most G10, barring safe havens such as the Japanese Yen and the Swiss Franc. Although most Asian and European markets are closed due to Labour Day, Australian and Japanese stocks are currently in the red, while US futures also point to declines when equity markets kick off the first trading day of the month.
Investors will be monitoring the Markit and ISM manufacturing data for April due later today, as they refine their Q2 outlooks for the US economy, with the GDP print for this quarter set to post a double-digit contraction. Although Fed chair Jerome Powell this week affirmed that the US central bank will remain accomodative in supporting the US economy, it remains to be seen how much the emergency measures can offset the economic carnage left in the wake of Covid-19. After all, over 30 million Americans have already filed for jobless claims over the past six weeks, and the ramifications from the lost consumption prowess will be felt in the world’s largest economy for some time yet.
As long as the US economic deterioration does not outpace the rest of the world, that should keep demand for Greenback fairly resolute.
Disclaimer: The content in this article comprises personal opinions and should not be construed as containing personal and/or other investment advice and/or an offer of and/or solicitation for any transactions in financial instruments and/or a guarantee and/or prediction of future performance. ForexTime (FXTM), its affiliates, agents, directors, officers or employees do not guarantee the accuracy, validity, timeliness or completeness, of any information or data made available and assume no liability as to any loss arising from any investment based on the same.
Global equities are down today after a selloff Thursday amid mixed corporate results as European economies recorded sharp contractions too while US Labor department report showed over 30 million Americans have lost their jobs in the last six weeks.
Forex news
Currency Pair
Change
EUR USD
+0.25%
GBP USD
+0.19%
USD JPY
-0.31%
AUD USD
-0.74%
The Dollar weakening continues today. The live dollar index data show the ICE US Dollar index, a measure of the dollar’s strength against a basket of six rival currencies, fell another 0.5% Thursday after report initial jobless claims jumped another 3.8 million last week while disposable income fell 2% in March as workers received less compensation. Both GBP/USD and EUR/USD accelerated climbing yesterday with both higher currently. Euro strengthened despite European Central Bank announced further easing of conditions for its existing targeted long-term refinancing operations and introduced a new program of non-targeted pandemic emergency longer-term refinancing. Both USD/JPY joined AUD/USD’s continued sliding.
Stock Market news
Indices
Change
Dow Jones Index
-1.04%
Nikkei Index
+1.3%
Australian Stock Index
-2.96%
US Dollar Index
-0.11%
Futures on three main US stock indexes are lower currently after a pullback Thursday following reports the Trump administration was considering using tariffs against China for its handling of the coronavirus. Earnings season continues with another batch of companies including ExxonMobil, Chevron and Phillips 66 reporting quarterly results today. Stock indexes in US ended down on Thursday but posted spectacular gains for the month: the three main US stock indexes recorded daily losses ranging from 0.3% to 1.2% while booking monthly gains ranging from 11.1% to 15.5%. House speaker said states, cities seeked additional $1 trillion in next aid bill to avoid layoffs. European stock indexes ended sharply lower Thursday as Eurozone first-quarter GDP fell an annualized 14.4% compared with the US annualized decline of 4.8%, and are down currently. Asian indexes are lower today with most markets closed for holiday : Australia’s All Ordinaries Index sank 5% while NIKKEI slumped 2.8%.
Commodity Market news
Commodities
Change
Brent Crude Oil
-2.39%
WTI Crude
-0.7%
Brent is pulling back today after rebound on Thursday. Oil prices rose despite Energy Information Administration report that US crude inventories rose 9 million barrels last week. Th US oil benchmark West Texas Intermediate (WTI) futures rallied yesterday: June WTI jumped 25.1% but is edging lower currently. July Brent crude closed 9.3% higher at $26.48 a barrel on Thursday.
Gold Market News
Metals
Change
Gold
-0.85%
Gold prices pullback is intact today. June gold lost 1.1% to $1694.20 an ounce on Thursday.
Note: This overview has an informative and tutorial character and is published for free. All the data, included in the overview, are received from public sources, recognized as more or less reliable. Moreover, there is no guarantee that the indicated information is full and precise. Overviews are not updated. The whole information in each overview, including opinion, indicators, charts and anything else, is provided only for familiarization purposes and is not financial advice or а recommendation. The whole text and its any part, as well as the charts cannot be considered as an offer to make a deal with any asset. IFC Markets and its employees under any circumstances are not liable for any action taken by someone else during or after reading the overview.
Money manager Adrian Day reviews an exploration company that he rates a “strong buy.”
Lara Exploration Ltd. (LRA:TSX.V, 0.54) is a diversified prospect generator, mostly with copper and copper-gold projects in Brazil and Peru. It aims to generate royalties from properties it generators, whether by staking or in some cases acquiring.
Its main assets include a 30% free-carried interest, plus royalty, on the Planalto copper-gold project in Northern Brazil, into which Capstone is earning; last week, drilling at the property saw new mineralization to the west and northwest of the existing zone, extending the footprint, as well as a hole to the east in a new area, that also hit.
It also has a 2% royalty at Corina, a gold project in Peru, which Hochschild is buying through staged payments. Hochschild is awaiting permits to follow up with promising results from earlier drilling. Although earlier stage, the property is adjacent to an existing operation of Hochschild, where the mill has excess capacity, so mining at Corina could be permitted quickly and the ore processed cheaply.
Cash-flow ahead
In the near term is the royalty and 5% ownership Lara holds on a copper project in Brazil, called Celesta. Because of a missed deadline to be in production, Lara is now receiving monthly payments of $100,000, with production and royalty payments expected now in the 3rd quarter. This will provide Lara with payments of around C$750,000 per year, enough to cover most of its overhead.
In addition, Lara has over 20 projects, about half of which are 100% owned, ready for partners. Some are very promising with active interest from potential partners. The recent lockdowns and travel restrictions have slowed the advance of these potential joint ventures, but once things open up globally, we expect at least a few of these to get out of the door.
Disputed property has enormous value
And more uncertain, but potentially most valuable, is Laras 49% interest in the Liberdade copper project in Brazil, a joint venture with the Chilean state copper company Codelco,
which is currently before the Brazilian courts after Vale disputed ownership. Suffice to say, the value of this asset is not in Lara’s share price at all at present; a win would mean a value to Lara equal to its entire market cap today. Even without this, however, Lara is quite undervalued and has enormous potential.
A strong cash position with disciplined management
With around C$2 million in cash, an expected $2.2 million of payments this year, and an all-in budget of around C$2 million, Lara is in a strong financial position. Its management is very disciplined and quite frugal and has demonstrated the ability to reduce its burn rate when necessary. With top management that has achieved success before (Reservoir Minerals), a strong balance sheet, near-term cash flow, two partner-paid drill programs this year, and several high potential assets, Lara is a very solid exploration company. At the current share price, its a very strong buy for patient investors.
Adrian Day, London-born and a graduate of the London School of Economics, heads the money management firm Adrian Day Asset Management, where he manages discretionary accounts in both global and resource areas. Day is also sub-adviser to the EuroPacific Gold Fund (EPGFX). His latest book is “Investing in Resources: How to Profit from the Outsized Potential and Avoid the Risks.”
Disclosure: 1) Adrian Day: I, or members of my immediate household or family, own securities of the following companies mentioned in this article: Lara Exploration and Altius Minerals. I personally am, or members of my immediate household or family are, paid by the following companies mentioned in this article: None. My company has a financial relationship with the following companies mentioned in this article: None. Funds controlled by Adrian Day Asset Management hold shares of the following companies mentioned in this article: Lara Exploration, Altius Minerals, Fortuna Silver and Kingsmen Creatives. I determined which companies would be included in this article based on my research and understanding of the sector. 2) The following companies mentioned in this article are billboard sponsors of Streetwise Reports: None. Click here for important disclosures about sponsor fees. The information provided above is for informational purposes only and is not a recommendation to buy or sell any security. 3) Statements and opinions expressed are the opinions of the author and not of Streetwise Reports or its officers. The author is wholly responsible for the validity of the statements. The author was not paid by Streetwise Reports for this article. Streetwise Reports was not paid by the author to publish or syndicate this article. Streetwise Reports requires contributing authors to disclose any shareholdings in, or economic relationships with, companies that they write about. Streetwise Reports relies upon the authors to accurately provide this information and Streetwise Reports has no means of verifying its accuracy. 4) This article does not constitute investment advice. Each reader is encouraged to consult with his or her individual financial professional and any action a reader takes as a result of information presented here is his or her own responsibility. By opening this page, each reader accepts and agrees to Streetwise Reports’ terms of use and full legal disclaimer. This article is not a solicitation for investment. Streetwise Reports does not render general or specific investment advice and the information on Streetwise Reports should not be considered a recommendation to buy or sell any security. Streetwise Reports does not endorse or recommend the business, products, services or securities of any company mentioned on Streetwise Reports. 5) From time to time, Streetwise Reports and its directors, officers, employees or members of their families, as well as persons interviewed for articles and interviews on the site, may have a long or short position in securities mentioned. Directors, officers, employees or members of their immediate families are prohibited from making purchases and/or sales of those securities in the open market or otherwise from the time of the interview or the decision to write an article until three business days after the publication of the interview or article. The foregoing prohibition does not apply to articles that in substance only restate previously published company releases. As of the date of this article, officers and/or employees of Streetwise Reports LLC (including members of their household) own securities of Lara Exploration and Altius Minerals, companies mentioned in this article.
I’ve been trading the markets since 1997, and I’ve never seen anything like what is happening right now. Sure, I’ve seen numerous market events where risks appeared to be excessive, and there were incredible opportunities, but nothing compares to what is happening right now.
My research team has poured through months of data and run our advanced predictive modeling systems. The alignment of major super-cycles, minor cycles, global economic credit expansion, and the COVID-19 virus event, has created a once-in-a-lifetime for traders/investors using our market research and trade signals.
The US Federal Reserve and many global central banks continue to take massive stimulus actions to support the world’s economies while the COVID-19 virus event plays out. The timing of these central bank actions could not have been timed any better, in our opinion, yet we believe the fallout from the global economic collapse is very far-reaching and may last many months or years. Many skilled traders, investors, and analysts have failed to see the bigger picture and how the world may transition from pre virus to a new post virus economic world.
The major and minor super-cycles are a big part of our research and expectations. Far too many people simply don’t know about these cycles and what they mean for future market trends. If they did know about these massive cycle events, their expectations would be completely different than they are now.
A massive super-cycle event is currently taking place that may not end until 2030~35. Minor cycle events have aligned with this super-cycle event that will prompt massive price swings over the next 15+ years. When these cycle events end, another huge market trend will emerge that will be one of the biggest events to happen over the last century.
Right now is when you want to start preparing for these events and these super-cycles. This is truly a once-in-a-life event if you understand what is really happening to the global markets. The opportunities for you and your family are incredible – if you know how to play these cycle events. If you don’t, then you will likely experience extreme difficulty in navigating the next 15+ years successfully.
Please visit TheTechnicalTraders.com to learn more about myself and my team of researchers. We are attempting to help you create massive opportunities from these major cycle/economic events and to help you preserve and protect your wealth.