The US/China trade war has largely faded from people’s focus over recent months. Following the signing of the phase one trade deal back in January and the subsequent outbreak of COVID-19, focus has shifted away from the trade negotiations. The virus has devastated the global economy and called for response from all governments.
However, that could change over the coming months as focus begins to shift away from the COVID-19 crisis and back towards the broader fundamental backdrop.
US/China Tensions Deteriorating Again
There are now fresh concerns of a relapse in relations between the US and China as a result of the COVID-19 crisis. Trump began by blaming China at the outset of the virus. He then moderated his tone and reportedly called a truce with Xi-Jinping. This was to allow the US and China to work together to combat the virus.
In recent weeks, however, the mood has soured. Following accusations that the WHO colluded with China in a coverup regarding the outbreak of the virus, Trump pulled US funding for the WHO.
Since then, he has returned to publicly blaming China for the outbreak of the virus. Last week, Trump even went as far as telling reporters he had seen footage that proved the virus was created in a Chinese lab.
This message was corroborated by Secretary of State Mike Pompeo. He told reporters there was “significant” and even “enormous” evidence that the virus was created in a lab. He said that China’s attempt to downplay the outbreak of the virus initially was a “classic Communist disinformation effort that created enormous risk”.
Trump Threatening Financial Action Against China
In light of these allegations, Trump is now threatening action against China. He has said that the US could seek up to $1 trillion in reparations from the world’s second-largest economy over its handling of the virus. US growth has plummeted by 4.8% over Q1.
Trump Leveraging Anti-China Sentiment For Election Campaign?
With Trump dialing up the rhetoric, the likelihood of current trade negotiations collapsing, and the two leading economies returning to a state of trading tit-for-tat trade tariffs raises even further risks for the global economy.
The key now will be whether Trump actually pursues taking action on China. Given the sentiment on the ground, this could prove to be a successful rallying cry for his election campaign. However, it could prove costly if relations with China break down again and the trade war heats up once more.
USDCNH Approaching Key Resistance
USDCNH continued to rally here with price turning higher again following the test of the 7.0566 level which held as support. While price continues moving higher here a further test of the 7.1654 2020 highs looks likely. This level, if broken, will put focus on a test of the 7.1955 all-time highs next.
However, the rising wedge formation raises potential reversal risks. Keep an eye on RSI for any divergence as we test these levels.
The EUR/USD currency pair has become stable after a sharp increase at the end of last week. The trading instrument has set new local highs. Washington is considering imposing new sanctions against Beijing, finding it guilty of the COVID-19 epidemic. The number of coronavirus infected in the world exceeded 3.5 million. At the moment, EUR/USD quotes are consolidating in the range of 1.0925-1.0970. The single currency has the potential for further growth. Positions should be opened from key levels.
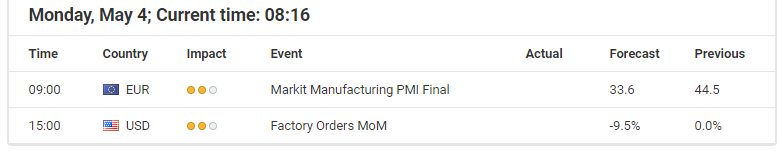
The Economic News Feed for 04.05.2020
At 10:55 (GMT+3:00), German manufacturing PMI will be published.
Indicators do not give accurate signals: the price has crossed 50 MA.
The MACD histogram has started declining, indicating the development of the correction movement.
Stochastic Oscillator is in the neutral zone, the %K line is above the %D line, which gives a signal to buy EUR/USD.
Trading recommendations
Support levels: 1.0925, 1.0890, 1.0845
Resistance levels: 1.0970, 1.1015
If the price fixes above the level of 1.0970, further growth of the EUR/USD currency pair is expected. The movement is tending to 1.1015-1.1040.
An alternative could be a decrease in the EUR/USD quotes to 1.0890-1.0860.
The GBP/USD currency pair
Technical indicators of the currency pair:
Prev Open: 1.25838
Open: 1.24823
% chg. over the last day: -0.71
Day’s range: 1.24242 – 1.24855
52 wk range: 1.1466 – 1.3516
GBP/USD quotes have been declining. The British pound has updated local lows. The demand for risky assets has weakened. At the moment, the GBP/USD currency pair is consolidating. The local support and resistance levels are 1.2425 and 1.2485, respectively. Financial market participants expect additional drivers. A trading instrument has the potential for further decline. We recommend opening positions from key support and resistance levels.
The news feed on the UK economy is calm.
Indicators do not give accurate signals: the price has fixed between 50 MA and 100 MA.
The MACD histogram is in the negative zone, indicating the bearish sentiment.
Stochastic Oscillator is in the neutral zone, the %K line has crossed the %D line. There are no signals at the moment.
Trading recommendations
Support levels: 1.2425, 1.2385, 1.2315
Resistance levels: 1.2485, 1.2515, 1.2570
If the price fixes below the support level of 1.2425, a further drop in GBP/USD quotes is expected. The movement is tending to 1.2380-1.2350.
An alternative could be the growth of the GBP/USD currency pair to 1.2530-1.2560.
The USD/CAD currency pair
Technical indicators of the currency pair:
Prev Open: 1.39385
Open: 1.40828
% chg. over the last day: +1.01
Day’s range: 1.40775 – 1.41524
52 wk range: 1.2949 – 1.4668
The bullish sentiment prevails on the USD/CAD currency pair. The trading instrument has set new local highs. The loonie is currently consolidating in the range of 1.4075-1.4150. The demand for risky assets is still low. The Canadian dollar has the potential for further decline against the greenback. We recommend paying attention to the dynamics of oil quotes. Positions should be opened from key levels.
The news feed on Canada’s economy is calm.
Indicators signal the power of buyers: the price has fixed above 100 MA.
The MACD histogram is in the positive zone, but below the signal line, which gives a weak signal to buy USD/CAD.
Stochastic Oscillator is in the neutral zone, the %K line has crossed the %D line. There are no signals at the moment.
Trading recommendations
Support levels: 1.4075, 1.4005, 1.3960
Resistance levels: 1.4150, 1.4200, 1.4255
If the price fixes above the resistance level of 1.4150, further growth of the USD/CAD quotes is expected. The movement is tending to 1.4200-1.4230.
An alternative could be a decrease in the USD/CAD currency pair to 1.4050-1.4010.
The USD/JPY currency pair
Technical indicators of the currency pair:
Prev Open: 107.118
Open: 106.800
% chg. over the last day: -0.22
Day’s range: 106.670 – 106.943
52 wk range: 101.19 – 112.41
There is an ambiguous technical pattern on the USD/JPY currency pair. Quotes are in a sideways trend. There is no defined trend. The trading instrument is testing local support and resistance levels: 106.65 and 106.95, respectively. The USD/JPY currency pair is tending to decline. We recommend paying attention to the dynamics of US government bonds yield. Positions should be opened from key levels.
Indicators do not give accurate signals: the price has crossed 50 MA.
The MACD histogram is in the negative zone, but above the signal line, which gives a weak signal to sell USD/JPY.
Stochastic Oscillator is in the neutral zone, the %K line is above the %D line, which indicates the bullish sentiment.
Trading recommendations
Support levels: 106.65, 106.40
Resistance levels: 106.95, 107.35, 107.60
If the price fixes below 106.65, USD/JPY quotes are expected to fall. The movement is tending to 106.40-106.20.
An alternative could be the growth of the USD/JPY currency pair to 107.20-107.40.
After German DAX30 saw a short stint back above 11,000 points, it saw a sharp decline at the end of the last week of trading.
In fact, the bullish performance surprised us, given the US GDP data indicating shrinkage by an annualized 4.8% in Q1, ending the longest period of expansion in the country’s history, with the steepest pace of contraction in GDP since Q4/2008 and much worse than market consensus of a 4.0% slump.
The squeeze back above 11,000 points was driven mainly by rumours that Gilead Sciences is approaching early results of a coronavirus drug trial which has shown improvement with a shorter Remdesivir treatment, fuelling hopes that we might be headed towards an effective drug treatment against Covid-19.
Still, the DAX30 closed the week significantly below 11,000 points after the ECB disappointed on Thursday by announcing that it will keep the size of its €750 billion “PEPP” (Pandemic Emergency Purchase Program) and “only” make available, once again, cheaper liquidity for European banks as part of its TLTROIII program.
In our opinion, a rough translation of these ECB measures to promise cheaper and more liquidity for European banks, but keeping PEPP untouched for now could be: “As long as no European unity in regards to a massive economic package to counter the economic Corona-lockdown induced downturn is delivered, we are not increasing the size of our PEPP package.”
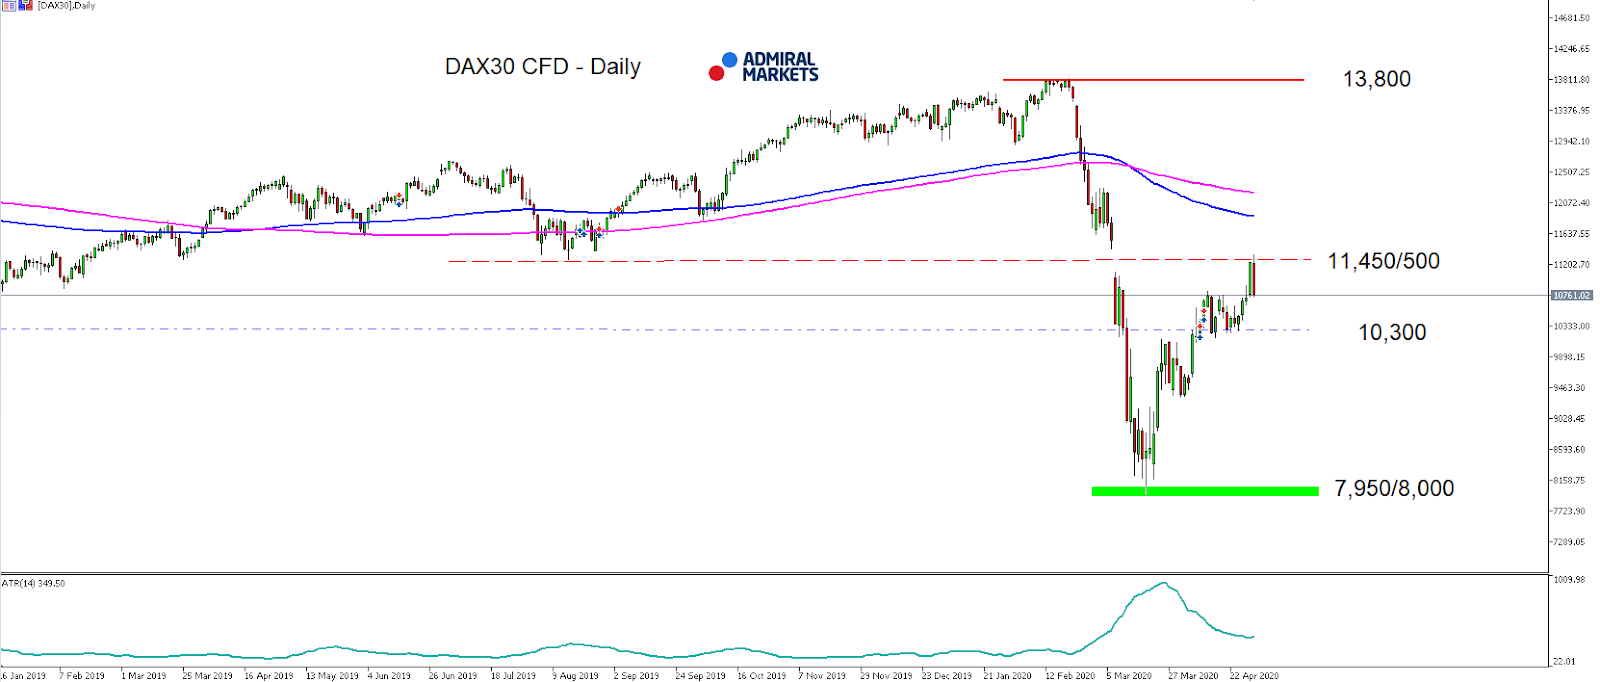
That in mind, it leaves room on the downside for the DAX30 CFD and even though we stay short-term and technically stay positive as long as the German index trades above 10,200 points, a sustainable drop back below 10,800 could trigger further weakness in the days to come:
Source: Admiral Markets MT5 with MT5-SE Add-on DAX30 CFD Hourly chart (between April 9, 2020, to May 1, 2020). Accessed: May 1, 2020, at 10:00pm GMT
Source: Admiral Markets MT5 with MT5-SE Add-on DAX30 CFD Daily chart (between January 16, 2019, to May 1, 2020). Accessed: May 1, 2020, at 10:00pm GMT – Please note: Past performance is not a reliable indicator of future results, or future performance.
In 2015, the value of the DAX30 CFD increased by 9.56%, in 2016, it increased by 6.87%, in 2017, it increased by 12.51%, in 2018, it fell by 18.26%, in 2019, it increased by 26.44% meaning that after five years, it was up by 34.2%.
Discover the world’s #1 multi-asset platform
Admiral Markets offers professional traders the ability to trade with a custom, upgraded version of MetaTrader 5, allowing you to experience trading at a significantly higher, more rewarding level. Experience benefits such as the addition of the Market Heat Map, so you can compare various currency pairs to see which ones might be lucrative investments, access real-time trading data, and so much more. Click the banner below to start your FREE download of MT5 Supreme Edition!
Disclaimer: The given data provides additional information regarding all analysis, estimates, prognosis, forecasts or other similar assessments or information (hereinafter “Analysis”) published on the website of Admiral Markets. Before making any investment decisions please pay close attention to the following:
This is a marketing communication. The analysis is published for informative purposes only and are in no way to be construed as investment advice or recommendation. It has not been prepared in accordance with legal requirements designed to promote the independence of investment research, and that it is not subject to any prohibition on dealing ahead of the dissemination of investment research.
Any investment decision is made by each client alone whereas Admiral Markets shall not be responsible for any loss or damage arising from any such decision, whether or not based on the Analysis.
Each of the Analysis is prepared by an independent analyst (Jens Klatt, Professional Trader and Analyst, hereinafter “Author”) based on the Author’s personal estimations.
To ensure that the interests of the clients would be protected and objectivity of the Analysis would not be damaged Admiral Markets has established relevant internal procedures for prevention and management of conflicts of interest.
Whilst every reasonable effort is taken to ensure that all sources of the Analysis are reliable and that all information is presented, as much as possible, in an understandable, timely, precise and complete manner, Admiral Markets does not guarantee the accuracy or completeness of any information contained within the Analysis. The presented figures refer that refer to any past performance is not a reliable indicator of future results.
The contents of the Analysis should not be construed as an express or implied promise, guarantee or implication by Admiral Markets that the client shall profit from the strategies therein or that losses in connection therewith may or shall be limited.
Any kind of previous or modeled performance of financial instruments indicated within the Publication should not be construed as an express or implied promise, guarantee or implication by Admiral Markets for any future performance. The value of the financial instrument may both increase and decrease and the preservation of the asset value is not guaranteed.
The projections included in the Analysis may be subject to additional fees, taxes or other charges, depending on the subject of the Publication. The price list applicable to the services provided by Admiral Markets is publicly available from the website of Admiral Markets.
Leveraged products (including contracts for difference) are speculative in nature and may result in losses or profit. Before you start trading, you should make sure that you understand all the risks.
The euro is struggling to hold its ground against the pound sterling after a sharp retreat to the March lows.
Prime Minister Boris Johnson’s statement that Britain was past the peak of the pandemic was a signal that the country is moving closer to a ‘return to normal’. As the government outlines its plan to restart the economy this week, the pound may resume its upside push across the board.
Meanwhile, the currency could gain support should the Bank of England issue optimistic guidance later this week. 0.8600 is a key support to keep the uptrend intact. Otherwise, a bearish breakout would trigger a sell-off towards 0.8400.
USDJPY Sinks on US Tariff Threats
We might be seeing a turn in the market mood this week as geopolitical tensions start to hit the headlines. The Trump administration has threatened to impose new tariffs on China in retaliation for their supposed mishandling of the outbreak.
As we approach the year-end US election, COVID-19 and its economic price have certainly exacerbated political uncertainty. A new phase in the trade war would pump up demand for safe-haven assets like the Japanese yen.
The US dollar is sliding down towards 105.00. Any meaningful recovery will need to rally above the key resistance of 108.00.
NZDCAD Stays on Recovery Course
As one of the best performers in April, the New Zealand dollar has held the high ground against its Canadian counterpart. The recovery may last as long as investors feel confident that the world is gradually turning the page on lockdowns.
Tuesday’s jobs data would highlight the economic toll of the health crisis. A disappointing reading could hinder the kiwi’s advance as the RBNZ has not excluded cutting rates into negative territory.
The pair has been rising steadily towards the previous high of 0.8700. On the downside, 0.8400 is a major support to keep sentiment upbeat.
AUDJPY Inches up Ahead of RBA Meeting
The Australian dollar has been surfing on a bullish wave as sentiment brightens across high-yielding assets. Better-than-expected Chinese manufacturing activity and the RBA’s restraint from slashing rates have propelled the currency to a 7-week high.
The question traders are asking now is whether the central bank can afford to maintain its optimism, especially after the Fed pledged to keep rates near zero in light of lasting economic damage.
The Aussie is now approaching the resistance level of 71.40. In case of a retracement, 67.50 near the 30-day moving average would be the first line of defense.
This question never gets old. Shall we ‘sell in May and go away’?
Investors who got out of the market for just the month of May, over the past 11 years since the greatest bull market started, would have outperformed the S&P 500 ‘buy and hold’ strategy by more than 7%. Despite the fact that the call was only correct four out of eleven times, the losses during the months of May were way larger than the gains made, with the largest decline in 2010 of 8.2%.
The bad start to the month of May is raising concerns that the recovery seen since March 24 will prove to be a temporary one, or as traders like to call it, ’a dead cat bounce’. The S&P 500 declined 2.8% on Friday, and equity futures are indicating a negative start to the week. While this does not necessarily mean that another selloff is coming, investors need to be carefully watching the upcoming events.
On Covid-19 related news, states across the US are taking steps to restart the economy by easing stay-at- home orders and allowing non-essential businesses to reopen. That is a similar process to what we have seen across many European nations. These steps of reviving the economy are coming as data from the Johns Hopkins Coronavirus Resource Centre show that coronavirus deaths continue to climb, bringing the total number of fatalities in the US to more than 68,000.
The next two to three weeks are going to be extremely critical on two fronts: health and the economy. No one knows with a high degree of certainty how the Covid-19 curve will play out. While we all hope it slopes downwards, there is no guarantee it will, especially with lockdown periods coming to an end. If cases begin to grow and the curve steepens, the chances are high of returning to another phase of complete shutdown. That would put economies on freeze again and the only direction for stocks to head then is down.
The other risk factor is a new trade war between the US and China, which is the last thing investors want to hear at this stage. However, President Trump has already threatened to impose tariffs on the world’s second-largest economy as he raised the prospect that China deliberately caused the Covid-19 outbreak. US Secretary of State, Mike Pompeo, claimed yesterday that there is a lot of evidence pointing to the virus outbreak originating in a Chinese laboratory. Such statements indicate that Sino-American relations are about to get worse. So, a close eye should be kept on how the situation between the two countries develops.
On the data front, global manufacturing and services PMIs will provide a short-term picture of how companies are coping with the current challenging times and whether we will see any improvement in their outlook, given the relaxation of lockdown measures. Thursday’s import and export data from China will be of extreme importance as they reflect how the lockdown has impacted the world’s supply and demand.
We close the week with the most critical data for the US on Friday, with the monthly jobs report. Expectations are for the US to have lost 21 million jobs and unemployment to jump from 4.4% to 16%. That is 6% beyond the peak unemployment rate of the 2008 financial crisis and can only be compared to the great depression of the 1930s.
Disclaimer: The content in this article comprises personal opinions and should not be construed as containing personal and/or other investment advice and/or an offer of and/or solicitation for any transactions in financial instruments and/or a guarantee and/or prediction of future performance. ForexTime (FXTM), its affiliates, agents, directors, officers or employees do not guarantee the accuracy, validity, timeliness or completeness, of any information or data made available and assume no liability as to any loss arising from any investment based on the same.
At the start of the new trading week, the Dollar index (DXY) picked up from where it left off by adding 0.2 percent since Friday’s close. Despite the Greenback now gaining against all G10 and Asian currencies, except for the Japanese Yen in a sign of fragile risk sentiment at the onset of the week, the DXY however appeared to be losing some steam as it got closer to the 99.4 line.
The US Dollar well supported by the Federal Reserve’s interventions as well as the overall risk aversion evident in the FX markets. Despite the April ISM manufacturing index recording its steepest drop on record, the reading of 36.1 still came in better than expected, which could have provided some extra support for the Greenback.
Freaky Friday: US jobs report widely-expected to be painful
Data watchers will be training their sights on Friday’s monumental US non-farm payrolls print, which is widely expected to post its sharpest deterioration since records began in 1939. Markets are expecting over 21 million jobs to have been wiped out from the US labour market in April, which would be three-times the job losses from March, likely sending the unemployment rate soaring to 16 percent.
However, given that the distressing data is already roundly forecasted by the markets, the announcement should have relatively less of an impact on the markets, with the Dollar further aided by the Fed’s supportive measures. That should keep the DXY rangebound for the time being, within the 98.5 – 101 levels, as global investors continue assessing their risk portfolios while staying abreast with the latest on Covid-19’s impact on the global economy.
Disclaimer: The content in this article comprises personal opinions and should not be construed as containing personal and/or other investment advice and/or an offer of and/or solicitation for any transactions in financial instruments and/or a guarantee and/or prediction of future performance. ForexTime (FXTM), its affiliates, agents, directors, officers or employees do not guarantee the accuracy, validity, timeliness or completeness, of any information or data made available and assume no liability as to any loss arising from any investment based on the same.
Global equities are falling today as US Secretary of State Pompeo said Sunday that China was responsible for the spread of disease and must be held accountable. US claims China increased imports and decreased exports of medical supplies while it held off informing the World Health Organization that the coronavirus “was a contagion” for much of January.
Forex news
Currency Pair
Change
EUR USD
-0.17%
GBP USD
-0.29%
USD JPY
-0.40%
The Dollar weakening reversed today ahead of factory orders report due later in the afternoon. The live dollar index data show the ICE US Dollar index, a measure of the dollar’s strength against a basket of six rival currencies, edged down less than 0.1% to 99.01 Friday as the Institute for Supply Management manufacturing index came in at above expected 41.5 for April. Readings below 50 indicate a contraction in activity. The EUR/USD continued rising Friday while GBP/USD reversed its climbing after the final Markit manufacturing purchasing managers’ index reading for UK showed on Friday British manufacturing suffered its worst decline in output for three decades in April. Both pairs are lower currently. USD/JPY joined AUD/USD’s continued fall on Friday with the dynamics intact for both pairs currently.
Stock Market news
Indices
Change
Dow Jones Index
-0.52%
Australian Stock Index
+1.48%
Hang Seng Index
-1.5%
US Dollar Index
+0.28%
Futures on three main US stock indexes are lower currently after closing sharply lower on Friday. President Trump indicated he considered imposing import tariffs on China. Investors are repricing risk estimates after growing number of companies decline to provide earnings guidance stating high uncertainty due to coronavirus as did Apple. As of Friday only about 65% of the companies that have already reported results are beating estimates, the lowest beat ratio since the 2008 financial crisis, according to JP Morgan. More companies including Ferrari N.V. , American International Group (AIG) , and Eli Lilly will report quarterly results today. Stock indexes in US ended subdued on Friday : the three main US stock indexes recorded losses ranging from 2.6% to 3.2% led by technology shares. European stock indexes are sharply lower currently after markets in Germany, France, Italy and other major European economies reopened following Labour Day holiday Friday. Asian indexes are mixed today with markets in Japan and mainland China closed for holidays: Hong Kong’s Hang Seng index sank 4.1%, leading the decliners.
Commodity Market news
Commodities
Change
Brent Crude Oil
-0.24%
WTI Crude
-5.27%
Brent is extending losses today. Oil prices ended mixed last session as the Organization of the Petroleum Exporting Countries and its allies, collectively known as OPEC+, started cutting production after agreeing in April to reduce output by 9.7 million barrels a day in May and June. The US oil benchmark West Texas Intermediate (WTI) futures ended higher Friday: June WTI gained 5% but is falling currently. July Brent crude closed 0.2% lower at $26.44 a barrel on Friday, however booking a 6.6% gain for the week.
Gold Market News
Metals
Change
Gold
+0.39%
Gold prices are edging higher today. June gold added 0.4% to $1700.90 an ounce on Friday.
Note: This overview has an informative and tutorial character and is published for free. All the data, included in the overview, are received from public sources, recognized as more or less reliable. Moreover, there is no guarantee that the indicated information is full and precise. Overviews are not updated. The whole information in each overview, including opinion, indicators, charts and anything else, is provided only for familiarization purposes and is not financial advice or а recommendation. The whole text and its any part, as well as the charts cannot be considered as an offer to make a deal with any asset. IFC Markets and its employees under any circumstances are not liable for any action taken by someone else during or after reading the overview.
Seattle Genetics shares traded 8% higher, reaching a new 52-week high, after the company reported Q1/20 financial results which included a 10% y-o-y increase in net revenues fueled by a 22% increase in sales of ADCETRIS® and a strong debut for PADCEV in its first full quarter of sales.
The company also provided an update on commercial results achieved in the quarter for its lead medicines including ADCETRIS® (brentuximab vedotin) and PADCEV (enfortumab vedotin-ejfv) and the U.S. Food and Drug Administration’s (FDA) approval and launch of TUKYSA (tucatinib).
The company’s President and CEO Clay Siegall, Ph.D., commented, “We have had a remarkable start to 2020, delivering record product sales in the first quarter that are now coming from both ADCETRIS and PADCEV. Notably, strong PADCEV sales in the first full quarter of launch reflect the unmet need among patients with metastatic bladder cancer…With the recent approval of TUKYSA for patients with metastatic HER2-positive breast cancer, we have now launched our third product just four months after our second…We are also preparing for European commercial operations and have hired general managers in major European markets ahead of potential ex-U.S. approvals of TUKYSA. With two new products, growing revenues, and an advancing pipeline of novel cancer programs, we have exciting prospects for future growth.”
The company highlighted that ADCETRIS net sales in the U.S. and Canada increased by 22% to $164.1 million in Q1/20, compared to $135 million in Q1/19. The firm indicated that PADCEV net sales in the U.S. reached $34.5 million in Q1/20, which was its first full quarter of commercialization. The company added that royalty revenues in Q1/20 were $20.4 million and collaboration and license agreement revenues in Q1/20 totaled $15.6 million.
The firm reported a net loss for Q1/20 of $168.4 million, or $0.98 per diluted share, compared to net loss of $13.3 million, or $0.08 per diluted share for Q1/19. The company explained that “the net loss in Q1/20 included a net investment loss of $59.1 million primarily associated with its common stock holdings in Immunomedics, which are marked-to-market, compared to a net investment gain of $38.1 million in Q1/19.”
The company advised that its TUKYSA was approved by the FDA for patients with HER2-positive metastatic breast cancer who have received one or more prior anti-HER2 regimens in the metastatic setting. The firm mentioned that it also expects to be able to report topline data in late Q2/20 or Q3/20 for the innovaTV 204 pivotal trial of tisotumab vedotin in patients with recurrent and/or metastatic cervical cancer who have relapsed or progressed after standard of care treatment.
The company noted that it is regularly monitoring the effects of the COVID-19 situation and is maintaining its business outlook estimates for FY/20 that it provided previously on February 6, 2020. For FY/20 it expects ADCETRIS net product sales of $675700 million, royalty revenues of $105115 million and collaboration and license agreement revenues of $3050 million. The firm advised that for FY/20 it expects that R&D expenses will range from $860950 million with SG&A expenses of $475525 million.
Seattle Genetics is headquartered in Bothell, Wash., and is a global biotechnology company focused on discovering and commercializing cancer medicines.
Seattle Genetics has a market capitalization of around $23.7 billion with approximately 172.5 million shares outstanding. SGEN shares opened 2.75% higher today at $141.00 (+$3.77, +2.75%) over yesterday’s $137.23 closing price and reached a new 52-week high price this morning of $157.00. The stock has traded today between $140.05 and $157.00 per share and is currently trading at $148.51 (+$11.28, +8.22%).
Disclosure: 1) Stephen Hytha compiled this article for Streetwise Reports LLC and provides services to Streetwise Reports as an independent contractor. He or members of his household own securities of the following companies mentioned in the article: None. He or members of his household are paid by the following companies mentioned in this article: None. 2) The following companies mentioned in this article are billboard sponsors of Streetwise Reports: None. Click here for important disclosures about sponsor fees. 3) Comments and opinions expressed are those of the specific experts and not of Streetwise Reports or its officers. The information provided above is for informational purposes only and is not a recommendation to buy or sell any security. 4) The article does not constitute investment advice. Each reader is encouraged to consult with his or her individual financial professional and any action a reader takes as a result of information presented here is his or her own responsibility. By opening this page, each reader accepts and agrees to Streetwise Reports’ terms of use and full legal disclaimer. This article is not a solicitation for investment. Streetwise Reports does not render general or specific investment advice and the information on Streetwise Reports should not be considered a recommendation to buy or sell any security. Streetwise Reports does not endorse or recommend the business, products, services or securities of any company mentioned on Streetwise Reports. 5) From time to time, Streetwise Reports LLC and its directors, officers, employees or members of their families, as well as persons interviewed for articles and interviews on the site, may have a long or short position in securities mentioned. Directors, officers, employees or members of their immediate families are prohibited from making purchases and/or sales of those securities in the open market or otherwise from the time of the interview or the decision to write an article until three business days after the publication of the interview or article. The foregoing prohibition does not apply to articles that in substance only restate previously published company releases. 6) This article does not constitute medical advice. Officers, employees and contributors to Streetwise Reports are not licensed medical professionals. Readers should always contact their healthcare professionals for medical advice.
This week – May 3 through May 9 – central banks from 11 countries or jurisdictions are scheduled to decide on monetary policy: Honduras, Australia, Malaysia, Albania, Brazil, Chile, Norway, Serbia, United Kingdom, Czech Republic and Peru.
Following table includes the name of the country, the date of the next policy decision, the current policy rate, the result of the last policy decision, the change in the policy rate year to date, and the rate one year ago.
The table is updated when the latest decisions are announced and can always accessed by clicking on This Week.
Bob Moriarty of 321gold discusses gold, financial collapse and consequences of quarantining.
I’ve had a few comments lately on the pieces I have been writing about where we stand politically and with the Corona Virus. One complained and said that he loves my comments on markets but I was getting too political.
Of course I am.
I thought we had two totally different crises on our hands today. Most people only see one, that of the Corona Virus. Obviously we need to pay attention to the virus and actions of governments to combat it. The virus has killed a lot of people and will kill more.
There is however what I started predicting a year ago. I believe to be both more deadly and serious than the Corona Virus. That is over the totally dysfunctional world financial system built on a foundation of debt that we all recognize will never be paid. Anyone who didn’t see how out of whack our financial issues are simply isn’t paying attention.
I thought we would start a financial collapse last October but the Fed also saw it coming and began to pour fuel on the fire in mid-September. The rest of the US got to see we had a problem in mid-March when the bottom fell out of the market. I did manage to get a warning out to my readers at the end of February that in hindsight looks like a great call.
But I missed a giant problem swelling up that is also going to kill a lot of Americans and those locked down all over the world. That is of cabin fever. I’m not going to pretend that I am any form of expert on cabin fever. I’m not. However I’ve pretty much been locked down for about six weeks and frankly I’m going stir crazy.
I live in a quiet part of the world in a tiny village surrounded by small farms. We have few social issues and crime is pretty minor. There will always be food around if you like your hamburger on the hoof. The weather is mild. Like everyone else in the world we are ruled by idiots who believe that every problem can be solved only by creating more rules.
I can go to the store if I have my permission slip. I can seek medical care. It’s ok to exercise outside the confines of my abode. So it’s not as if I’m in prison. But I do miss touching and seeing and talking to people. I don’t like living like a hermit. I’m not about to start shooting people but I do wish we could go back to the pre-panic days.
Two doctors who run a clinic in California did a long You Tube video of what they were seeing and how their experiences said the US was doing something very dangerous. Until I saw the video, I hadn’t really realized there are a lot of people going stir crazy.
It, too, can create long-term issues. So locking down society to vanquish the virus makes more and different problems all by itself. The quarantine is dangerous at some point. At last count the video had over six million views on You Tube.
Until this.
Evidently experienced doctors who do a video explaining what can happen when you lock down a society is far too dangerous for us to watch.
It’s not like it’s PG-13, it’s XXXX-1, not suitable for anyone, burn yourself after watching. So I found a Vimeo copy of the same video, it got the same treatment after a couple of days. So here is yet another until it gets yanked.
Being locked down is pretty scary in my experience. But being told how to think and what we can watch is even deadlier.
By now if you have any sense you are asking yourself, what exactly do cabin fever and gold have to do with each other? “This is a gold site; I didn’t come here to read a bunch of bull.”
The same idiots who created the financial mess that finally blew sky high in the middle of March and never saw it coming were also the fools who couldn’t give us an accurate prediction of how many people would die in the US of the virus. They never bothered refilling the PPE supplies at the Federal Government level after they were depleted during the Obama administration.
Congress was far too busy attempting to convict Trump and remove him from office to take any action over what was obviously a serious medical threat. The FBI and DOJ were scurrying around like a cat in a litter box attempting to cover up its crap over their attempt to manage a coup d’état against the legally elected president of the country.
Meanwhile the mainstream media were keeping score of how many times Trump could lie in one sentence. Whoever could guess the closest number to being correct would get a free cup of coffee at Starbucks if they ever open.
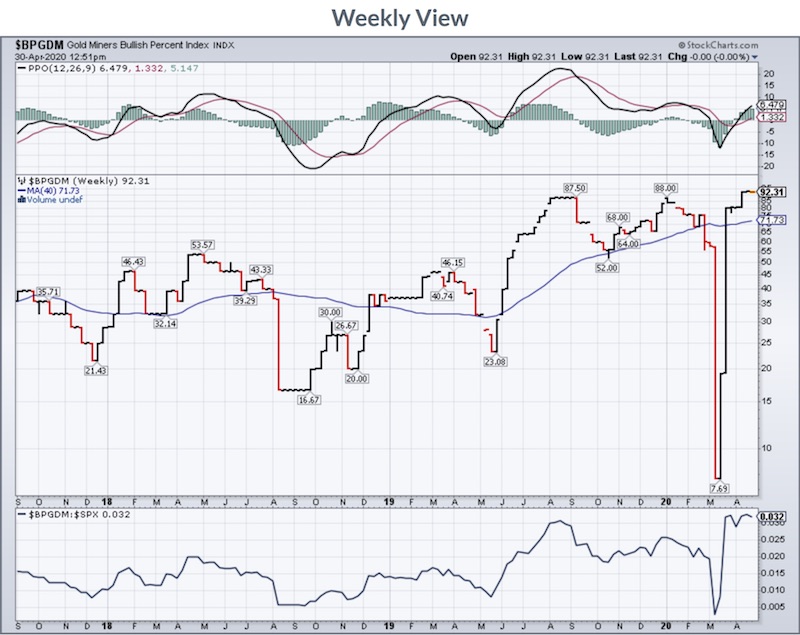
I want to see a correction in gold and silver and the mining stocks. I get twitchy when everyone is talking about how high gold is going to go and how Comex is about to default.
There is a measure named the Gold Miners Bullish Percent Index. Right now it is exactly as bullish as it was bearish in mid-March at the very bottom after the biggest decline in stock market history. People are way too bullish for my blood. They are more bullish than they were in July of 2017 after a monster gold stock rally. We can’t have that.
If I were worth a penny as a forecaster, which I am not, I’d say the June/July timeframe would make a great time for a low if we had a nice and necessary correction.
But the idiots pulling all the levers have guaranteed gold and silver are going to go places even the bulls cannot imagine. All that the President and VP, and most of the doctors and the media, and the Fed, and the FBI/DOJ, and YouTube/Vimeo have accomplished is to prove just how useless and clueless they are at heart.
It would be a great time to own some gold and silver because after they f$#k it up fourteen times and fail at every effort, someone is going to suggest, “You know, what we really need is a jubilee and to go back to a gold and silver standard.”
Then we will be fine.
That is if we survive the virus, the depression and cabin fever.
Bob Moriarty founded 321gold.com, with his late wife, Barbara Moriarty, more than 16 years ago. They later added 321energy.com to cover oil, natural gas, gasoline, coal, solar, wind and nuclear energy. Both sites feature articles, editorial opinions, pricing figures and updates on current events affecting both sectors. Previously, Moriarty was a Marine F-4B and O-1 pilot with more than 832 missions in Vietnam. He holds 14 international aviation records.
Disclosure: 1) Statements and opinions expressed are the opinions of Bob Moriarty and not of Streetwise Reports or its officers. Bob Moriarty is wholly responsible for the validity of the statements. Streetwise Reports was not involved in the content preparation. Bob Moriarty was not paid by Streetwise Reports LLC for this article. Streetwise Reports was not paid by the author to publish or syndicate this article. 2) This article does not constitute investment advice. Each reader is encouraged to consult with his or her individual financial professional and any action a reader takes as a result of information presented here is his or her own responsibility. By opening this page, each reader accepts and agrees to Streetwise Reports’ terms of use and full legal disclaimer. This article is not a solicitation for investment. Streetwise Reports does not render general or specific investment advice and the information on Streetwise Reports should not be considered a recommendation to buy or sell any security. Streetwise Reports does not endorse or recommend the business, products, services or securities of any company mentioned on Streetwise Reports. 3) From time to time, Streetwise Reports LLC and its directors, officers, employees or members of their families, as well as persons interviewed for articles and interviews on the site, may have a long or short position in securities mentioned. Directors, officers, employees or members of their immediate families are prohibited from making purchases and/or sales of those securities in the open market or otherwise from the time of the interview or the decision to write an article until three business days after the publication of the interview or article. The foregoing prohibition does not apply to articles that in substance only restate previously published company releases.