by JustForex
The EUR/USD currency pair
- Prev Open: 1.10317
- Open: 1.10940
- % chg. over the last day: +0.56
- Day’s range: 1.10802 – 1.10940
- 52 wk range: 1.0879 – 1.1572
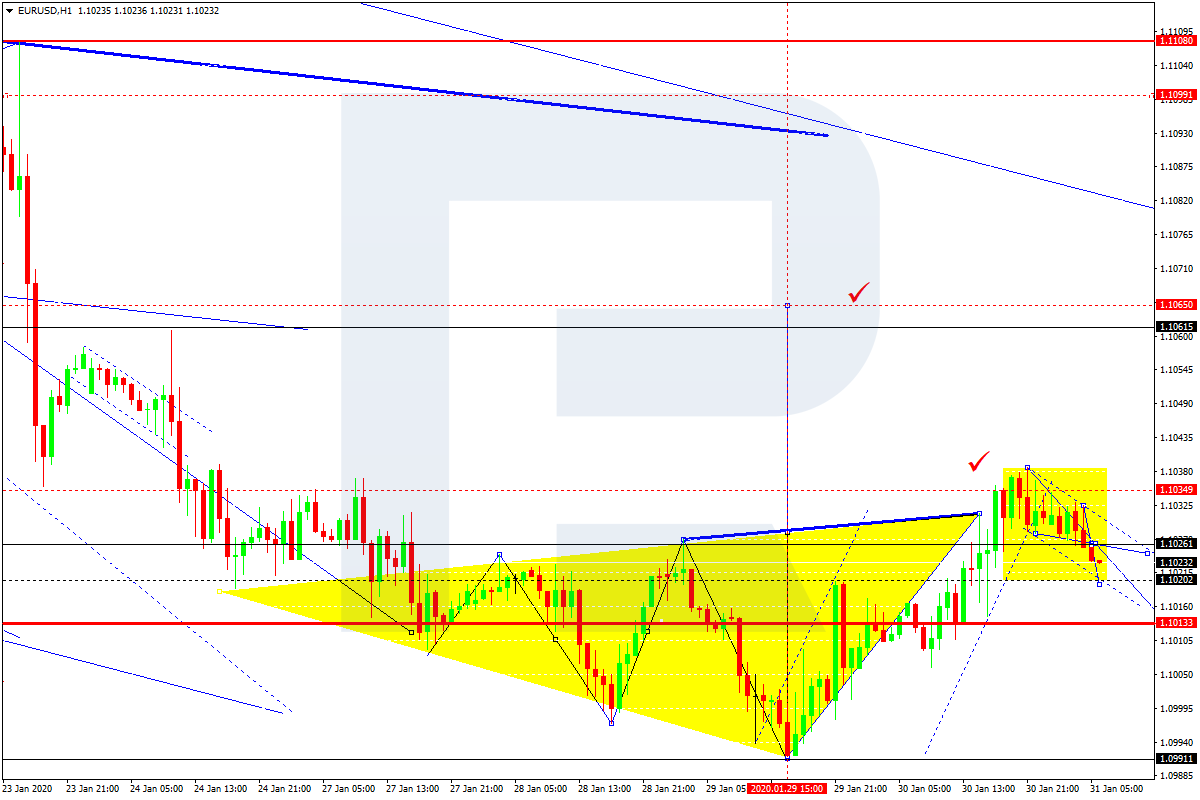
On Friday, January 31, there were aggressive purchases on EUR/USD currency pair. The trading instrument set new local highs. The coronavirus outbreak in China continues to be in the focus of attention of financial markets participants. We recommend you to monitor the current information on this issue. At the moment EUR/USD quotes are consolidating in the range of 1.10700-1.11000. The single currency has potential for further growth. We expect the publication of important economic reports. Open positions from key levels.
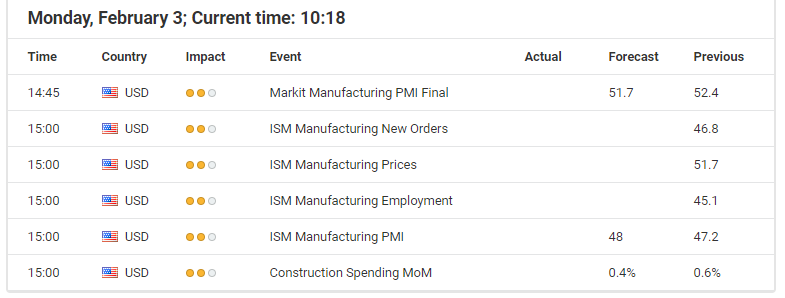
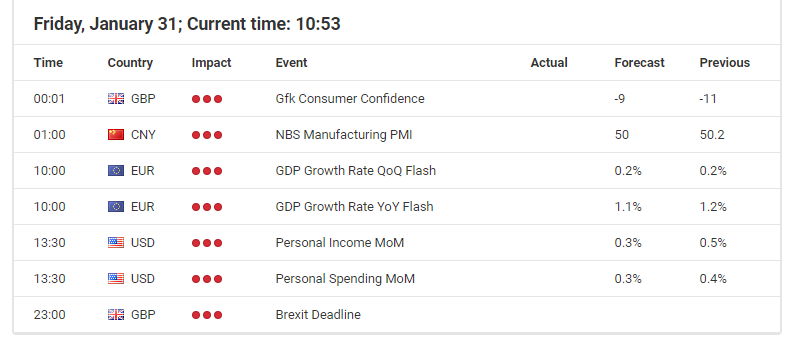
The Economic News Feed for 03.02.2020:
- – Business Activity Index in the German manufacturing sector – 10:55 (GMT+2:00);
- – ISM Manufacturing Index for the USA – 17:00 (GMT+2:00).;

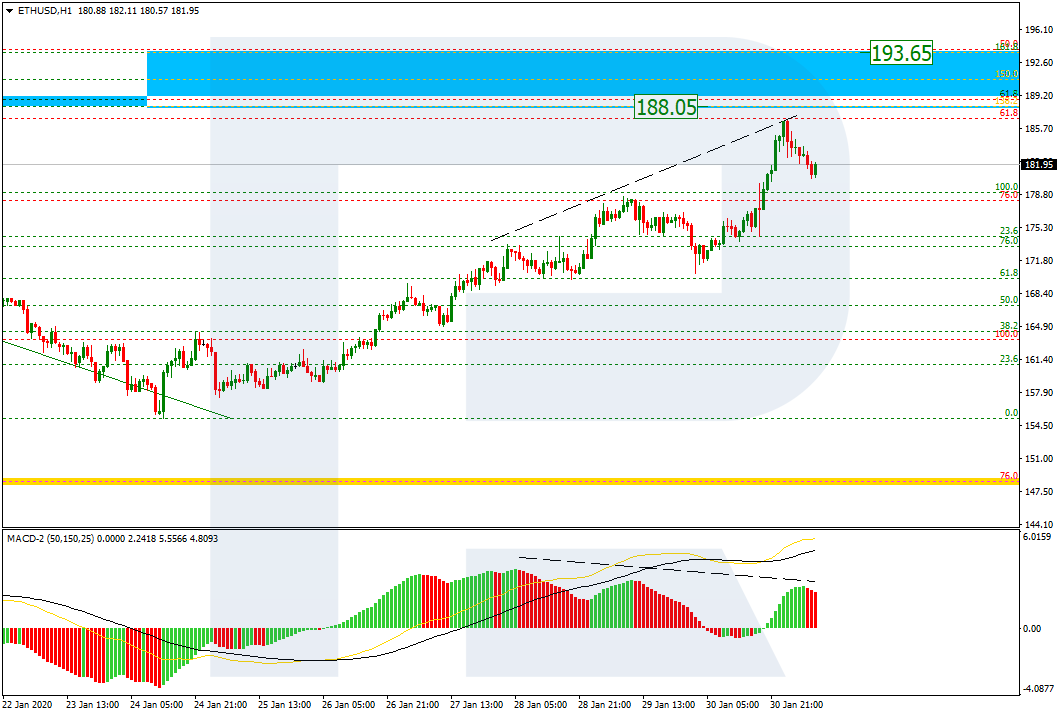
The indicators signal the strength of buyers: the price has fixed above 50 MA and 100 MA.
The MACD histogram is in the positive zone, but below the signal line, which gives a weak signal to buy EUR/USD.
The Stochastic Oscillator is in the neutral zone, the %K line is above the %D line, which indicates a bullish sentiment.
- Support levels: 1.10700, 1.10400, 1.10200
- Resistance levels: 1.11000, 1.11200, 1.11500
If the price fixes above 1.11000, expect the quotes to grow toward 1.11200-1.11500.
Alternatively, the quotes could descend toward 1.10500-1.10300.
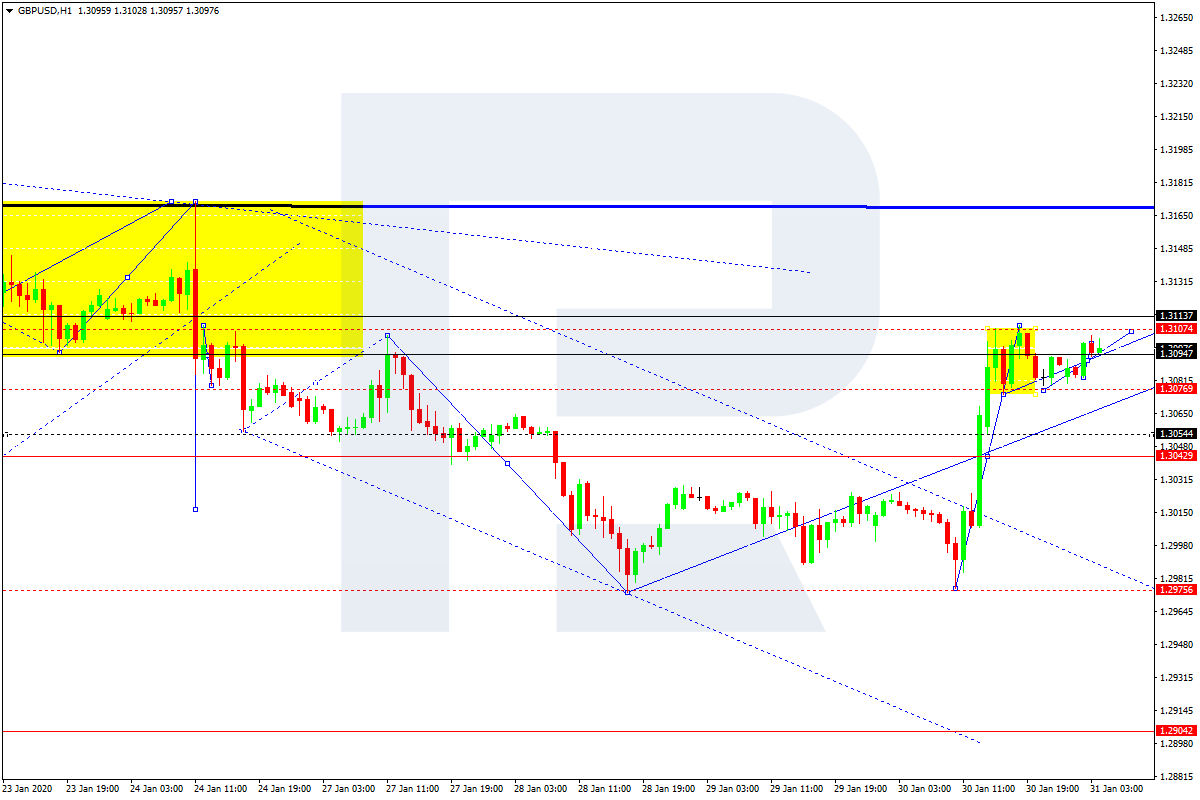
The GBP/USD currency pair
- Prev Open: 1.30856
- Open: 1.31703
- % chg. over the last day: +0.81
- Day’s range: 1.31528 – 1.31836
- 52 wk range: 1.1959 – 1.3516
GBP/USD quotes show a strongly pronounced upward trend. Sterling has overcome and strengthened above the key extremums. At the moment, the trading instrument is consolidating. Local support and resistance levels are at 1.31400 and 1.31800, respectively. The GBP/USD currency pair has potential for further growth. This week will introduce a number of important indicators of business activity in the UK. Open positions from key levels.
The Economic News Feed for 03.02.2020:
- – UK Manufacturing Activity Index – 11:30 (GMT+2:00).

The indicators signal the strength of buyers: the price has fixed above 50 MA and 100 MA.
The MACD histogram is in the positive zone, but below the signal line, which gives a weak signal to buy GBP/USD.
The Stochastic Oscillator is located near the oversold area, the %K line crossed the %D line. There are no signals at the moment.
- Support levels: 1.31400, 1.31000, 1.30750
- Resistance levels: 1.31800, 1.32100
If the price fixes above 1.31800, expect further growth toward 1.32100-1.32400.
Alternatively, the quotes could descend toward 1.31000.
The USD/CAD currency pair
- Prev Open: 1.32042
- Open: 1.32360
- % chg. over the last day: +0.20
- Day’s range: 1.32358 – 1.32498
- 52 wk range: 1.2949 – 1.3566
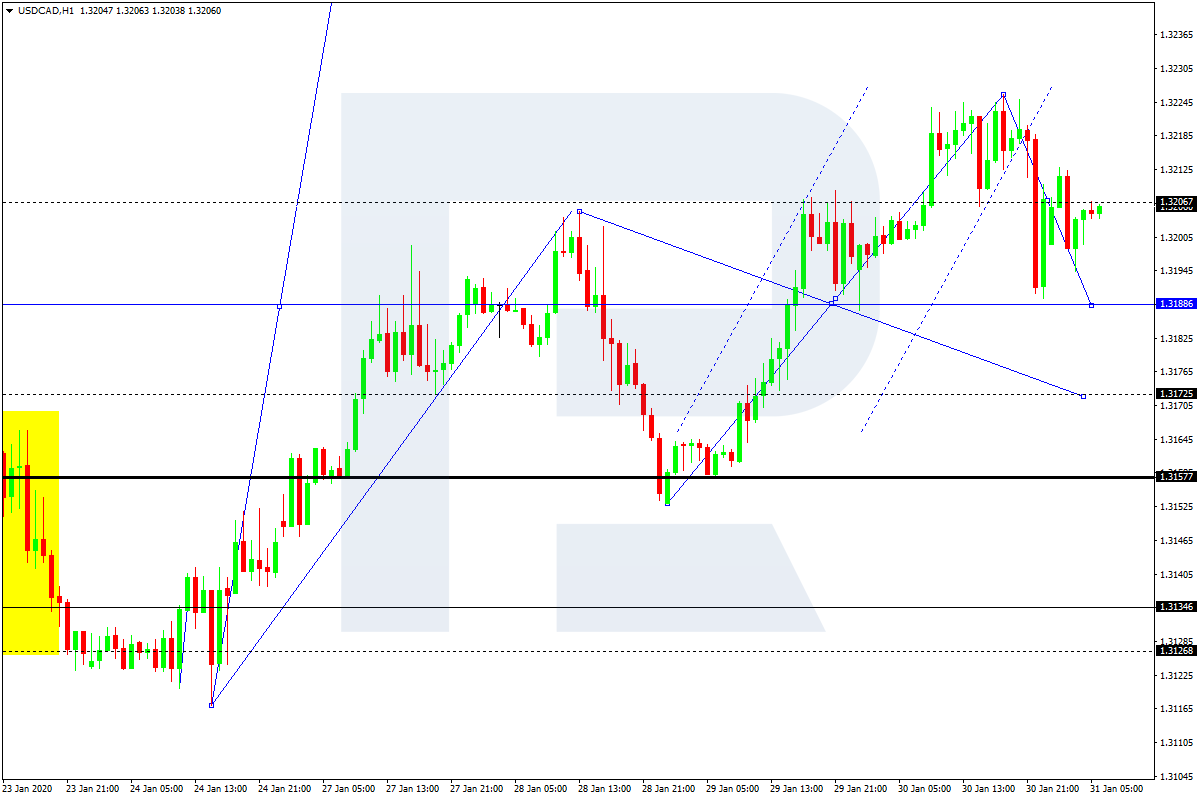
A bullish sentiment still dominates the USD/CAD. The trading instrument has updated local highs again. Currently, the CAD is consolidating in the range of 1.32200-1.32500. Technical correction of USD/CAD quotes after the prolonged rally is not excluded in the nearest future. We recommend you to pay attention to the dynamics of oil prices. Open positions from key levels.
The news background on the Canadian economy is calm.

The indicators signal the strength of buyers: the price has fixed above 50 MA and 100 MA.
Histogram of MACD is in the positive zone, which indicates a bullish sentiment.
The Stochastic Oscillator is in the neutral zone, the %K line crosses the %D line. No signals at the moment.
- Support levels: 1.32200, 1.31900, 1.31550
- Resistance levels: 1.32500, 1.32800
If the price fixes above 1.32500, expect the quotes to grow toward 1.32800-1.33000.
Alternatively, the quotes could correct toward 1.31900-1.31700.
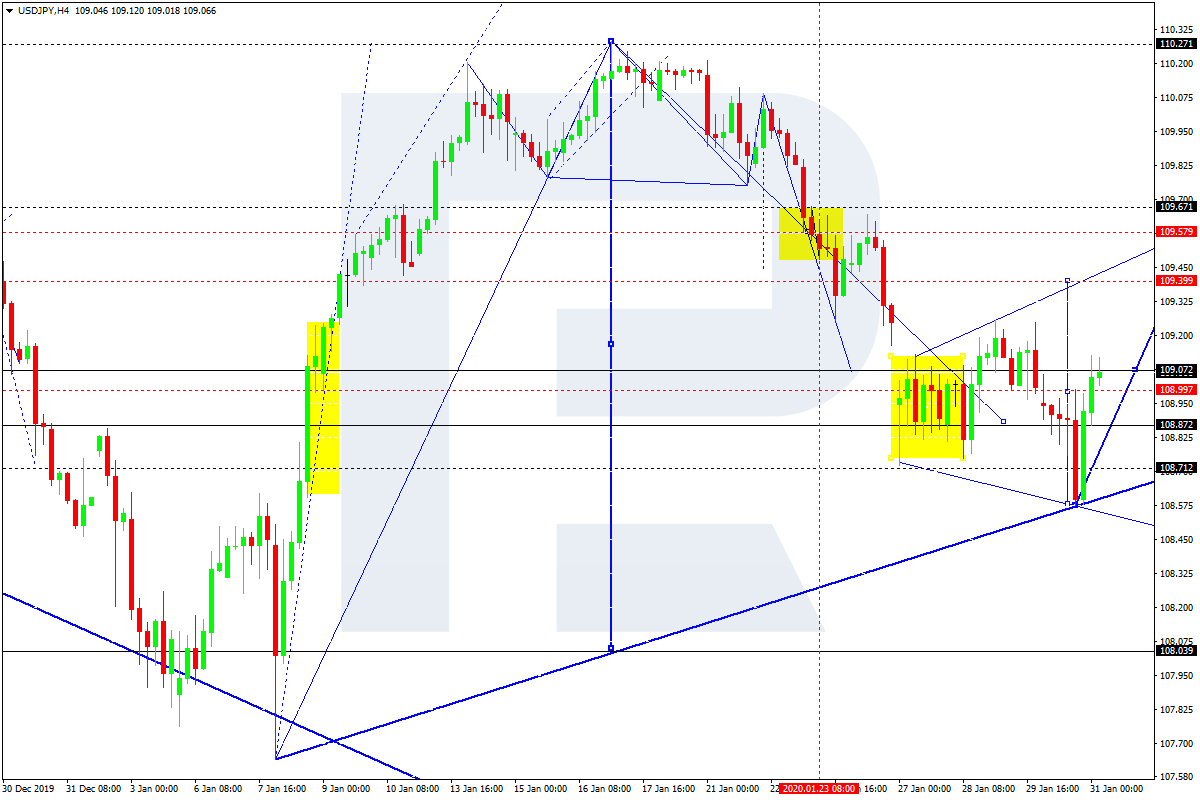
The USD/JPY currency pair
- Prev Open: 108.977
- Open: 108.450
- % chg. over the last day: -0.53
- Day’s range: 108.307 – 108.626
- 52 wk range: 104.45 – 113.53
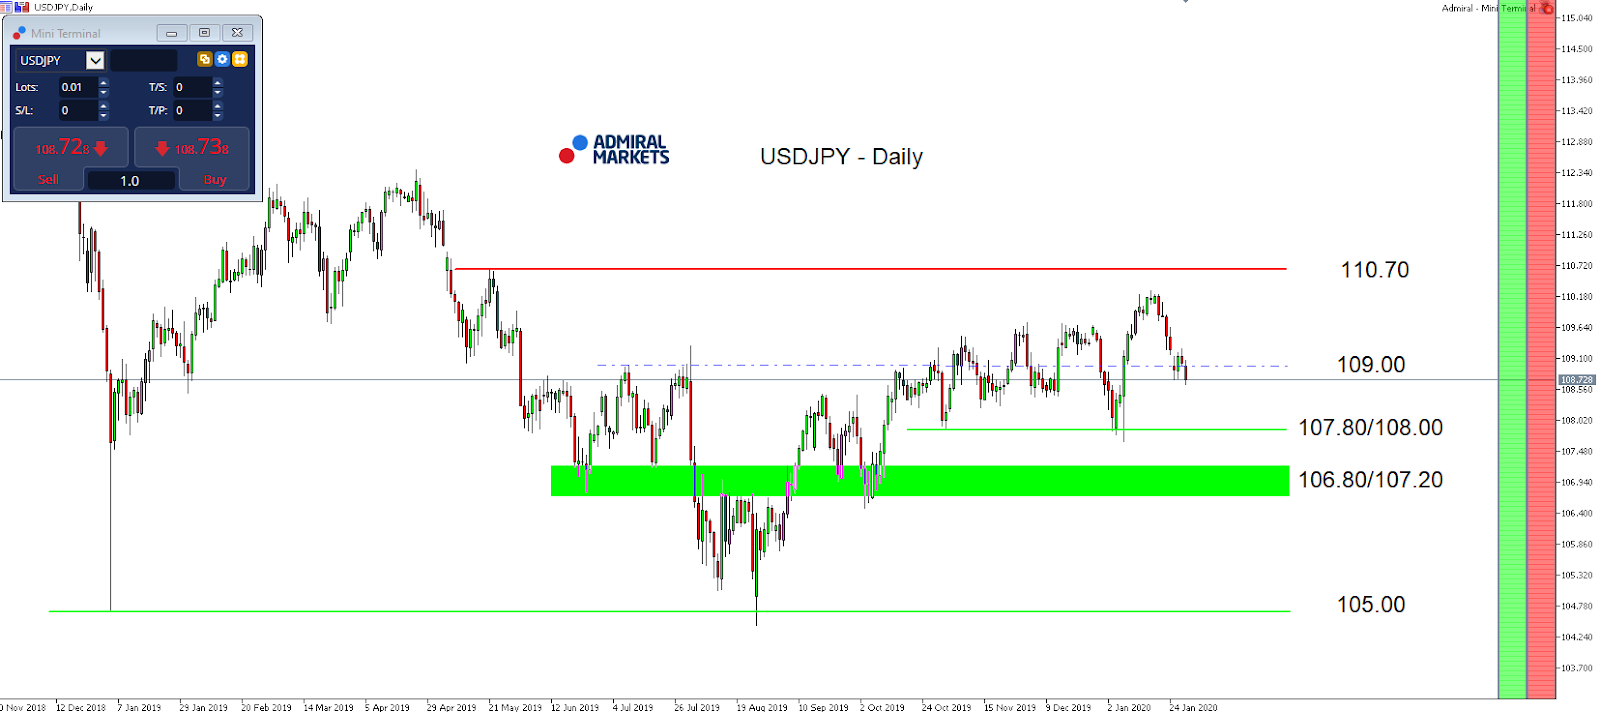
The USD/JPY currency pair has moved down after a prolonged consolidation. The trading instrument broke through the key lows. Currently, USD/JPY is consolidating in the range 108.300-108.600. Demand for save haven currencies remains at a high level. We do not rule out further growth of the yen against the US dollar. Today we recommend you to pay attention to the US economy news background. Open positions from key levels.
The publication of important economic reports from Japan is not planned.

The indicators signal the sellers’ strength: the price has fixed below 50 MA and 100 MA.
The MACD histogram is in the negative zone, which indicates a bearish sentiment.
The Stochastic Oscillator is in the neutral zone, the %K line has crossed the %D line. There are no signals at the moment.
- Support levels: 108.300, 108.000
- Resistance levels: 108.600, 108.800, 109.100
If the price fixes below 108.300, USD/JPY quotes are expected to fall further. Potential movement towards 108.000-107.800.
Alternatively, the quotes could grow to 109.000-109.200.
by JustForex