Author Archive for InvestMacro – Page 98

Ichimoku Cloud Analysis 04.02.2020 (AUDUSD, NZDUSD, USDCAD)

Article By RoboForex.com

AUDUSD, “Australian Dollar vs US Dollar”

AUDUSD is trading at 0.6715; the instrument is moving below Ichimoku Cloud, thus indicating a descending tendency. The markets could indicate that the price may test the cloud’s downside border at 0.6750 and then resume moving downwards to reach 0.6515. Another signal to confirm further descending movement is the price’s rebounding from the descending channel’s upside border. However, the scenario that implies further decline may be canceled if the price breaks the cloud’s upside border and fixes above 0.6815. In this case, the pair may continue growing towards 0.6895.

AUDUSD
Risk Warning: the result of previous trading operations do not guarantee the same results in the future

NZDUSD, “New Zealand Dollar vs US Dollar”

NZDUSD is trading at 0.6466; the instrument is moving below Ichimoku Cloud, thus indicating a descending tendency. The markets could indicate that the price may test the cloud’s downside border at 0.6500 and then resume moving downwards to reach 0.6305. Another signal to confirm further descending movement is the price’s rebounding from the resistance level. However, the scenario that implies further decline may be canceled if the price breaks the cloud’s upside border and fixes above 0.6565. In this case, the pair may continue growing towards 0.6655.

NZDUSD
Risk Warning: the result of previous trading operations do not guarantee the same results in the future

USDCAD, “US Dollar vs Canadian Dollar”

USDCAD is trading at 1.3290; the instrument is moving above Ichimoku Cloud, thus indicating an ascending tendency. The markets could indicate that the price may test the cloud’s upside border at 1.3215 and then resume moving upwards to reach 1.3425. Another signal to confirm further ascending movement is the price’s rebounding from the support level. However, the scenario that implies further growth may be canceled if the price breaks the cloud’s downside border and fixes below 1.3155. In this case, the pair may continue falling towards 1.3055 and form Inverted Head & Shoulders reversal pattern.

USDCAD

Article By RoboForex.com

Attention!
Forecasts presented in this section only reflect the author’s private opinion and should not be considered as guidance for trading. RoboForex LP bears no responsibility for trading results based on trading recommendations described in these analytical reviews.

The Dollar Index Has Recovered Part of Losses. Sterling Has Collapsed

by JustForex

The US dollar has been growing against a basket of major currencies. Yesterday, the dollar index (#DX) closed in the green zone (+0.49%). Positive economic data from the US supported the American currency. So, ISM manufacturing PMI counted to 50.9 and was better than the forecasted value of 48.5.

The situation with coronavirus is still unresolved. The death toll from coronavirus in China rose to 425 as of Monday evening, and the number of infected exceeded 20,000. China continues to expand protective measures: in addition to Wuhan, Huanggang and Ezhou have already been closed. Perhaps quarantine will be introduced in other cities as needed.

Sterling was under pressure after comments by Boris Johnson. The Prime Minister said that Great Britain did not intend to adhere to EU trade standards after Brexit. Today, the Reserve Bank of Australia has decided on the interest rate during the Asian trading session. So, the regulator left the indicator unchanged at 0.75%. The central bank also kept forecasts of economic growth at current levels.

The “black gold” prices are recovering after a protracted fall. Currently, futures for the WTI crude oil are testing the $50.85 mark per barrel.

Market Indicators

Yesterday, there was the bullish sentiment in the US stock market: #SPY (+0.74%), #DIA (+0.55%), #QQQ (+1.51%).

The 10-year US government bonds yield has been growing. At the moment, the indicator is at the level of 1.57-1.58%.

The Economic News Feed for 04.02.2020:
  • – Construction PMI in the UK at 11:30 (GMT+2:00);
  • – Factory orders in the US at 17:00 (GMT+2:00);
  • – New Zealand labor market report at 23:45 (GMT+2:00).

by JustForex

The Analytical Overview of the Main Currency Pairs on 2020.02.04

by JustForex

The EUR/USD currency pair

Technical indicators of the currency pair:
  • Prev Open: 1.10940
  • Open: 1.10583
  • % chg. over the last day: -0.24
  • Day’s range: 1.10555 – 1.10642
  • 52 wk range: 1.0879 – 1.1572

The EUR/USD currency pair retreated from local highs after a sharp rally last week. The demand for greenback resumed after the release of optimistic statistics on business activity in the US manufacturing sector. At the moment the technical picture is ambiguous. The trading instrument is consolidating in the range of 1.10400-1.10650. Financial markets participants are waiting for additional drivers. It is recommended to open positions from key levels.

Today the news background is quite calm. At 17:00 (GMT+2:00) a report on industrial orders volume in the USA will be published.

EUR/USD

Indicators do not give accurate signals: the price has crossed 50 MA.

MACD histogram is near the 0 mark.

The Stochastic Oscillator is located in the neutral zone, the %K line has crossed the %D line. There are no signals at the moment.

Trading recommendations
  • Support levels: 1.10400, 1.10200, 1.10000
  • Resistance levels: 1.10650, 1.10950, 1.11100

If the price fixes above 1.10650, expect the quotes to rise toward 1.10900-1.11200.

Alternatively, the quotes could descend toward 1.10200-1.10000.

The GBP/USD currency pair

Technical indicators of the currency pair:
  • Prev Open: 1.31703
  • Open: 1.29894
  • % chg. over the last day: -1.40
  • Day’s range: 1.29812 – 1.30238
  • 52 wk range: 1.1959 – 1.3516

Aggressive sales dominate GBP/USD currency pair. During yesterday’s trading the drop exceeded 180 points. Sterling was under pressure after Boris Johnson’s comments. The Prime Minister said that Great Britain is not going to adhere to the EU trade standards after Brexit. At the moment GBP/USD quotes are consolidating in the range 1.29800-1.30250. The trading instrument has a potential for further decline. Positions need to be opened from key levels.

The Economic News Feed for 04.02.2020:

  • – UK Construction Business Index – 11:30 (GMT+2:00);
GBP/USD

The indicators signal the sellers’ strength: the price has fixed below 100 MA.

The MACD histogram is in the negative zone, but above the signal line, which gives a weak signal to sell GBP/USD.

The Stochastic Oscillatoris in the neutral zone, the %K line is below the %D line, which indicates a bearish mood

Trading recommendations
  • Support levels: 1.29800, 1.29400
  • Resistance levels: 1.30250, 1.30650, 1.30850

If the price fixes below 1.29800, GBP/USD quotes are expected to fall further to 1.29400-1.29200.

Alternatively, they could grow to 1.30500-1.30800.

The USD/CAD currency pair

Technical indicators of the currency pair:
  • Prev Open: 1.32360
  • Open: 1.32869
  • % chg. over the last day: +0.41
  • Day’s range: 1.32867 – 1.33019
  • 52 wk range: 1.2949 – 1.3566

USD/CAD quotes continue to show a stable upward trend. The trading instrument reached the round level of 1.33000. The mark 1.32500 is already a mirror support. The CAD is under pressure from aggressive sales in the oil market. However, the technical correction of the USD/CAD currency pair after the prolonged rally is not ruled out in the nearest future. Positions should be opened from key levels.

The Economic News Feed for 04.02.2020 is calm.

USD/CAD

The indicators signal the strength of buyers: the price has fixed above 50 MA and 100 MA.

MACD histogram is in the positive zone, which indicates a bullish sentiment.

The Stochastic Oscillator is located near the oversold area, the %K line is below the %D line, which gives a weak signal to sell USD/CAD.

Trading recommendations
  • Support levels: 1.32500, 1.32200, 1.31900
  • Resistance levels: 1.33000, 1.33400

If the price fixes above 1.33000, expect further growth toward 1.33300-1.33500.

Alternatively, the quotes could correct toward 1.32200-1.31900.

The USD/JPY currency pair

Technical indicators of the currency pair:
  • Prev Open: 108.450
  • Open: 108.687
  • % chg. over the last day: +0.21
  • Day’s range: 108.548 – 108.934
  • 52 wk range: 104.45 – 113.53

The USD/JPY currency pair has an ambiguous technical picture. At the moment the trading instrument is in sideways movement. Local support and resistance levels are at 108.600 and 108.950, respectively. USD/JPY quotes have a potential for recovery. We recommend you to pay attention to the US government securities yield dynamics. Positions should be opened from key levels.

The Economic News Feed for 04.02.2020 is calm.

USD/JPY

Indicators do not give accurate signals: the price has crossed 50 MA and 100 MA.

Histogram of MACD has crossed to the positive zone, which indicates the development of bullish sentiments.

The Stochastic Oscillator is located in the overbought zone, the %K line has crossed the %D line. No signals at the moment.

Trading recommendations
  • Support levels: 108.600, 108.300, 108.000
  • Resistance levels: 108.950, 109.250, 109.450

If the price fixes above 108.950, expect the quotes to rise toward 109.250-109.450.

Alternatively, the quotes could descend toward 108.350-108.000.

by JustForex

EURUSD: bears gaining strength

By Alpari.com

On Monday, February 3, the euro was down at the end of trading. EUR and GBP both strengthened against the US dollar on Friday, before the value of all three currencies fell on Monday.

The coronavirus situation in China remains tense, with the number of patients and deaths continuing to grow. Nevertheless, stock markets stabilised after the fall of Chinese stock indices came to an end. Protective assets have fallen in price, and yields on 10-year bonds rose from 1.5034 to 1.5755.

The USD continued to rise against the yen after the publication of a report by the Institute for Supply Management (ISM), which showed that manufacturing activity in the US unexpectedly increased in January. The PMI rose to 50.9 in January, after falling to a revised level of 47.8 in December.

Today’s events (GMT+3):

  • 12:30 UK: Markit Construction PMI (Jan).
  • 13:00 Eurozone: Producer Price Index (MoM) (Dec).
  • 18:00 USA: Factory Orders (MoM) (Dec).

Рис. 1Current situation:

Yesterday’s expectations came true. On Friday, the euro rose in price amid the exodus of investors in US bonds and their lower yields. The downwards correction was 76.4% of the growth from 1.1017 to 1.1095. En route to their target, bears will meet resistance at 1.1045, which is likely to be passed. Since the 45th degree is found at 1.1042, we are expecting a correction from it and a drop to 1.1014 in the American session. There is no important news on the calendar, which can majorly influence the euro.

By Alpari.com

China’s Pioneering Effort to Contain Virus Outbreak

Economic and Human Costs of the New Coronavirus

By Dan Steinbock     

Chinese government has used strong measures to contain the spread of the coronavirus outbreak in Wuhan. The human costs and economic impact will depend on the eventual diffusion and infectiousness of the new virus.

As the number of the infected continues to accelerate and evidence of human-to-human transmission has been discovered in and outside China, the World Health Organization (WHO) declared global health emergency.

During the weekend, Philippines confirmed the first novel coronavirus death outside China.

The inconvenient truth is that the Wuhan outbreak is neither the first nor the last of its kind. However, China’s effort to reduce fatalities in megacities is a pioneering one.

Despite enhanced capabilities, new risks

After the outbreak of a new coronavirus – the 2019 novel coronavirus acute respiratory disease (2019-nCoV ARD) – and evidence of human-to-human transmission, China’s central government urged people to stay at home, restricted travel and cancelled major public events. That caused travel to plunge during the Lunar New Year, but likely saved countless lives. Moreover, China has extended the holiday period to keep people at home and reduce the risk of the spread, while extending several billions of dollars to help contain the virus.

While the full effect of the outbreak on the Chinese and the global economy is too early to assess, probable impact scenarios can be assessed.

Internationally, markets have usually responded to virus outbreaks with sharp but temporary early reactions until the spread has been halted. With the new coronavirus, analysts initially relied on the Severe Acute Respiratory Syndrome (SARS) in 2002-3, as a guideline to these projections. But that was premature.

In the early 2000s, China’s efforts to control SARS were criticized as the disease spread internationally before the global outbreak was subdued. A decade later, Chinese response to the Avian influenza (H7N9) was significantly faster, broadly praised and the disease did not spread widely.

In recent years, China has significantly strengthened its national and local surveillance systems to prevent and control diseases. Laboratory and hospital capacity have been significantly reinforced. The record in emergency management is varied at local level, however. In the case of the new coronavirus, Chinese authorities alerted relatively quickly outside bodies, including the WHO.

Despite improved Chinese capabilities, there are now new risks, due to greater global integration. In 2003, China’s air, rail and road travel was only a fraction of what it is now and most Chinese lived in the countryside. Today, China has the world’s largest logistical hubs and 60% of people reside in densely-populated cities. That’s the reason for the effort to insulate Wuhan and its 11 million people, Hubei province, and other proximate urban centers, altogether 56 million people – which is comparable to the population of South Korea or South Africa.

The timing also differs. Unlike SARS, the current outbreak took place right before the Chinese Lunar New Year, which is accompanied by the world’s largest human migration. That’s why the government took extraordinary measures to reduce the risk of accelerated spread, which may set a new norm for the struggle against epidemics in megacities.

Early human costs

During the SARS outbreak, 8,100 people worldwide were infected, while 774 died mainly in Chinese mainland and Hong Kong; 10% of the total. Transmissibility, which is measured by the basic reproduction number (the number of people a newly-infected person is likely to pass the virus to), was about 2-5.

With the new coronavirus, there are currently (12.00 Wuhan time, Feb 2) 14,551 confirmed cases around the world, while 304 have died; 2.1% of the total. Assuming present pace, the number of the cases will exceed 20,000 soon. According to early evidence, the reproduction number is 3.3-5.5. Despite similar transmissibility, mortality rate in coronavirus seems to be a fifth relative to SARS (11%) and far lower relative to the Middle East Respiratory Syndrome MERS (35%).

Importantly, the mortality rate is relatively highest in Wuhan (5.5%). When the province of Hubei with its 58 million people is removed from the Chinese data, the national mortality rate plunges dramatically to 0.3%. If Chinese data is excluded from the international mortality rate, it plunges to zero (0%). Interestingly, no deaths have been reported outside the country, for now. Wuhan is the outbreak’s storm center.

And since symptoms may not show during the 2 to 14-day incubation period, it would seem to undermine the traditional containment practices because asymptomatic people could be spreading the disease undetected. That’s why some observers under-estimated the crisis in the early phases. If the new virus can be detected only after collateral damage, there is worse ahead, as Chinese authorities suggest.

There could be room for some hope, however. Recently, Zhong Nanshan, a renowned scientist at China’s National Health Commission, said he thought the outbreak “should reach a peak in a week or around ten days”; after the first week of or mid-February. Mortality rate could continue to fall, thanks to life support technology and extraordinary efforts by researchers and medical workers.

What analysts are now monitoring is the milestone when the number of new infections begins to decelerate because it could signal the turning point for sentiment as well. But that may still be some way ahead.

Early economic costs

In the Chinese mainland, the new coronavirus outbreak has already hit transportation, tourism and travel, restaurants and retail, which will impair near-term consumption data, while harming stocks most exposed to consumer markets.

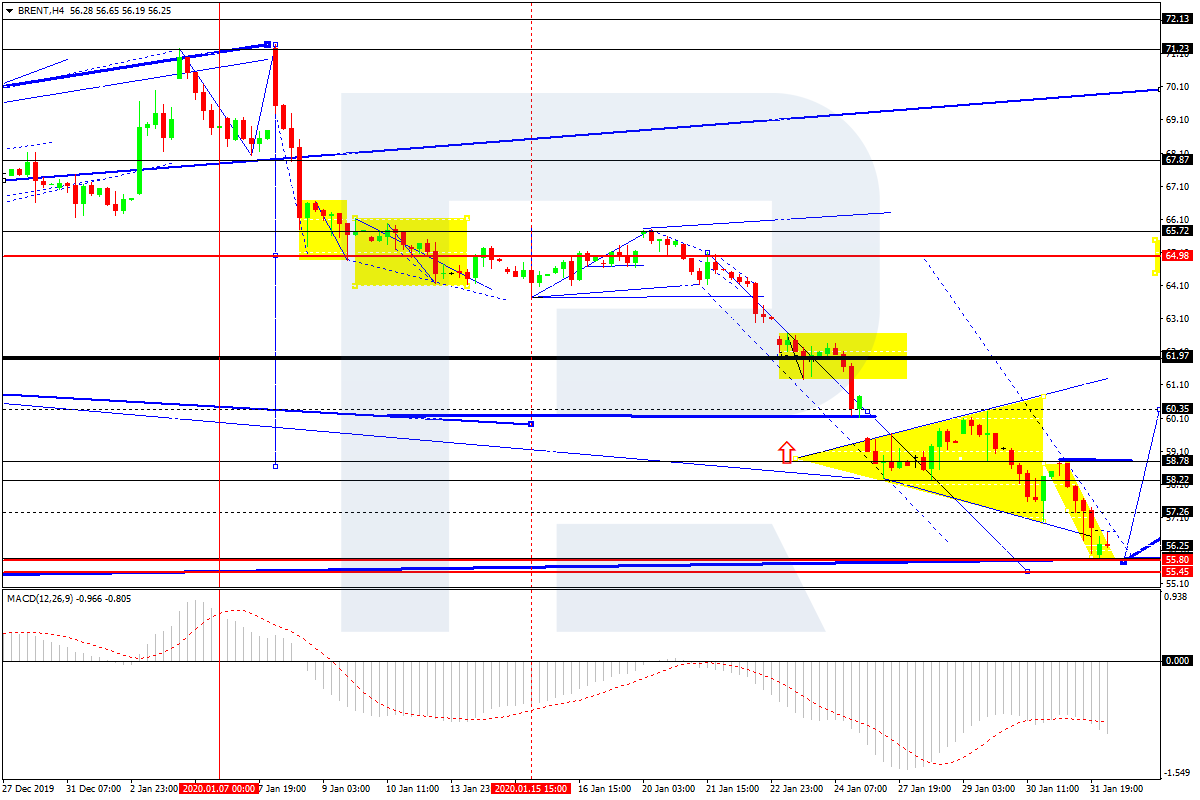
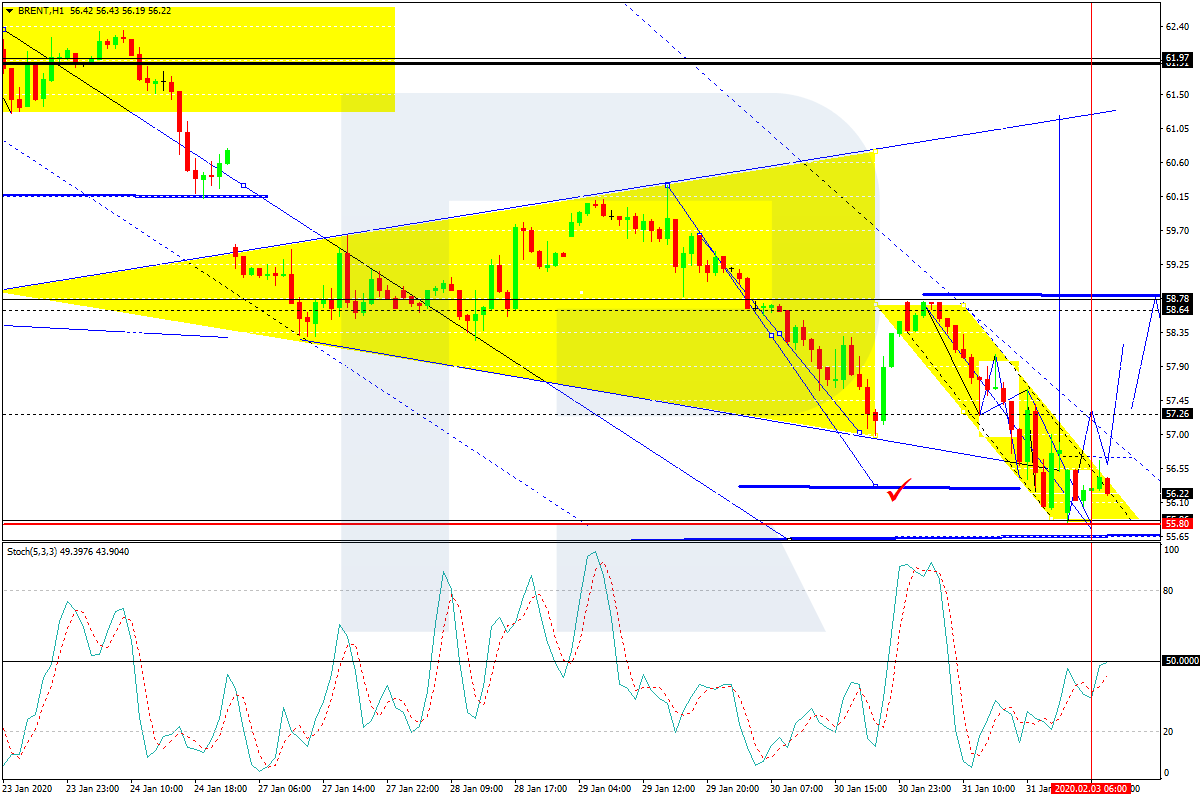
Globally, the early damage was first felt in commodities, which react fast to outbreaks when even small changes can cause a large plunge in prices penalizing the sales of jet fuel, diesel and gasoline. On January 3, crude oil was still trading at $64, but has since then plunged to $51.5; almost 20%. In light of the current data, the adverse impact is disproportionate, yet typical.

While all early impact scenarios are subject to great epidemiological uncertainty, economic damage in past outbreaks typically hits first household consumption and trade. It is likely to be compounded in huge regional hubs, such as Wuhan, “China’s Chicago.” Moreover, as the government response takes off, outbreak spending accelerates in emergency services. Yet, such measures, though critical for human lives, do not usually have a significant impact on the overall economy.

If outbreaks prove protracted, they may penalize companies’ capital expenditures, which are sensitive to demand expectations, and cause disruptions in supply chains as reduced mobility generates temporary outages. As Wuhan was positioned to record solid 7.8% growth in 2020, the outbreak damage in the city and broader region will have an impact on economic data.

Moreover, as the outbreak is still spreading across borders, global companies with broad presence in China, including US companies, have begun to suspend operations restricting travel. Meanwhile, the WHO has recommended against “measures that unnecessarily interfere with international trade or travel.”

Since stringent financial conditions in markets are likely to further amplify collateral damage and thereby risk aversion, such accelerated measures will soon begin to have an impact on global markets, as evidenced the 600-point plunge by Dow Jones last week.

Impact scenarios in China

Before the outbreak, China was moving toward a mild recovery. Despite US trade war, GDP growth amounted to 6.1% in 2019. Given progressive deceleration, which is normal after industrialization, China was expected to grow by 5.8%-6.2% in 2020.

Today, three scenarios prevail. In the “SARS-like impact scenario,” a sharp quarterly effect would be followed by a rebound in short order. The broader impact would be relatively low and regional. The impact on annualized growth would be relatively low.

In the “accelerated impact scenario,” the adverse impact would be steeper in terms of damage, while a rebound would follow only later. The impact on annual growth would prove more significant, along with the broader impact.

In the “disruptive impact scenario,” the adverse impact is harder to assess. Whether of natural or synthetic descent, the new coronavirus occurred in the worst time (before the largest human migration) in the worst place (huge regional hub).

Oddly enough, it is not the only recent anomaly. Last fall, African swine fever (ASF), which had never before seen in China but now mysteriously appeared with the onset of the US trade war, decimated half of China’s pigs, which doubled pork prices and contributed to inflation causing pricy US pork exports to double in China.

The odds for two such consequent anomalies, timing and location are exceedingly low. Yet both did occur in almost perfect sequence. The question is why and how.

For now, central government seeks to use maximum efforts to contain the outbreak of the novel coronavirus. Over time, it is likely to boost further national and local surveillance systems, and emergency management in megacities, while protecting China against potential external bio-threats that have destabilization potential.

 About the Author:

Dr. Dan Steinbock is an internationally recognized strategist of the multipolar world and the founder of Difference Group. He has served at the India, China and America Institute (USA), Shanghai Institutes for International Studies (China) and the EU Center (Singapore). For more, see https://www.differencegroup.net

This is the third updated/revised version of the original commentary, which was first published as an op-ed by China Daily on January 31, 2020.


Bitcoin price likely to rise until coronavirus peaks

By George Prior

Bitcoin’s price is likely to continue to rise until the coronavirus peaks, affirms the CEO of one of the world’s largest independent financial services and advisory organizations.

The comments from Nigel Green, chief executive and founder of deVere Group, comes as the price of the world’s most influential digital currency has gained more than 10 per cent in a week.

It is also up 30 per cent since the end of 2019, making 2020 the best start to the year for Bitcoin since 2012.

To date, there have been 17,335 confirmed cases of the potentially deadly Sars-like virus, including 362 deaths. Mainland China remains the epicentre of the outbreak, although cases have been reported in more than two-dozen countries including the UK, Japan, Thailand, the U.S., Spain, Australia and Germany.

Mr Green says: “The ongoing upward trajectory of the price of Bitcoin correlates to the spread of the coronavirus.

“The more individual cases that are identified, the more countries around the world that are affected, and the greater the impact on traditional financial markets, the higher the price of Bitcoin has jumped.

“In this regard, we can expect Bitcoin’s price is likely to continue to rise until the coronavirus peaks which, according to a prestigious research group in Hong Kong, is likely to be in late April or early May.”

He continues: “Why have investors been piling into Bitcoin recently?  Because it is increasingly regarded as a safe-haven asset in times of uncertainty.

“Bitcoin, known as ‘digital gold’, shares characteristics of the traditional yellow metal including being a store of value, scarce, being perceived as being resistant to inflation, and a hedge against turmoil in traditional markets – many of which have been pushed in a tailspin since the coronavirus outbreak.”

The deVere CEO says: “Whilst coronavirus and geopolitical tensions have certainly been underscoring the reputation of decentralised, non-sovereign, secure currencies, such as Bitcoin, as safe-havens, they are somewhat peripheral drivers for why cryptocurrencies are now regarded as the future of money.

“These key other factors include that they are digital, they are global, they solve real-life issues, big tech and institutional investors are coming off the sidelines, and worldwide demographics – the growth of the native digital generation – are on the side of crypto, meaning the future is, too.”

Mr Green concludes: “Whilst there will be minor peaks and troughs – as in all markets – I predict the overall trajectory of Bitcoin to remain upward until such time as coronavirus peaks.”

About:

deVere Group is one of the world’s largest independent advisors of specialist global financial solutions to international, local mass affluent, and high-net-worth clients.  It has a network of more than 70 offices across the world, over 80,000 clients and $12bn under advisement


Forex Technical Analysis & Forecast 03.02.2020 (EURUSD, GBPUSD, USDCHF, USDJPY, AUDUSD, USDRUB, USDCAD, GOLD, BRENT, BTCUSD)

Article By RoboForex.com

EURUSD, “Euro vs US Dollar”

EURUSD has completed the ascending impulse towards 1.1090; right now, it is consolidating around 1.1085. Possibly, the pair may form a new descending structure towards 1.1075 and then start another growth to return to 1.1085, thus forming an upside continuation pattern. If later the price breaks 1.1095 to the upside, the market may continue growing towards 1.1120; if 1.1075 to the downside – start a new correction with the target at 1.1057.

EURUSD
Risk Warning: the result of previous trading operations do not guarantee the same results in the future

GBPUSD, “Great Britain Pound vs US Dollar”

GBPUSD has returned to 1.3200; right now, it is consolidating above 1.3170. Possibly, the pair may form one more ascending structure towards 1.3215 and then start another correction with the target at 1.3100.

GBPUSD
Risk Warning: the result of previous trading operations do not guarantee the same results in the future

USDCHF, “US Dollar vs Swiss Franc”

After finishing the descending structure towards 0.9644, USDCHF is consolidating below this level. Possibly, today the pair may resume falling to break 0.9611 and then continue trading inside the downtrend with the target at 0.9592.

USDCHF
Risk Warning: the result of previous trading operations do not guarantee the same results in the future

USDJPY, “US Dollar vs Japanese Yen”

USDJPY has completed the descending structure at 108.56; right now, it is consolidating below this level. Today, the pair may expand the range down to 108.04. However, if the price breaks 108.57 to the upside, the market may start a new correction with the target at 108.91.

USDJPY
Risk Warning: the result of previous trading operations do not guarantee the same results in the future

AUDUSD, “Australian Dollar vs US Dollar”

After completing the descending structure towards 0.6682, AUDUSD is consolidating above it. Possibly, the pair may break this range to the upside and resume trading upwards with the target at 0.6730.

AUDUSD
Risk Warning: the result of previous trading operations do not guarantee the same results in the future

USDRUB, “US Dollar vs Russian Ruble”

USDRUB is moving upwards. Possibly, the pair may reach 64.15 and then form a new descending structure to break 63.60. Later, the market may resume trading downwards with the first target at 63.15.

USDRUB
Risk Warning: the result of previous trading operations do not guarantee the same results in the future

USDCAD, “US Dollar vs Canadian Dollar”

USDCAD is growing towards 1.3259. Possibly, today the pair may reach this level and then start a new decline towards 1.3222. If the price breaks this level to the downside, the market may continue the correction with the target at 1.3185.

USDCAD
Risk Warning: the result of previous trading operations do not guarantee the same results in the future

XAUUSD, “Gold vs US Dollar”

After finishing the impulse towards 1583.75 and forming another consolidation range around it, Gold has broken the range to the downside. Today, the pair may test 1583.75 from below and then resume trading downwards with the first target at 1574.57.

GOLD
Risk Warning: the result of previous trading operations do not guarantee the same results in the future

BRENT

After updating 55.83 and completing the ascending impulse towards 56.64, Brent has finished the correction at 56.05. Possibly, the pair may form one more ascending structure with the short-term target at 57.36.

BRENT
Risk Warning: the result of previous trading operations do not guarantee the same results in the future

BTCUSD, “Bitcoin vs US Dollar”

BTCUSD is consolidating around 9330.00. The main scenario implies that the pair may break the range to the upside and start a new growth with the short-term target at 10044.00. After that, the instrument may correct towards 8500.00.

BITCOIN

Article By RoboForex.com

Attention!
Forecasts presented in this section only reflect the author’s private opinion and should not be considered as guidance for trading. RoboForex LP bears no responsibility for trading results based on trading recommendations described in these analytical reviews.

Fibonacci Retracements Analysis 03.02.2020 (GOLD, USDCHF)

Article By RoboForex.com

XAUUSD, “Gold vs US Dollar”

As we can see in the H4 chart, XAUUSD continues forming the rising wave towards the current high at 1611.29 and then the post-correctional extension area between 138.2 and 161.8% fibo at 1599.45 and 1625.70 respectively. However, after reaching the high, the price may rebound from it and start a new decline towards 50.0% and 61.8% fibo at 1530.60 and 1511.80 respectively.

GOLD_H4
Risk Warning: the result of previous trading operations do not guarantee the same results in the future

In the H1 chart, the pair has reached 76.0% fibo. At the same time, there is a divergence on MACD, which indicates a new pullback to the downside. The target is the local support at 38.2% fibo (1564.75).

GOLD_H1
Risk Warning: the result of previous trading operations do not guarantee the same results in the future

USDCHF, “US Dollar vs Swiss Franc”

As we can see in the H4 chart, the correctional uptrend has reached 38.2% fibo at 0.9770; right now, the price is forming a new descending impulse towards the low at 0.9613. Later, the market may break the low and continue falling towards the post-correctional extension area between 138.2 and 161.8% fibo at 0.9520 and 0.9343 respectively.

USDCHF_H4
Risk Warning: the result of previous trading operations do not guarantee the same results in the future

In the H1 chart, USDCHF may break the low and then continue trading downwards to reach its short-term targets, which are inside the post-correctional extension area between 138.2 and 161.8% fibo at 0.9555 and 0.9518 respectively.

USDCHF_H1

Article By RoboForex.com

Attention!
Forecasts presented in this section only reflect the author’s private opinion and should not be considered as guidance for trading. RoboForex LP bears no responsibility for trading results based on trading recommendations described in these analytical reviews.

Oil Suffering from a Hell of a Pressure

By Dmitriy Gurkovskiy, Chief Analyst at RoboForex

Early in February, “black gold” prices remain weak, although right now bears aren’t as active as a bit earlier. On Monday, February 3rd, Brent is trading at 56.22 USD, which is the lowest level since January 3rd, 2019.

According to the report from Baker Hughes, the Oil Rig Count reduced by 1 unit down to 675 over a week by January 31st. The total Rig Count showed -3 units and is now equal to 790. We remind you that over the year 2019, the number of rigs in the United States decreased by almost 25%. The highest reading was in October 2014, 1,609 units.

Right now, the Oil is suffering from the news that the Chinese coronavirus outbreak is spreading much faster than expected. At the same time, announcements from Chinese authorities that they are going to “pump” a lot of money into the country’s economy in order to neutralize the negative effect couldn’t calm the current situation on the market.

As we can see in the H4 chart, Brent has reached the predicted downside target; right now, it is still consolidating near the lows. Possibly, the pair may continue moving downwards and finish this descending wave: its previous structure has almost reached the target. As a result, the price may start a new rising impulse at any moment; the first target is at 60.35. If later the market breaks this level, the instrument may continue growing towards 64.94. From the technical point of view, this scenario is confirmed by MACD Oscillator: its signal line is about to leave the histogram area and start a new growth. After the line breaks 0, the price may boost its rising movement.

In the H1 chart, after completing the descending wave, Brent has left the channel. The main scenario implies that the pair may form another rising impulse to reach 57.30 and then start a new correction towards 56.70, thus forming another consolidation range at the current lows. If later the price breaks 57.30 to the upside, the instrument may continue growing to reach 58.75. An alternative scenario implies that the pair may update 55.50 and then reverse to resume moving upwards. From the technical point of view, this scenario is confirmed by Stochastic Oscillator: its signal line is moving to the upside and trying to break 50. If it succeeds, the price may boost its growth.

Disclaimer

Any predictions contained herein are based on the authors’ particular opinion. This analysis shall not be treated as trading advice. RoboForex shall not be held liable for the results of the trades arising from relying upon trading recommendations and reviews contained herein.


A failed 2019 turned successful in 2020 – XRP’s sudden growth

By ForexNewsNow

2019 was not necessarily predicted to have been so successful for cryptocurrencies. During the months of May, June, and July most cryptos finally started to gain serious momentum in the market and were showing signs of the late 2017 hype that brought us a $20,000 Bitcoin.

However, the hype was simply not enough, nor was the reason for the market to continue growing. Thus Bitcoin, alongside every other altcoin plummeted down to a more sustainable price range, but still in a much better position than 2018.

One cryptocurrency that was not necessarily a part of the major 2019 hype was XRP, and it continued to do so up until the end of the year itself. In fact, the worst-performing XRP within the last two years was identified in December at $0.173 per coin. Now though, the coin has reached a price of $0.253 and is growing as we speak.

Could this trend continue well into February and potential let us see a $0.5 XRP once again? Well, let’s take a look.

24 months of failure behind

According to InvestingHaven’s XRP overview, every lengthy slump is pretty much guaranteed to end with an upward trend. And in the case of this cryptocurrency, we can pretty much say that this prediction was correct.

The price is up almost 50% from December alone, thus giving XRP the title of “best performing crypto of 2020” so far. Sure there’s almost the whole year to go for now, but we can’t argue that XRP truly did recover by a major margin.

Experts say that as long as XRP can maintain the resistance level at $0.261 and not falter in anticipation of challenging it, it’s very likely that the coin will reach 2019’s top price of $0.479 within a couple of weeks.

However, warnings have also flared saying that the support level at $0.247 is extremely fragile, thus creating an environment where a single fluke can tank the whole progress the coin has experienced so far.

By ForexNewsNow