Author Archive for InvestMacro – Page 100

EURUSD: price stabilising near the balance line

By Alpari.com

On Thursday, January 30, the euro was up at the close of trading. In the American session, the rate rose to 1.1039. This was down to the strengthening of the British pound against the US dollar, a reaction to announcements made by the Bank of England concerning interest rates.

The decided to keep the basic rate at 0.75% per annum and maintain the current duration of the government bond purchase program. It had been expected that three members of the Monetary Policy Committee would vote for the rate to be cut, in fact only two voted for a cut. Also, interest rate futures showed a probability of a 25bp decrease, which did not happen. Bank of England Governor Mark Carney said the rate cut many investors predicted would increase inflation above a key level. The regulator’s report notes that after the December parliamentary elections, there has been an acceleration in economic growth.

Q4 GDP coincided with market expectations. Investors were disappointed that the US economy showed sluggish annual growth. After the Bank of England meeting, the report had a mild impact on the foreign exchange market.

Today’s news (GMT+3):

  • 09:30 France: Gross Domestic Product (QoQ) (Q4).
  • 10:30 Switzerland: Real Retail Sales (YoY) (Dec).
  • 12:30 UK: Net Lending to Individuals (MoM) (Dec), Mortgage Approvals (Dec).
  • 13:00 Eurozone: Gross Domestic Product s.a. (QoQ) (Q4), Consumer Price Index (YoY) (Jan).
  • 16:30 Canada: Gross Domestic Product (MoM) (Nov).
  • 16:30 USA: Core Personal Consumption Expenditure – Price Index (MoM) (Dec), Personal Spending (Dec), Personal Income (MoM) (Dec).
  • 17:45 USA: Chicago Purchasing Managers’ Index (Jan), Michigan Consumer Sentiment Index (Jan).
  • 21:00 USA: Baker Hughes US Oil Rig Count.

Рис. 1Current situation:

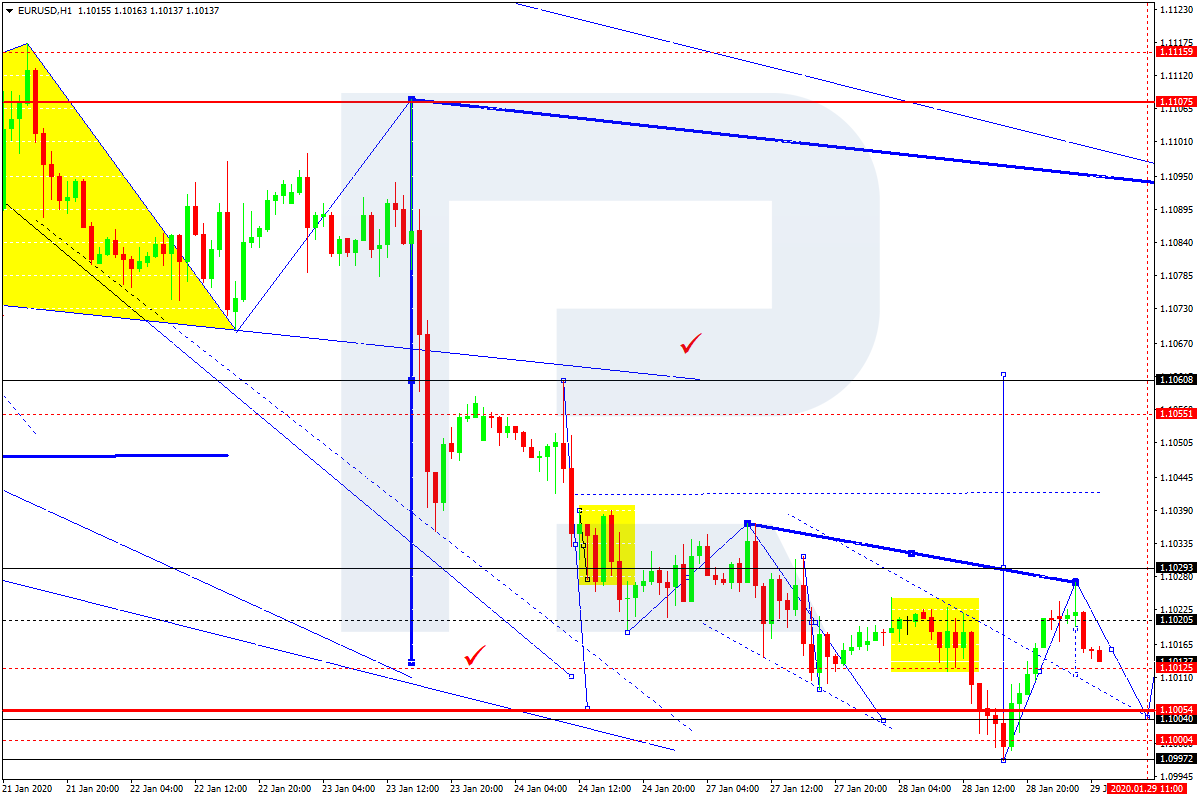
Expectations for yesterday’s movement were fully justified. The price technically recovered to the trend line (1.1039), from which it returned to the 1.1017 mark. The pullback amounted to 50% of the growth from 1.0992 to 1.1039. The 50-percent level was strengthened by the balance line. At the time of writing, the euro is worth 1.1023. Technically, continued growth should be considered, however today is Friday, and given the difficult situation in China, pressure on the euro may increase. According to the latest data published by the Ministry of Health of the People’s Republic of China, the number of people infected with viral pneumonia has reached 9,776 people (+25.6%). The number of deaths from the disease rose to 213 (+25.2%).

At an emergency meeting, the World Health Organization (WHO) recognized the novel coronavirus as a international emergency. Many airlines around the world decided to partially cancel flights to China.

The background news isn’t helpful for the single currency, but according to technical analysis, growth should be considered. Since the stochastic is in the oversell (buy) zone, according to the forecast, we can expect growth to the trend line, before seeing a decline back down to 1.1008 in the US session.

It is not known how market participants will react to the publication of the Eurozone Q4 GDP data and Consumer Price Index for January, which will be released at 13:00 Moscow time. Both will have a strong impact on the market.

By Alpari.com

Silver Prepares For Next Leg Higher

By TheTechnicalTraders.com

Following up on some of our recent metals research, we wanted to alert our friends and followers to the incredible opportunity that still exists in Silver.  We’ve highlighted two of our more recent articles for reference and review, below.  Silver continues to be one of the most incredible opportunities for 2020 and Silver Miners (SIL) could explode to the upside as the price of Silver rallies to close the gap between the Gold to Silver ratio.

Our researchers believe Silver is currently undervalued, compared to Gold, by at least 240%.  Historically, the Gold to Silver ratio averages a 10+ year rotational range of between 63 to 67.  This means that through both peaks and troughs, ranging from the high 80s to mid-90s to the low 30s to mid-40s, on average the middle price range level for this ratio is near 65.  Currently, this Gold to Silver ratio is 88.4.

Gold is currently trading at $1590 – just below the recent peak near $1613.  We believe that Gold will continue to rally higher, breaking the $1613 level, and continue higher targeting the $1750 level over the next few months.  Eventually, within 2020, we believe Gold will continue to rally higher breaking the $2100 price level.

This continued upside price action in Gold, while Silver has really yet to see any massive upside price movement, continues to create a massive price disparity between Gold and Silver – which is highlighted in the Gold to Silver ratio.  As Gold rallies, Silver must begin to move dramatically higher in order to close this price disparity between the value of Gold to Silver.  Historically, we believe the rally in Silver will force the Gold to Silver Ratio to fall to near the 65 level.  This would represent a massive 70% to 120%+ rally in the price of silver – targeting $24.50 to 32.50.

Gold and Silver Ratio Weekly Chart

If the Gold to Silver Ratio falls below the 65 level and targets lower ratios, as has happened in the past, then Silver may rally as high as $45 to $55 per ounce while Gold stays below $1800.  If Gold does rally above $2000, as we expect, the true potential for Silver experiencing a major price reversion event could be as high as $60+ per ounce.

Please take a minute to read some of our previous research posts regarding the metals markets here:

January 14, 2020: SILVER TRADERS BIG TREND ANALYSIS – PART II

December 30, 2019: METALS & MINERS PREPARE FOR AN EARLY 2020 LIFTOFF

Daily Price Of Silver Chart

This Daily Silver chart highlights what we believe will be the next move higher in Silver.  The next upside price advance should target the $21 to $23 level as Silver attempts to revalue compared to the price of Gold.  Near this $23 level, Silver should stall briefly before attempting to move much higher.  The reality is that once this revaluation event begins to take place in Silver, we believe it will prompt an extended price rally that could last well into 2023-2024.

Price of Silver Weekly Chart

This Weekly Silver chart highlights our research team’s expectations related to Silver over the next 6+ months.  At first, we believe the $21 to $23 level will become the target.  Then, a short period of price rotation will find support near $21 before another upside price leg pushes silver above $24.  Remember, if Gold continues to rally higher, these expectations could extend 5% to 10% in size and scale.

Silver Miners Sector ETF – Weekly Chart

Another key component of this move is the opportunity in Silver Miners.  This SIL Weekly chart highlights the real potential for a 20% to 30% upside price rally related to the expected price revaluation/reversion event we have been describing for Silver.  Miners are an excellent correlative component for skilled traders expecting a move like this in the metals market.

Learn how we can help you find and execute better trades and turn the extreme volatility into solid profits.  Read our research and see what our research team has been predicting over the past few months.  We dedicate our efforts to helping you find great trades and helping you protect your assets.

oin my ETF Trade Alert Newsletter – Wealth Building Newsletter if you like what you read here and ride my coattails as I navigate these financial markets and build wealth while others lose nearly everything they own.

Chris Vermeulen
TheTechnicalTraders.com

NOTICE: Our free research does not constitute a trade recommendation or solicitation for our readers to take any action regarding this research.  It is provided for educational purposes only.  Our research team produces these research articles to share information with our followers/readers in an effort to try to keep you well informed.  Visit our web site to learn how to take advantage of our members-only research and trading signals.


Ichimoku Cloud Analysis 30.01.2020 (AUDUSD, NZDUSD, USDCAD)

Article By RoboForex.com

AUDUSD, “Australian Dollar vs US Dollar”

AUDUSD is trading at 0.6736; the instrument is moving below Ichimoku Cloud, thus indicating a descending tendency. The markets could indicate that the price may test the cloud’s downside border at 0.6765 and then resume moving downwards to reach 0.6615. Another signal to confirm further descending movement is the price’s rebounding from the resistance level. However, the scenario that implies further decline may be canceled if the price breaks the cloud’s upside border and fixes above 0.6845. In this case, the pair may continue growing towards 0.6935.

AUDUSD
Risk Warning: the result of previous trading operations do not guarantee the same results in the future

NZDUSD, “New Zealand Dollar vs US Dollar”

NZDUSD is trading at 0.6508; the instrument is moving below Ichimoku Cloud, thus indicating a descending tendency. The markets could indicate that the price may test the cloud’s downside border at 0.6545 and then resume moving downwards to reach 0.6395. Another signal to confirm further descending movement is the price’s rebounding from the descending channel’s upside border. However, the scenario that implies further decline may be canceled if the price breaks the cloud’s upside border and fixes above 0.6595. In this case, the pair may continue growing towards 0.6685.

NZDUSD
Risk Warning: the result of previous trading operations do not guarantee the same results in the future

USDCAD

USDCAD is trading at 1.3202; the instrument is moving above Ichimoku Cloud, thus indicating an ascending tendency. The markets could indicate that the price may test the cloud’s upside border at 1.3150 and then resume moving upwards to reach 1.3305. Another signal to confirm further ascending movement is the price’s rebounding from the support level. However, the scenario that implies further growth may be canceled if the price breaks the cloud’s downside border and fixes below 1.3075. In this case, the pair may continue falling towards 1.2995.

USDCAD

Article By RoboForex.com

Attention!
Forecasts presented in this section only reflect the author’s private opinion and should not be considered as guidance for trading. RoboForex LP bears no responsibility for trading results based on trading recommendations described in these analytical reviews.

Japanese Candlesticks Analysis 30.01.2020 (USDCAD, AUDUSD)

Article By RoboForex.com

USDCAD, “US Dollar vs Canadian Dollar”

As we can see in the H4 chart, after completing another growth and forming Shooting Star pattern, the pair has reversed. The current situation implies that USDCAD may form a slight correction and then resume growing towards 1.3240. after that, the instrument may start a new decline to reach 1.3153 to continue forming the ascending channel.

USDCAD
Risk Warning: the result of previous trading operations do not guarantee the same results in the future

AUDUSD, “Australian Dollar vs US Dollar”

As we can see in the H4 chart, the pair has completed another decline: it has formed several reversal patterns, such as Hammer, not far from the channel’s downside border. Right now, AUDUSD is starting to reverse; the upside target may be at 0.6800. However, we shouldn’t ignore an alternative scenario, which implies that the instrument may continue falling towards 0.6688 without reversing and forming another rising wave.

AUDUSD

Article By RoboForex.com

Attention!
Forecasts presented in this section only reflect the author’s private opinion and should not be considered as guidance for trading. RoboForex LP bears no responsibility for trading results based on trading recommendations described in these analytical reviews.

BoE DECISION: Pound up, FTSE down – but sit tight and wait for Budget, investors warned

By George Prior

The pound strengthens and the FTSE faces losses on the Bank of England’s decision to leave interest rates unchanged – but investors should sit tight and wait for the 2020 Budget in March.

This is the warning from the founder and CEO of deVere Group, Nigel Green, as the UK’s central bank announced it is keeping interest rates at the current 0.75%.

Mr Green notes: “As the market had widely expected, the Bank of England voted to maintain the interest rate at 0.75%.

The decision was made, we can assume, because the underlying economic data is ambiguous rather than compelling, and we have yet to see how much fiscal expansion the government is set to do.

“The announcement has caused the pound to strengthen and FTSE 100, the UK’s leading stock index, to take a mild hit because of the translation effect of a stronger sterling on overseas earnings.

“However, within 24 hours of the Bank of England’s announcement, any market impact will likely be forgotten. As such, investors should sit tight.”

He continues: “The Bank of England is waiting for the Budget in March. The Chancellor Sajid Javid is promising an ‘infrastructure revolution’ – which will take years to heat up the economy as spending on that is slow to come through.

“But there could be more immediate fiscal sweeties, leading to inflation fears, such as tax cuts and increased current spending on public services, including health, defence and police.

“An expansionary fiscal policy carries with it greater uncertainty over inflation and growth. The BoE will want to keep their powder dry to address this.”

Mr Green goes on to add: “For investors, and particularly those interested in sterling, it will be the Bank of England’s response to a potentially expansionary fiscal policy that is the story of 2020. And for this, they have to sit tight until March.”

About:

deVere Group is one of the world’s largest independent advisors of specialist global financial solutions to international, local mass affluent, and high-net-worth clients.  It has a network of more than 70 offices across the world, over 80,000 clients and $12bn under advisement

The Analytical Overview of the Main Currency Pairs on 2020.01.30

by JustForex

The EUR/USD currency pair

Technical indicators of the currency pair:
  • Prev Open: 1.10222
  • Open: 1.10084
  • % chg. over the last day: -0.08
  • Day’s range: 1.10074 – 1.10181
  • 52 wk range: 1.0879 – 1.1572

EUR/USD currency pair continues to trade in a flat. There is no defined trend. Investors assess the results of the Fed meeting. As expected, the regulator kept the key interest rate range at 1.50%-1.75%. The central bank noted the stability of the labor market. The Fed officials plan to adhere to the current monetary policy rate. Inflation will act as the main factor determining future changes in interest rates. At the moment the trading instrument is consolidating in the range of 1.10000-1.10300. Technical correction of EUR/USD quotes is not excluded in the nearest future. Open positions from key levels.

The Economic News Feed for 30.01.2020:

  • – Labour Market Report (GER) – 10:55 (GMT+2:00);
  • – GDP Report (US) – 15:30 (GMT+2:00);
EUR/USD

Indicators do not give accurate signals: the price has crossed 50 MA and 100 MA.

The MACD histogram is near the 0 mark.

The Stochastic Oscillator is located in the neutral zone, the %K line has crossed the %D line. There are no signals at the moment.

Trading recommendations
  • Support levels: 1.10000, 1.09700
  • Resistance levels: 1.10350, 1.10600, 1.10750

If the price fixes above 1.10300, expect a correction toward 1.10600-1.10750.

Alternatively, the quotes can descend toward 1.09700-1.09500.

The GBP/USD currency pair

Technical indicators of the currency pair:
  • Prev Open: 1.30271
  • Open: 1.30186
  • % chg. over the last day: -0.05
  • Day’s range: 1.30061 – 1.30250
  • 52 wk range: 1.1959 – 1.3516

At the moment GBP/USD quotes are consolidating. The technical picture is ambiguous. Sterling tests the local support and resistance levels at 1.29900 and 1.30250, respectively. The European Parliament approved the agreement on UK’s exit from the EU. At the moment investors have taken a waiting position before the Bank of England meeting. The regulator is expected to keep the main parameters of monetary policy at the same level. We recommend you to pay attention to the comments made by the Central Bank representatives. Open positions from key levels.

At 14:00 (GMT+2:00) the Bank of England will announce its decision on key interest rate.

GBP/USD

Indicators do not give accurate signals: the price has crossed 50 MA.

MACD histogram is near the 0 mark.

The Stochastic Oscillator is located near the oversold area, the %K line is below the %D line, which gives a weak sell signal for GBP/USD.

Trading recommendations
  • Support levels: 1.29900, 1.29650
  • Resistance levels: 1.30250, 1.30650, 1.31000

If the price fixes below 1.29900, expect the quotes to fall toward 1.29600-1.29400.

Alternatively, the quotes could grow toward 1.30700-1.31000.

The USD/CAD currency pair

Technical indicators of the currency pair:
  • Prev Open: 1.31550
  • Open: 1.31974
  • % chg. over the last day: +0.33
  • Day’s range: 1.31882 – 1.32137
  • 52 wk range: 1.2949 – 1.3566

The USD/CAD currency pair continues to show positive dynamics. The trading instrument has set new local highs. At the moment the CAD is testing resistance level 1.32200. 1.31900 is the nearest support. We do not rule out further growth of USD/CAD quotes. The Canadian dollar is under pressure from the prolonged decline of oil prices. Today, we recommend you to pay attention to the economic releases from Canada. Open positions from key levels.

The news background on the Canadian economy is calm.

USD/CAD

The indicators signal the strength of buyers: the price has fixed above 50 MA and 100 MA.

MACD histogram is in the positive zone, which indicates a bullish sentiment.

The Stochastic Oscillator is in the neutral zone, the %K line crosses the %D line. No signals at the moment.

Trading recommendations
  • Support levels: 1.31900, 1.31550, 1.31350
  • Resistance levels: 1.32200, 1.32500

If the price fixes above 1.32200, expect the quotes to grow toward 1.32500-1.32700.

Alternatively, the quotes could correct toward 1.31600-1.31400.

The USD/JPY currency pair

Technical indicators of the currency pair:
  • Prev Open: 109.120
  • Open: 108.983
  • % chg. over the last day: -0.13
  • Day’s range: 108.823 – 109.064
  • 52 wk range: 104.45 – 113.53

USD/JPY currency pair is still in sideways movement. There is no unidirectional trend. At the moment, the trading instrument is testing the key support at 108.800 USD/JPY. 109.100 is the nearest resistance. USD/JPY quotes have a potential to fall. Today we recommend you to pay attention to the statistical data on the US economy. Open positions from key levels.

The publication of important economic reports from Japan is not planned.

USD/JPY

The indicators signal the sellers’ strength: the price has fixed below 50 MA and 100 MA.

The MACD histogram is in the negative zone, which indicates a bearish mood.

The Stochastic Oscillator is in the neutral zone, the %K line started crossing the %D line. There are no signals at the moment.

Trading recommendations
  • Support levels: 108.800, 108.500
  • Resistance levels: 109.100, 109.250, 109.650

If the price fixes below 108.800, expect the quotes to fall toward 108.500-108.300.

Alternatively, the quotes could grow toward 109.300-109.600.

by JustForex

Meetings of Key Central Banks Are in the Focus of Attention

by JustForex

The US dollar strengthened slightly against a basket of major currencies during yesterday’s trading session. The dollar index (#DX) closed in the green zone (+0.02%). The Fed decided on a key interest rate. As expected, the regulator left the indicator unchanged at 1.50% -1.75%. Fed Chairman Powell pointed to the power of the economy, but also expressed concern about the uncertainty caused by the Chinese coronavirus as well. The regulator also made it clear that it did not happy with low inflation and wanted to see an increase in the indicator to the target level. The central bank plans to adhere to the current monetary policy.

The European Parliament gave Brexit the last necessary endorsement, allowing Britain to exit from the EU finally. After an emotional debate, lawmakers approved the Brexit agreement. Britain will leave the bloc, which it entered in 1973, on the night of Friday to Saturday. Following this, a transitional period will begin, which will last until the end of the year. And soon new negotiations on further relations between London and Brussels will start. At the moment, financial market participants have taken a wait-and-see attitude before the Bank of England meeting. We recommend paying attention to the comments by regulator officials.

The “black gold” prices continue to decline. At the moment, futures for the WTI crude oil are testing the $52.40 per barrel mark.

Market Indicators

Yesterday, there was a variety of trends in the US stock market: #SPY (-0.08%), #DIA (+ 0.00%), #QQQ (+ 0.16%).

The 10-year US government bonds yield fell again. At the moment, the indicator is at the level of 1.56-1.57%.

The Economic News Feed for 30.01.2020:
  • – Data on German labor market at 10:55 (GMT+2:00);
  • – Bank of England interest rate decision at 14:00 (GMT+2:00);
  • – US GDP data at 15:30 (GMT+2:00).

by JustForex

Are We Setting Up For A Waterfall Selloff?

By TheTechnicalTraders – Most traders understand what a “Waterfall event” is if you’ve been trading for more than 3 years.  Nearly every downside price reversion event initiates in a breakdown event (the first tier of the waterfall event) which is followed by additional deeper waterfall price collapses.  Almost like price breaks lower, finds support, settles near support, then breaks lower targeting deeper price support levels.

SPY Daily Chart

This example SPY chart from October 2018 through December 2018 highlights this type of event almost perfectly.  With each tier in the waterfall event, price searches for new support levels as price weakness drives price lower throughout each breakdown event.  We’ve highlighted these breakdown events with the MAGENTA lines drawn on this chart.

The recent downside price rotation after the world was alerted to the Wuhan virus presented a very clear “first-tier” waterfall event.  This first move lower is often rather condensed in size and scope – yet often within days of this first event, a bigger second downside waterfall event takes place confirming the bearish breakdown has momentum.  We believe this first move lower could be the first real tier in a broader global market waterfall event which may result in a much deeper price reversion event.

We believe the total scope of the Wuhan virus will not be known for at least another 20 to 30+ days.  After that span of time, we’ll know where and how aggressive this pandemic event has spread and what real capabilities we have for containment.  Therefore, we believe the downside price concern within the global markets is very real and just starting.

Very much like what happened in October 2018, the initial downside price move initiated on the US fed news and expectations.  When the Fed announced a rate cut, which shocked the markets, investors waited to see how the markets would react and within only 5+ days, the markets reacted violently to the downside.

Friday, January 24 was the “trigger date” for the breakdown in global markets from the news of the Wuhan virus.  We believe any further downside risk to the global markets will be known within another 5 to 10+ trading days – as more information related to the spread and containment capabilities of the virus are known.  Therefore, we are attempting to alert our followers and friend to the very real potential of a price breakdown event, a “Waterfall Event”, that may be set up in the global markets.

Daily Transportation Index Chart

This Daily TRAN chart highlights the recent breakdown in price that could be considered the first tier of the waterfall event.  The support level, highlighted in LIGHT BLUE, suggests price may attempt to stall near 10,800 before any further price breakdown happens.  A second waterfall tier could push the price well below the 10,000 level as the next real support exists near 9,9250.

Daily 400 Midcap Index Chart

This Daily MC (S&P 400 MidCap) futures chart highlights a similar price pattern.  The initial breakdown tier is very clearly illustrated where the price fell to immediate support near 2050.  We believe any further waterfall tier even may push the price below the 2000 level and target real support near 1952.

Daily Financial Sector Index Chart

This XLF (Financial Sector SPDR ETF) Daily chart, again, highlights the first tier breakdown in the price of the potential Waterfall event.  This is actually one of the clearest examples of how price operates within this type of rotation.  The initial downside tier broke through support near $30.00 and has begun to rally back above this level.  The LIGHT BLUE highlighted support range shows us where the first tier may stall.  Any further breakdown in price may push the price below the $28.50 level as price searches for new support.

We’ve referenced the 1855 “Third Plague Event” that hit in China and quickly spread to India, SE Asia, and other neighboring countries as an example of what may happen with the Wuhan virus.  The 1855 event killed over 15 million people (nearly 1.25% of the total global population at the time) and lasted until 1960 when the Plague cases dropped below 200.

We urge all traders and investors to prepare for a broader downside market event in the future – possibly a “waterfall event”. We’ll know more about the size and scope of this potential pandemic within 30+ days – but this may become a much bigger issue across the globe very quickly.  The volatility this event may create in the global markets is an ideal setup for skilled technical traders.  In the last week, we locked in profits on two trades SSO for 6.5% and TLT for 3%. Learn how we can help you find and execute great trades related to this wildly volatile event.

Join my ETF Trade Alert Newsletter – Wealth Building Newsletter if you like what you read here and ride my coattails as I navigate these financial markets and build wealth while others lose nearly everything they own.

Chris Vermeulen
TheTechnicalTraders.com

NOTICE: Our free research does not constitute a trade recommendation or solicitation for our readers to take any action regarding this research.  It is provided for educational purposes only.  Our research team produces these research articles to share information with our followers/readers in an effort to try to keep you well informed.  Visit our web site to learn how to take advantage of our members-only research and trading signals.


Fibonacci Retracements Analysis 29.01.2020 (GBPUSD, EURJPY)

Article By RoboForex.com

GBPUSD, “Great Britain Pound vs US Dollar”

As we can see in the H4 chart, GBPUSD is still correcting and forming Triangle pattern. After attempting to break the resistance, the pair is returning to 38.2% fibo at 1.2883. The downside target is the low at 1.2904. If the price breaks this level, the instrument may continue falling towards 50.0% and 61.8% fibo at 1.2856 and 1.2700 respectively.

GBPUSD_H4
Risk Warning: the result of previous trading operations do not guarantee the same results in the future

The H1 chart shows a new descending wave after the divergence on MACD. The price is moving towards mid-term 50.0% fibo (1.2855), which is inside the post-correctional extension area between 138.2 and 161.8% fibo at 1.2882 and 1.2832 respectively.

GBPUSD_H1
Risk Warning: the result of previous trading operations do not guarantee the same results in the future

EURJPY, “Euro vs. Japanese Yen”

As we can see in the H4 chart, the correctional downtrend has stopped at 38.2% fibo. After testing and breaking this level, the decline may continue towards 50.0% and 61.8% fibo at 119.36 and 118.55 respectively. The resistance is at 121.21.

EURJPY_H4
Risk Warning: the result of previous trading operations do not guarantee the same results in the future

The H1 chart shows a new pullback after the convergence on MACD. The targets are 23.6%, 38.2%, and 50.0% fibo at 120.53, 120.98, and 121.34 respectively. The support is the low at 119.80.

EURJPY_H1

Article By RoboForex.com

Attention!
Forecasts presented in this section only reflect the author’s private opinion and should not be considered as guidance for trading. RoboForex LP bears no responsibility for trading results based on trading recommendations described in these analytical reviews.

Forex Technical Analysis & Forecast 29.01.2020 (EURUSD, GBPUSD, USDCHF, USDJPY, AUDUSD, USDRUB, USDCAD, GOLD, BRENT, BTCUSD)

Article By RoboForex.com

EURUSD, “Euro vs US Dollar”

EURUSD has completed the ascending impulse; right now, it is correcting. Possibly, the pair may fall to reach 1.1012 or even 1.1004. Later, the market may resume trading upwards to break 1.1026 and then continue growing with the short-term target at 1.1053.

EURUSD
Risk Warning: the result of previous trading operations do not guarantee the same results in the future

GBPUSD, “Great Britain Pound vs US Dollar”

GBPUSD has finished another descending structure towards 1.2975; right now, it is correcting. Today, the pair may reach 1.3040 and then resume falling with the target at 1.2957.

GBPUSD
Risk Warning: the result of previous trading operations do not guarantee the same results in the future

USDCHF, “US Dollar vs Swiss Franc”

USDCHF has completed the ascending wave towards 0.9735; right now, it is consolidating above 0.9715. If later the price breaks this range to the upside, the market may form one more ascending structure to reach 0.9753; if to the downside – start a new correction with the target at 0.9695.

USDCHF
Risk Warning: the result of previous trading operations do not guarantee the same results in the future

USDJPY, “US Dollar vs Japanese Yen”

USDJPY is growing to break 109.16. Possibly, today the pair may continue this correction towards 109.57 and then form a new descending structure to return to 109.16. After that, the instrument may grow to reach 109.60 and then resume trading inside the downtrend with the short-term target at 108.22.

USDJPY
Risk Warning: the result of previous trading operations do not guarantee the same results in the future

AUDUSD, “Australian Dollar vs US Dollar”

AUDUSD is correcting upwards to reach 0.6844. Today, the pair may form the first structure of this correction with the target at 0.6790.

AUDUSD
Risk Warning: the result of previous trading operations do not guarantee the same results in the future

USDRUB, “US Dollar vs Russian Ruble”

USDRUB is forming the first descending wave with the target at 62.08. According to the main scenario, the price is expected to reach it and then start a new correction towards 62.60.

USDRUB
Risk Warning: the result of previous trading operations do not guarantee the same results in the future

USDCAD, “US Dollar vs Canadian Dollar”

USDCAD is forming the first descending wave with the target at 1.3148. Possibly, the pair may reach this level and then start another correction towards 1.3178.

USDCAD
Risk Warning: the result of previous trading operations do not guarantee the same results in the future

XAUUSD, “Gold vs US Dollar”

After reaching 1565.55 and then forming another consolidation range around 1568.87, Gold has broken it to the downside. Possibly, the pair may continue falling with the target at 1560.43. However, if the price breaks the range to the upside, the market may start a new correction to reach 1576.9 and then resume trading downwards with the above-mentioned target.

GOLD
Risk Warning: the result of previous trading operations do not guarantee the same results in the future

BRENT

After finishing the ascending impulse towards 59.76, Brent is trying to break its top. Possibly, the pair may continue growing to reach 60.80. An alternative scenario implies that the price may break 59.60 and start a new correction towards 58.88. After that, the instrument may form one more ascending structure with the target at 61.25.

BRENT
Risk Warning: the result of previous trading operations do not guarantee the same results in the future

BTCUSD, “Bitcoin vs US Dollar”

After forming the consolidation range below 9153.00, BTCUSD has broken it to the upside. The main scenario implies that the pair may reach 9350.00 and then resume falling to test 9153.00 from above. After that, the instrument may start a new growth with the target at 9500.00.

BITCOIN

Article By RoboForex.com

Attention!
Forecasts presented in this section only reflect the author’s private opinion and should not be considered as guidance for trading. RoboForex LP bears no responsibility for trading results based on trading recommendations described in these analytical reviews.