Author Archive for InvestMacro – Page 101

Markets will be rattled if witnesses called for Trump impeachment trial

By George Prior

Calling witnesses – including former national security adviser John Bolton – to President Trump’s impeachment trial is likely to cause short-term volatility in financial markets.

This is the warning from Tom Elliott, International Investment Strategist at deVere Group, one of the world’s largest independent financial advisory and services organizations.

It comes as the impeachment trial reaches a critical stage, with seemingly growing support to have witnesses called to the Senate.

Mr Elliott comments: “It was assumed that Trump’s impeachment trial would be done and dusted this week.

“However, in light of revelations from former national security adviser John Bolton’s draft book manuscript that Trump confirmed to him U.S. security support to Ukraine was based on the condition of investigations into political opponents, the conclusion and timings are now less certain due to the increasing calls for witnesses.

“At least two Republican senators are indicating that they are in favor of wanting to hear from witnesses, including Bolton.”

He continues: “Financial markets don’t want a drawn-out impeachment trial. They want certainty, especially as investors are already nervous because of the Coronavirus outbreak.

“Some sectors are more at risk of a longer impeachment trial – and damage to President Trump – than others.

“Sectors that would suffer from regulation by Democrats, notably pharma, energy and banks want him to win again.”

Mr Elliott concludes: “Four Republican senators need to agree to call Bolton.

“If they do, they are likely to demand the Bidens – both father and son – appear also. This will make the impeachment trial much longer.  The longer the process, the more volatility will occur in global financial markets.

“Expect banks, pharma and energy to lead this market volatility if Bolton is called by the Senate.”

About:

deVere Group is one of the world’s largest independent advisors of specialist global financial solutions to international, local mass affluent, and high-net-worth clients.  It has a network of more than 70 offices across the world, over 80,000 clients and $12bn under advisement


The Analytical Overview of the Main Currency Pairs on 2020.01.29

by JustForex

The EUR/USD currency pair

Technical indicators of the currency pair:
  • Prev Open: 1.10188
  • Open: 1.10222
  • % chg. over the last day: +0.02
  • Day’s range: 1.10113 – 1.10276
  • 52 wk range: 1.0879 – 1.1572

The EUR/USD currency pair is in sideways movement. There is no defined trend. At the moment local support and resistance levels are at 1.10000 and 1.10350, respectively. Today the Fed will announce its decision on the key interest rate. Financial markets participants expect the regulator to keep the main parameters of monetary policy at the same level. We recommend you to pay attention to comments and rhetoric of the Central Bank representatives. Open positions from key levels.

The Economic News Feed for 29.01.2020:

  • – Unfinished sales index in the US real estate market – 17:00 (GMT+2:00);
  • – US Federal Reserve interest rate decision – 21:00 (GMT+2:00).
EUR/USD

Indicators do not give accurate signals: the price has crossed 50 MA.

MACD histogram is near the 0 mark.

The stochastic oscillator is located in the oversold area, the %K line has crossed the %D line. No signals at the moment.

Trading recommendations
  • Support levels: 1.10000, 1.09700
  • Resistance levels: 1.10350, 1.10600, 1.10750

If the price fixes below 1.10000, expect a further decline toward 1.09700-1.09400.

Alternatively, the quotes could recover toward 1.10700-1.10900.

The GBP/USD currency pair

Technical indicators of the currency pair:
  • Prev Open: 1.30588
  • Open: 1.30271
  • % chg. over the last day: -0.24
  • Day’s range: 1.30152 – 1.30287
  • 52 wk range: 1.1959 – 1.3516

The technical picture on the GBP/USD currency pair is ambiguous. At the moment the sterling is consolidating. Local support and resistance levels are acting: 1.30000 and 1.30350, respectively. Investors are waiting for additional drivers. Today the key event will be the Fed meeting. We recommend opening positions from key levels.

The Economic News Feed for 29.01.2020 is calm.

GBP/USD

The price is fixed below 50 MA and 100 MA, which signals the strength of the sellers.

The MACD histogram is in the negative zone, but above the signal line, which gives a weak signal to sell GBP/USD.

The Stochastic Oscillator is in the neutral zone, the %K line is above the %D line, which indicates a bullish mood.

Trading recommendations
  • Support levels: 1.30000, 1.29650
  • Resistance levels: 1.30350, 1.30650, 1.31000

If the price fixes below 1.30000, GBP/USD quotes are expected to fall further toward 1.29650-1.29400.

Alternatively, the quotes could grow toward 1.30700-1.31000.

The USD/CAD currency pair

Technical indicators of the currency pair:
  • Prev Open: 1.31939
  • Open: 1.31550
  • % chg. over the last day: -0.24
  • Day’s range: 1.31537 – 1.31653
  • 52 wk range: 1.2949 – 1.3566

Yesterday USD/CAD quotes retreated from local highs. Currently, the CAD is consolidating in the range of 1.31450-1.31750. The trading instrument has potential for further correction after the prolonged rally. Today, investors’ attention is focused on the Fed meeting. Additional support for the Canadian dollar is provided by the oil quotes recovery. Positions should be opened from key levels.

The Economic News Feed for 29.01.2020 is calm.

USD/CAD

Indicators do not give accurate signals: the price has crossed 50 MA and 100 MA.

MACD has crossed into the negative zone, which indicates the development of bearish sentiments.

The Stochastic Oscillator is located in the neutral zone, the %K line is above the %D line, which gives a signal to buy USD/CAD.

Trading recommendations
  • Support levels: 1.31450, 1.31200, 1.30900.
  • Resistance levels: 1.31750, 1.32000, 1.32300.

If the price fixes below 1.31450, expect further correction toward 1.31000-1.30800.

Alternatively, the quotes could grow toward 1.32000-1.32300.

The USD/JPY currency pair

Technical indicators of the currency pair:
  • Prev Open: 108.889
  • Open: 109.120
  • % chg. over the last day: +0.23
  • Day’s range: 109.035 – 109.263
  • 52 wk range: 104.45 – 113.53

USD/JPY currency pair is in a flat. The technical pattern is ambiguous. At the moment the local support and resistance levels can be distinguished at 108.900 and 109.250. In the nearest future, a correction of USD/JPY quotes after a prolonged decline is not excluded. We expect the Fed to decide on the key interest rate. We also recommend you to pay attention to the US government bond yield dynamics. Open positions from key levels.

The Economic News Feed for 29.01.2020 is calm.

USD/JPY

Indicators do not give accurate signals: the price has crossed 50 MA and 100 MA.

The MACD histogram is in the positive zone but below the signal line, which gives a weak signal to buy USD/JPY.

The Stochastic Oscillator is in the neutral zone, the %K line is below the %D line, which indicates a bearish mood.

Trading recommendations
  • Support levels: 108.900, 108.750, 108.400
  • Resistance levels: 109.250, 109.650, 109.800

If the price fixes above 109.250, expect the quotes to correct toward 109.500-109.750.

Alternatively, the quotes could fall toward 108.700-108.400.

by JustForex

UK Future Is in the Focus of Attention

by JustForex

The US dollar did not change a lot against the basket of major currencies during yesterday’s trading session. The dollar index (#DX) closed in the green zone (+0.02%). On Wednesday, the Hong Kong government announced that it would limit transportation from the continent to prevent further spread of the virus. Meanwhile, the United States and Great Britain have advised their residents to avoid all trips to China.

Today, the European Parliament should ratify the agreement on Britain’s exit from the EU. Negotiations between the union and the UK on future relations should begin on March 3. Until this moment, Brussels and London will plan discussions, and determine the range of problems for discussion. Immediately after the UK officially leaves the EU, a transitional period will begin, which should end on December 31, 2020. Until that moment, Britain will remain in the European Customs Union and a single market. However, at the same time, the UK will lose membership in the European Parliament and the European Commission.

The “black gold” prices have been growing. Currently, futures for the WTI crude oil are testing the $54.05 mark per barrel. At 17:30 (GMT+2:00), US crude oil inventories will be published.

Market Indicators

Yesterday, there was the bullish sentiment in the US stock market: #SPY (+1.05%), #DIA (+0.68%), #QQQ (+1.54%).

The 10-year US government bonds increased. At the moment, the indicator is at the level of 1.62-1.63%.

The Economic News Feed for 29.01.2020:
  • – Pending home sales in the US at 17:00 (GMT+2:00);
  • – Fed interest rate decision at 21:00 (GMT+2:00).

by JustForex

Coronavirus results in Risk-off – Gold about to recapture 1,600 USD?

By Admiral Markets

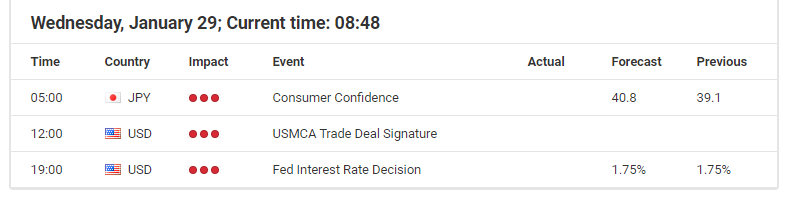
Source: Economic Events January 29, 2020 – Admiral Markets’ Forex Calendar

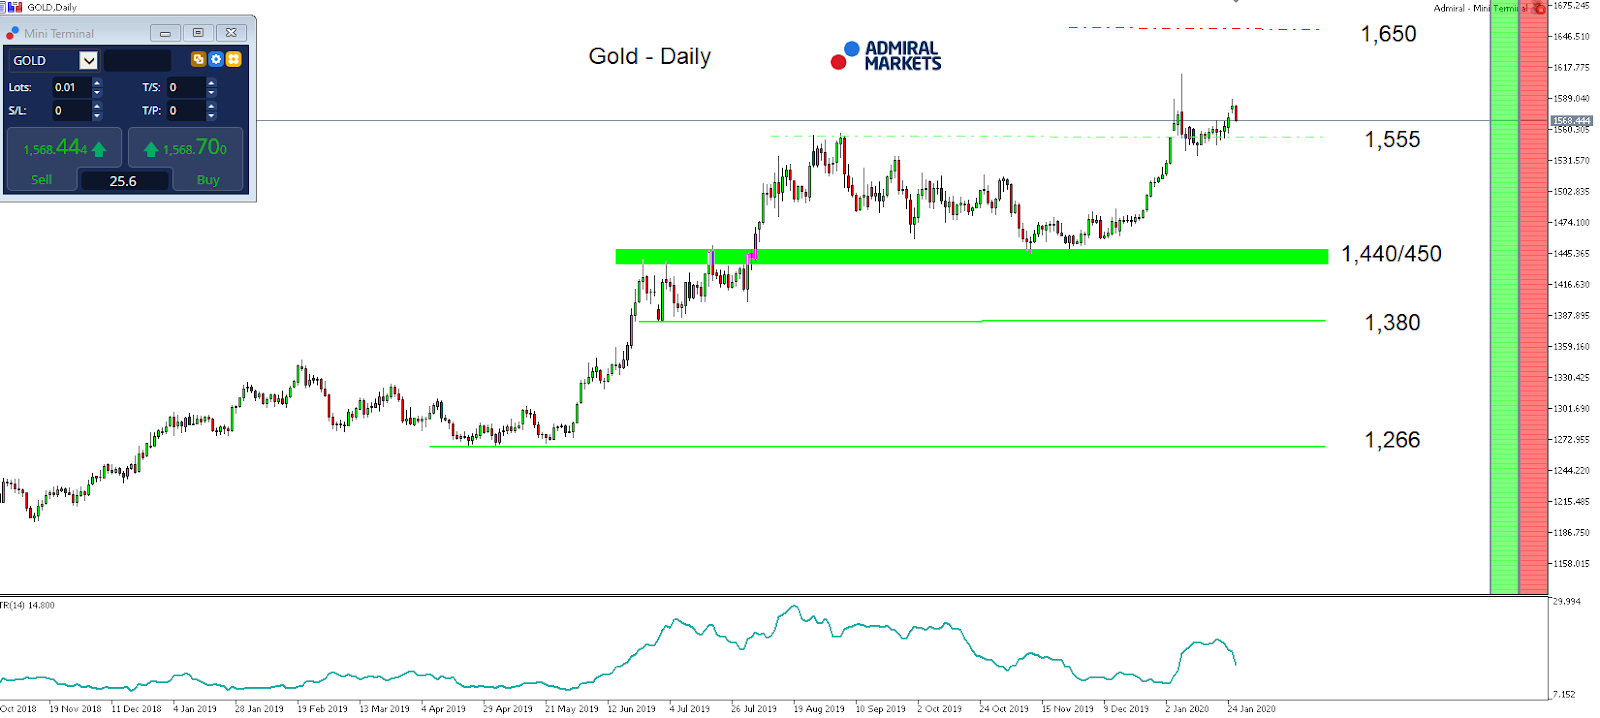
Gold has seen increasing demand against the region around 1,555 USD, approaching the 2019 yearly highs. The main driver was the latest news and developments on an outbreak of a new virus in China (Coronavirus) which currently sees a bigger impact on world financial markets and the risk tendency among market participants.

While the main question is whether these risk-off tendencies last (based on a 2017 paper, economists calculated that the expected annual losses from pandemic risk could amount to ‘only’ about $500 billion (ca. 0.6% of global income) per year), Gold still finds other, bullish drivers.

While today’s Fed rate decision shouldn’t deliver anything new and we don’t expect much from it, in fact, see a re-formulation of the status quo, any changes of the current forward guidance in regards to the recent funding pressures in the Repo market will be more dovish and thus positive for the precious metal.

Technically, we favour further gains in Gold, too. As long as we trade above 1,440/450 USD the potential next target on the upside can be found in the region around 1,650/700 USD.

And then there is also a noteworthy bullish seasonality.

Last week on Friday, Gold entered a bullish seasonal window, which lasts until February 4.

In more detail, the seasonal bullish pattern developed over the last 20 years with Gold seeing an average gain of 23.50 USD for 15 of the past 20 years.

In the remaining five years, it dropped on average only 11.73 USD, while the maximum loss of the pattern was 23.90 USD and the maximum drawdown being 26.05 USD, adding to the advantageous outlook for Gold bulls:

Source: Admiral Markets MT5 with MT5-SE Add-on Gold Daily chart (between October 17, 2018, to January 28, 2020). Accessed: January 28, 2020, at 10:00pm GMT – Please note: Past performance is not a reliable indicator of future results, or future performance.

In 2015, the value of Gold fell by 10.4%, in 2016 it increased by 8.1%, in 2017 it increased by 13.1%, in 2018, it fell by 1.6%, in 2019, it increased by 18.9%, meaning that after five years, it was up by 28%.

Discover the world’s #1 multi-asset platform

Admiral Markets offers professional traders the ability to trade with a custom, upgraded version of MetaTrader 5, allowing you to experience trading at a significantly higher, more rewarding level. Experience benefits such as the addition of the Market Heat Map, so you can compare various currency pairs to see which ones might be lucrative investments, access real-time trading data, and so much more. Click the banner below to start your FREE download of MT5 Supreme Edition!

Download MetaTrader 5 and begin trading today!

Disclaimer: The given data provides additional information regarding all analysis, estimates, prognosis, forecasts or other similar assessments or information (hereinafter “Analysis”) published on the website of Admiral Markets. Before making any investment decisions please pay close attention to the following:

  1. This is a marketing communication. The analysis is published for informative purposes only and are in no way to be construed as investment advice or recommendation. It has not been prepared in accordance with legal requirements designed to promote the independence of investment research, and that it is not subject to any prohibition on dealing ahead of the dissemination of investment research.
  2. Any investment decision is made by each client alone whereas Admiral Markets shall not be responsible for any loss or damage arising from any such decision, whether or not based on the Analysis.
  3. Each of the Analysis is prepared by an independent analyst (Jens Klatt, Professional Trader and Analyst, hereinafter “Author”) based on the Author’s personal estimations.
  4. To ensure that the interests of the clients would be protected and objectivity of the Analysis would not be damaged Admiral Markets has established relevant internal procedures for prevention and management of conflicts of interest.
  5. Whilst every reasonable effort is taken to ensure that all sources of the Analysis are reliable and that all information is presented, as much as possible, in an understandable, timely, precise and complete manner, Admiral Markets does not guarantee the accuracy or completeness of any information contained within the Analysis. The presented figures refer that refer to any past performance is not a reliable indicator of future results.
  6. The contents of the Analysis should not be construed as an express or implied promise, guarantee or implication by Admiral Markets that the client shall profit from the strategies therein or that losses in connection therewith may or shall be limited.
  7. Any kind of previous or modeled performance of financial instruments indicated within the Publication should not be construed as an express or implied promise, guarantee or implication by Admiral Markets for any future performance. The value of the financial instrument may both increase and decrease and the preservation of the asset value is not guaranteed.
  8. The projections included in the Analysis may be subject to additional fees, taxes or other charges, depending on the subject of the Publication. The price list applicable to the services provided by Admiral Markets is publicly available from the website of Admiral Markets.
  9. Leveraged products (including contracts for difference) are speculative in nature and may result in losses or profit. Before you start trading, you should make sure that you understand all the risks.

By Admiral Markets

EURUSD: euro remains under pressure

By Alpari.com

On Tuesday, January 28, trading on the euro finished up by three points. Demand for risky assets rose in the US session, amid recovery in stock indices after the fall.

Global markets stabilized, while Chinese markets are closed until February 3. The focus of market playuers has shifted towards US coprporate reporting. The EURUSD pair recovered from 1.0998 to 1.1028, including the Asian session.

Today’s events (GMT+3):

  • 10:00 Germany: Gfk Consumer Confidence Survey (Feb).
  • 12:00 Switzerland: ZEW Survey – Expectations (Jan).
  • 12:00 Eurozone: Private Loans (YoY) (Dec), M3 Money Supply (YoY) (Dec).
  • 16:30 USA: Goods Trade Balance (Dec).
  • 18:00 USA: Pending Home Sales (MoM) (Dec).
  • 18:30 USA: EIA Crude Oil Stocks Change (Jan 24).
  • 21:00 USA: Fed Interest Rate Decision.
  • 22:30 USA: FOMC Press Conference.

Рис. 1Current situation:

Expectations regarding a new low being set bore fruit. We have four lowering bottoms and a rebound to 1.1028. Technical conditions for an upwards correction to 1.1050 (at the 45th degree) have been created, but it is unlikely that bulls will be able to push the price to this level because of the ongoing events in China.

On Tuesday, Chinese President Xi Jinping said that China is confident of its capacity to bring the outbreak of coronavirus under control – the virus has claimed the lives of more than 132 people. Chinese experts say that the epidemic is very difficult to contain, since coronavirus has a long incubation period. Said period passes without symptoms, but the infection is capable of being transmitted.

There is not enough objective news to properly understand the depth of the situation. The Chinese authorities continue to boldly reassure everyone that everything is under control, but at the same time, there is a struggle with vloggers and bloggers. Several people are accused of spreading rumors of coronavirus on the Internet. One person was prosecuted for disseminating false information about pneumonia via social networks in Tianjin China, and six more were fined and warned about their future conduct. This was reported by Xinhua News Agency, citing information released by the City Department for Public Safety.

The governments of France, Japan, the United States and India have prepared planes to evacuate diplomats and their families. Why take them out if everything is under control? Why in a hurry to build a hospital with 1,000 beds by early February? Maybe the Chinese authorities are hiding a more harrowing version of the truth from us?

At the time of writing, the euro is worth 1.1006. The price underwent an adjustment – increasing by 76%. Major currencies are trading in the red, except for the yen. According to forecasts, the general view is that a decrease to 1.0992 could be on the cards. Then a rebound later, after the meeting of the US Federal Reserve and Chairman Jerome Powell’s subsequent news conference.

By Alpari.com

Japanese Candlesticks Analysis 28.01.2020 (EURUSD, USDJPY)

Article By RoboForex.com

EURUSD, “Euro vs. US Dollar”

As we can see in the H4 chart, the pair is no longer trading inside the ascending channel. Right now, EURUSD has completed several reversal candlestick patterns, such as Harami. We may assume that later the price may reverse and form a slight correction, which may be followed by a further decline to reach the support level at 1.0992. However, one shouldn’t exclude a possibility that the price may form a more serious correction and reach 1.1075.

EURUSD
Risk Warning: the result of previous trading operations do not guarantee the same results in the future

USDJPY, “US Dollar vs. Japanese Yen”

As we can see in the H4 chart, USDJPY has fallen from the ascending channel’s upside border while reversing after forming Shooting Star pattern. At the moment, the price is moving near the channel’s downside border, where it earlier formed several reversal patterns, such as Hammer. The current situation implies that the pair may reverse and resume growing to reach 109.65. At the same time, the pair may choose another scenario, according to which it is expected to continue falling towards 108.45.

USDJPY

Article By RoboForex.com

Attention!
Forecasts presented in this section only reflect the author’s private opinion and should not be considered as guidance for trading. RoboForex LP bears no responsibility for trading results based on trading recommendations described in these analytical reviews.

Ichimoku Cloud Analysis 28.01.2020 (AUDUSD, NZDUSD, USDCAD)

Article By RoboForex.com

AUDUSD, “Australian Dollar vs US Dollar”

AUDUSD is trading at 0.6760; the instrument is moving below Ichimoku Cloud, thus indicating a descending tendency. The markets could indicate that the price may test the cloud’s downside border at 0.6820 and then resume moving downwards to reach 0.6665. Another signal to confirm further descending movement is the price’s rebounding from the descending channel’s upside border. However, the scenario that implies further decline may be canceled if the price breaks the cloud’s upside border and fixes above 0.6905. In this case, the pair may continue growing towards 0.7005.

AUDUSD
Risk Warning: the result of previous trading operations do not guarantee the same results in the future

NZDUSD, “New Zealand Dollar vs US Dollar”

NZDUSD is trading at 0.6548; the instrument is moving below Ichimoku Cloud, thus indicating a descending tendency. The markets could indicate that the price may test the cloud’s downside border at 0.6565 and then resume moving downwards to reach 0.6445. Another signal to confirm further descending movement is the price’s rebounding from the resistance level. However, the scenario that implies further decline may be canceled if the price breaks the cloud’s upside border and fixes above 0.6635. In this case, the pair may continue growing towards 0.6705.

NZDUSD
Risk Warning: the result of previous trading operations do not guarantee the same results in the future

USDCAD, “US Dollar vs Canadian Dollar”

USDCAD is trading at 1.3180; the instrument is moving above Ichimoku Cloud, thus indicating an ascending tendency. The markets could indicate that the price may test the cloud’s upside border at 1.3115 and then resume moving upwards to reach 1.3315. Another signal to confirm further ascending movement is the price’s rebounding from the support level. However, the scenario that implies further growth may be canceled if the price breaks the cloud’s downside border and fixes below 1.3065. In this case, the pair may continue falling towards 1.2995.

USDCAD

Article By RoboForex.com

Attention!
Forecasts presented in this section only reflect the author’s private opinion and should not be considered as guidance for trading. RoboForex LP bears no responsibility for trading results based on trading recommendations described in these analytical reviews.

Investors Are Still Focused on Coronavirus

by JustForex

The US dollar strengthened against a basket of major currencies during yesterday’s trading session. The dollar index (#DX) closed in the green zone (+0.10%). Coronavirus in China is still in the spotlight. The number of dead from disease has already exceeded 106, with the first fatal case recorded in Beijing. The US warned citizens from traveling to China. Financial markets continue to decline due to concerns about the effects of the virus.

The safe yen is being traded near a three-week high against the US dollar as investors turned to the safe-haven currencies amid rising risks. Asia was at the center of the coronavirus epidemic, so the Australian and New Zealand dollars showed the worst trading results. Investors expect a meeting of key central banks to be held this week.

The “black gold” prices have become stable after a continuous fall. At the moment, futures for the WTI crude oil are testing the $52.90 mark per barrel.

Market Indicators

Yesterday, there were aggressive sales in the US stock market: #SPY (-1.60%), #DIA (-1.53%), #QQQ (-2.07%).

The 10-year US government bonds yield fell again. At the moment, the indicator is at the level of 1.58-1.59%.

The Economic News Feed for 28.01.2020:
  • – Durable goods orders in the US at 15:30 (GMT+2:00);
  • – Consumer confidence index in the US at 17:00 (GMT+2:00).

by JustForex

The Analytical Overview of the Main Currency Pairs on 2020.01.28

by JustForex

The EUR/USD currency pair

Technical indicators of the currency pair:
  • Prev Open: 1.10298
  • Open: 1.10188
  • % chg. over the last day: -0.05
  • Day’s range: 1.10163 – 1.10252
  • 52 wk range: 1.0879 – 1.1572

The EUR/USD currency pair continues to consolidate after a prolonged decline. There is no defined trend. Currently, the following local support and resistance levels can be distinguished: 1.10100 and 1.10400, respectively. Financial markets participants took a waiting position before the Fed meeting, which is scheduled for January 29. Technical correction of EUR/USD quotes is not excluded in the nearest future. Open positions from key levels.

The Economic News Feed for 28.01.2020:

  • – Durable Goods Purchases (US) – 15:30 (GMT+2:00);
  • – Consumer Confidence Index (US) – 17:00 (GMT+2:00);
EUR/USD

Indicators do not give accurate signals: the price tests 50 MA.

The MACD histogram is in the negative zone, but above the signal line, which gives a weak signal to sell EUR/USD.

The Stochastic Oscillator is in the neutral zone, the %K line crosses the %D line. There are no signals at the moment.

Trading recommendations
  • Support levels: 1.10100, 1.09800
  • Resistance levels: 1.10400, 1.10600, 1.10750

If the price fixes below 1.10100, expect a decline toward 1.09800-1.9600.

Alternatively, the quotes could recover toward 1.10600-1.10800.

The GBP/USD currency pair

Technical indicators of the currency pair:
  • Prev Open: 1.30646
  • Open: 1.30588
  • % chg. over the last day: -0.04.
  • Day’s range: 1.30331 – 1.30651
  • 52 wk range: 1.1959 – 1.3516

Bearish sentiment prevails on GBP/USD currency pair. Sterling has updated the local lows. At the moment GBP/USD quotes are testing the support level at 1.30300. The mark 1.30650 is the nearest resistance. The trading instrument has a potential for further decline. Today we recommend you to pay attention to the US news background. Open positions from key levels.

The publication of important statistics on the UK economy is not planned.

GBP/USD

Indicators point to the strength of sellers: the price has fixed below 50 MA and 100 MA.

MACD histogram is in the negative zone and continues to decline, which gives a strong signal to sell GBP/USD.

The Stochastic Oscillator is in the neutral zone, the %K line is below the %D line, which indicates a bearish mood.

Trading recommendations
  • Support levels: 1.30300, 1.30000, 1.29700
  • Resistance levels: 1.30650, 1.31000, 1.31450

If the price fixes below 1.30300, expect movement toward 1.30000-1.29800.

Alternatively, the quotes could grow toward 1.30900-1.31100.

The USD/CAD currency pair

Technical indicators of the currency pair:
  • Prev Open: 1.31501
  • Open: 1.31939
  • % chg. over the last day: +0.20
  • Day’s range: 1.31800 – 1.31943
  • 52 wk range: 1.2949 – 1.3566

The USD/CAD currency pair continues to show positive dynamics. The trading instrument has overcome and strengthened above the key extremums. At the moment, the CAD is consolidating. Local support and resistance levels are acting: 1.31700 and 1.32000, respectively. The technical picture signals further growth of USD/CAD quotes. We recommend you to pay attention to the dynamics of “black gold” prices. Open positions from key levels.

The Economic News Feed for 28.01.2020 is calm.

USD/CAD

The indicators signal the strength of buyers: the price has fixed above 50 MA and 100 MA.

MACD histogram is in the positive zone, which gives a signal to buy USD/CAD.

The Stochastic Oscillator is located near the oversold area, the %K line crosses the %D line. There are no signals at the moment.

Trading recommendations
  • Support levels: 1.31700, 1.31400, 1.31200
  • Resistance levels: 1.32000, 1.32300, 1.32500

If the price fixes above 1.32000, expect movement toward 1.32300-1.32500.

Alternatively, the quotes could descend toward 1.31400-1.31200.

The USD/JPY currency pair

Technical indicators of the currency pair:
  • Prev Open: 108.928
  • Open: 108.889
  • % chg. over the last day: -0.02
  • Day’s range: 108.819 – 109.099
  • 52 wk range: 104.45 – 113.53

The USD/JPY has stabilized after a long slump. At the moment the trading instrument is consolidating. USD/CAD quotes are testing local support and resistance levels: 108.750 and 109.100, respectively. Technical correction is not ruled out in the nearest future. We also recommend you to pay attention to the economic reports, as well as the dynamics of US government bonds yield. Open positions from key levels.

The Economic News Feed for 28.01.2020 is calm.

USD/JPY

Indicators do not give accurate signals: the price is testing 50 MA.

The MACD histogram began to rise, which indicates a possible correction of the USD/JPY currency pair.

The Stochastic Oscillator is located in the overbought zone, the %K line crossed the %D line. There are no signals at the moment.

Trading recommendations
  • Support levels: 108.750, 108.400
  • Resistance levels: 109.100, 109.300, 109.650

If the price fixes below 108.750, the quotes should descend toward 108.500-108.300.

Alternatively, the quotes could grow toward 109.300-109.600.

by JustForex

The Platinum Breakout & Bull Market of 2020

By TheTechnicalTraders.com

Platinum has setup into a longer-term FLAG formation and has recently broken the APEX of this FLAG.  The long term potential for Platinum, in conjunction with the advance in Rhodium, Palladium, Gold, and Silver, is a new Bullish Price Trend.

Our researchers believe Platinum must move above $1200 for this new Bullish trend to anchor a “Breakout Base” formation.  The current investment environment suggests a new metals rally is setting up.  Fear is starting to take hold of the markets and industrial and manufacturing demands are still driving prices and supply demands higher and higher.  As investors pile into the metals as a form of safety, we expect Platinum to rally above $1200 within the next 4 to 6+ months and begin a much broader rally to levels above $1600 overtime.

Demand for Platinum has increased because of two main reasons:

1) Rapid increase in consumption in SE Asia
2) Increase in acceptance of fuel cells.

As we learn more about the industrial and manufacturing demands for Platinum. It becomes evident that a new upside bias in trend may just be getting started.

Traders need to understand and consider the opportunities presented by this incredible longer-term setup in Platinum.   Could platinum DOUBLE in price within 12 months?  Could it TRIPLE?

Follow our research to stay ahead of this incredible opportunity for skilled technical traders and learn how we can help you find great trades.

As a technical analysis and trader since 1997 I have been through a few bull/bear market cycles, I have a good pulse on the market and timing key turning points for both short-term swing trading and long-term investment capital. The opportunities are massive/life-changing if handled properly.

Join my Wealth Building Newsletter if you like what you read here and ride my coattails as I navigate these financial markets and build wealth while others lose nearly everything they own.

Chris Vermeulen
TheTechnicalTraders.com


NOTICE: Our free research does not constitute a trade recommendation or solicitation for our readers to take any action regarding this research.  It is provided for educational purposes only.  Our research team produces these research articles to share information with our followers/readers in an effort to try to keep you well informed.  Visit our web site to learn how to take advantage of our members-only research and trading signals.