On Monday, January 27, the euro was down at the close of trading. In the American session, the EURUSD pair fell to 1.1010. The weakening of the euro is a result of mad dash to invest in protective assets, amid fears regarding the spread of the coronavirus in China. Traders are happy because market volatility has gone through the roof – economic indicators have been overshadowed. US stock indexes closed 1.5% down, likewise the European by 1.2%. There is no panic, but we think another powerful downward wave is set to rock the stock market. This will affect oil, as well as currency pairs.
• 17:00 USA: S&P/Case-Shiller Home Price Indices (YoY) (Nov).
Current situation:
Yesterday’s expectations were fully justified. A new intraday high was set, and the price then fell to 1.1010 in the US session. The 135th degree provides support, and from it, the price recovered back to 1.1025 and is now trading at 1.1019.
A double bullish divergence has formed on the hourly TF. Since the AO indicator has already rolled back to the zero line, we do not pay attention to it. The conditions for a sharp rebound were present, but due to the virus and fears of a further decline in the pair, bulls missed the opportunity.
Given that the new virus has an incubation period of two weeks, a surge of new infections surely awaits us. According to the latest data, the death toll from the new coronavirus has increased by 35%, to 107 people, the number of infected is up by 55%, a total of 4,474 people worldwide. So far, 63 people have made a full recovery.
We expect an upwards correction when the rate of new infections slows down. On the daily chart, levels are visible at 1.0990 and 1.0910. Protective assets await an adjustment today. Prior to the American session, according to the forecast, we can consider consolidation above 1.1010. In the evening session, we will wait for a decline to 1.0995. The probability of this forecast bearing fruit is 65%.
As the Asian markets opened on late Sunday, traders expected a reactionary price move related to the threat of the Wuhan virus and the continued news of its spread. The US Dow Jones futures markets opened close to -225 points lower on Sunday afternoon and were nearly -300 points lower within the first 25 minutes of trading. Gold opened $10 higher and continued to rally to a level above $15 higher.
If this is early price activity, or a reactionary price move, related to fear of what may come, then the warnings signs are very clear that global traders and investors believe this virus outbreak may very well turn into a major Black Swan event.
Our research team believes a 5% to 8% rotation should be considered a normal reversion range where price may find immediate support and attempt to rally from these support levels. Anything beyond 10% may set up a much bigger price reversion event, something akin to a Black Swan event. Therefore, we are advising our friends and followers to take the necessary steps to protect your wealth and assets as this move continued to extend.
30-Minute YM Futures Chart
This 30-minute YM futures chart highlights the reactionary downside price move (GAP) taking place on the open of the Asian markets. This GAP lower may be just the beginning of a much broader downside price move. We are going to have to wait and see what happens related to the Wuhan virus over the next 14+ days.
30-Minute Gold Futures Chart
Gold shot up nearly 1% in early trading on Sunday. Fear is driving investors to pile into the precious metals markets. As news of this virus continues to hit the news cycle, we expect metals will continue to push higher and higher – likely targeting the $1750 level in Gold.
If you want to see what the big money players own check out these gold charts and a very different interpretation of the gold COT Data here.
If you have not been following our research and if you have not already positioned your portfolio for this potential reversion event, then now would be a good time to start taking action. Do some research on the 1855 Third Plague Event in China where more than 15 million people died (nearly 1.25% of the total global population at the time). If those levels hold for this event, then possibly 60 to 80 million people may die over related to this event.
Oil is collapsing again and just his out downside target of $53. Our energy sector trade idea is up over 15% already.
Remember, all of this is speculation at this point. Yet we urge traders to act now to take action to prevent further erosion of their wealth and retirement accounts. Visit Technical Traders Ltd. to learn how we can help you plan for these events, protect your wealth, and find great trades.
As a technical analysis and trader since 1997 I have been through a few bull/bear market cycles, I have a good pulse on the market and timing key turning points for both short-term swing trading and long-term investment capital. The opportunities are massive/life-changing if handled properly.
Join my Wealth Building Newsletter if you like what you read here and ride my coattails as I navigate these financial markets and build wealth while others lose nearly everything they own.
NOTICE: Our free research does not constitute a trade recommendation or solicitation for our readers to take any action regarding this research. It is provided for educational purposes only. Our research team produces these research articles to share information with our followers/readers in an effort to try to keep you well informed. Visit our web site to learn how to take advantage of our members-only research and trading signals.
Coronavirus is the number one threat to financial markets currently – but most investors should avoid knee-jerk reactions, affirms the CEO of one of the world’s largest independent financial advisory organizations.
Nigel Green, deVere Group chief executive and founder, is speaking out as global stock markets are rattled on fears of the potentially deadly Sars-like virus triggering major sell-offs.
The death toll has now risen to 81 and almost 3,000 people have been confirmed as infected, with 44 cases having been detected outside China, where it originated.
On Monday, the composite European Stoxx 600 fell 1.7% at the open, London’s FTSE 100 dropped 1.6%, while Germany’s Dax was 1.7% lower. The slump followed a similarly dramatic decline in Asia overnight. The Shanghai Composite fell 2.7%, the Hong Kong Hang Seng lost 1.1%, and Japan’s Nikkei dropped 2%.
Mr Green says: “The Coronavirus is the number one threat to financial markets currently as global investors are becoming jittery on the uncertainty.
“But whilst this health crisis will inevitably hit some sectors, such as travel and retail, most investors who have a properly diversified portfolio should avoid knee-jerk reactions. History teaches us that most issues of this kind have a short-term impact on stock markets.”
He continues: “Most investors should monitor the situation with their financial adviser and sit tight at present. But if it is still escalating next week, with much higher casualty rates, a more defensive approach might be necessary.
“However, the cost and effort of making such a switch means you do not do it lightly, and more evidence is needed that the virus does pose a medium to long term risk to China and the global economy.”
Mr Green goes on to say: “But that said, this should serve as a wake-up call to all investors to ensure their portfolio is well-diversified across asset classes, regions, sectors, even currencies.
“This is the best way to mitigate risks and the best way to be well-placed to take advantage of the opportunities when they occur.”
The deVere CEO concludes: “Stock markets tend to bottom with the peak in new cases during a public health issue of this kind, before rebounding.
“This is a worrying and serious situation and investors must be vigilant. They should remain properly diversified and remain in the market.”
About:
deVere Group is one of the world’s largest independent advisors of specialist global financial solutions to international, local mass affluent, and high-net-worth clients. It has a network of more than 70 offices across the world, over 80,000 clients and $12bn under advisement
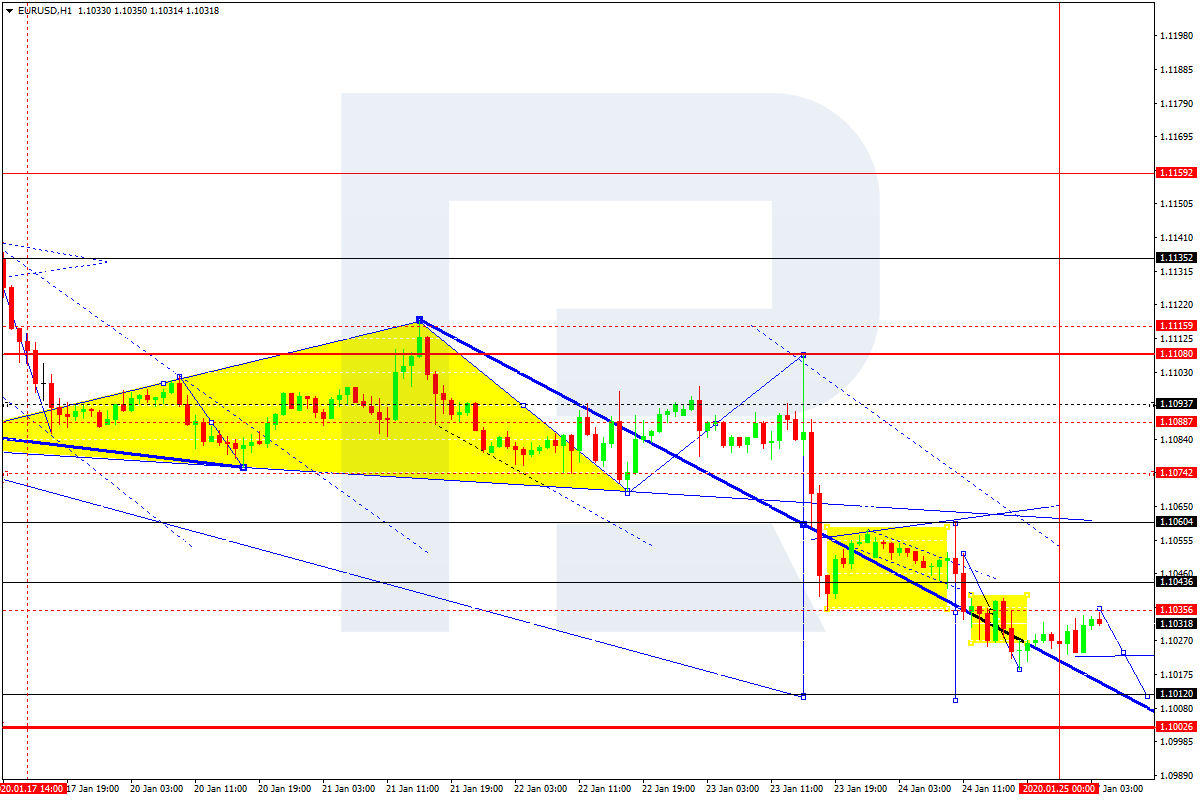
EURUSD is moving downwards. Possibly, today the pair may reach 1.1012 and then grow to break 1.1035. Later, the market may continue trading upwards with the target at 1.1060.
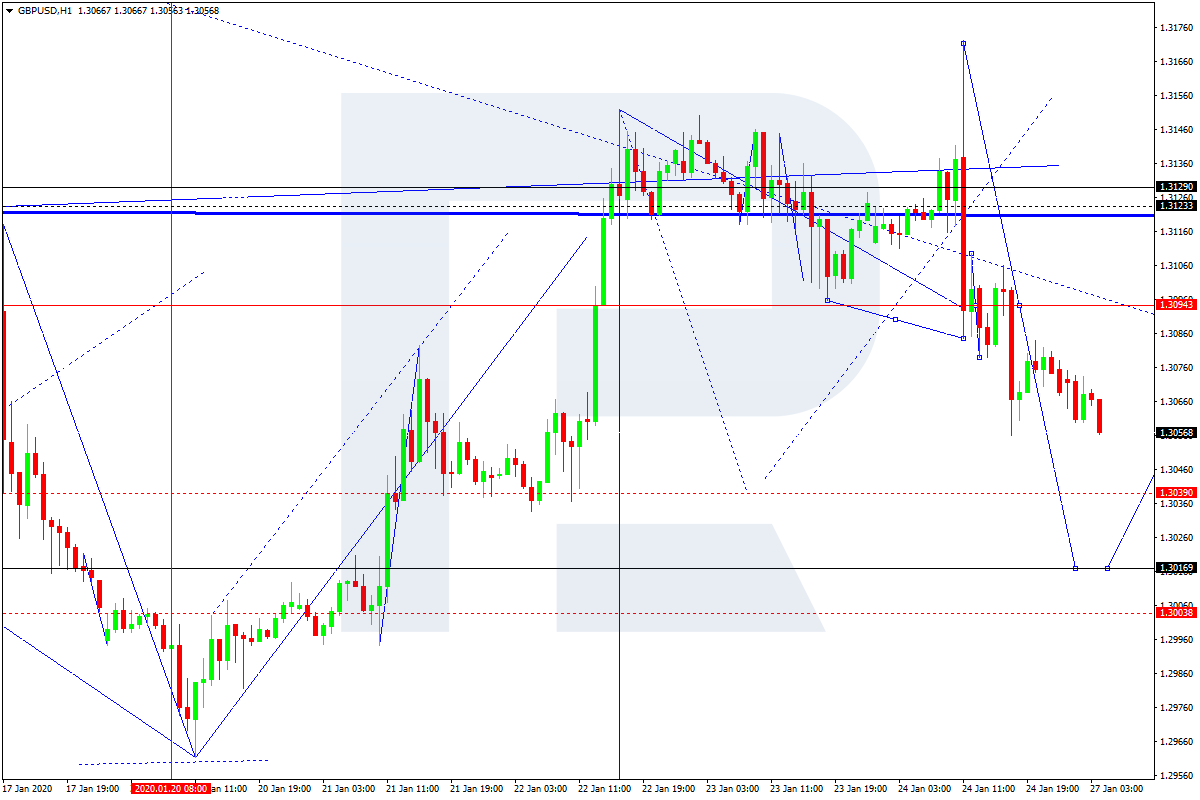
GBPUSD, “Great Britain Pound vs US Dollar”
After forming another consolidation range around 1.3094, GBPUSD has broken it to the downside. Today, the pair may reach 1.3017 and then start a new correction to return to 1.3094 and test it from below.
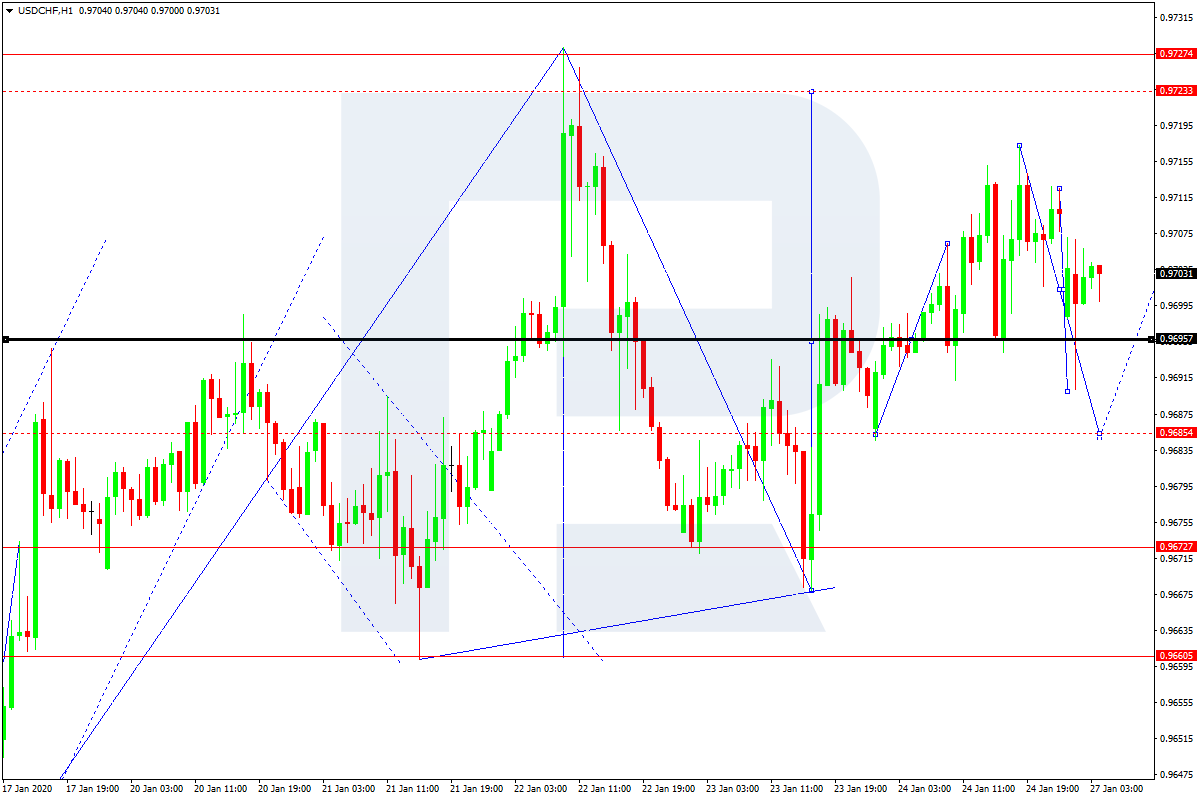
USDCHF, “US Dollar vs Swiss Franc”
USDCHF is consolidating around 0.9696. Possibly, today the pair may expand the range down to 0.9685 and then form one more ascending structure towards 0.9723. After that, the instrument may resume trading downwards with the target at 0.9660.
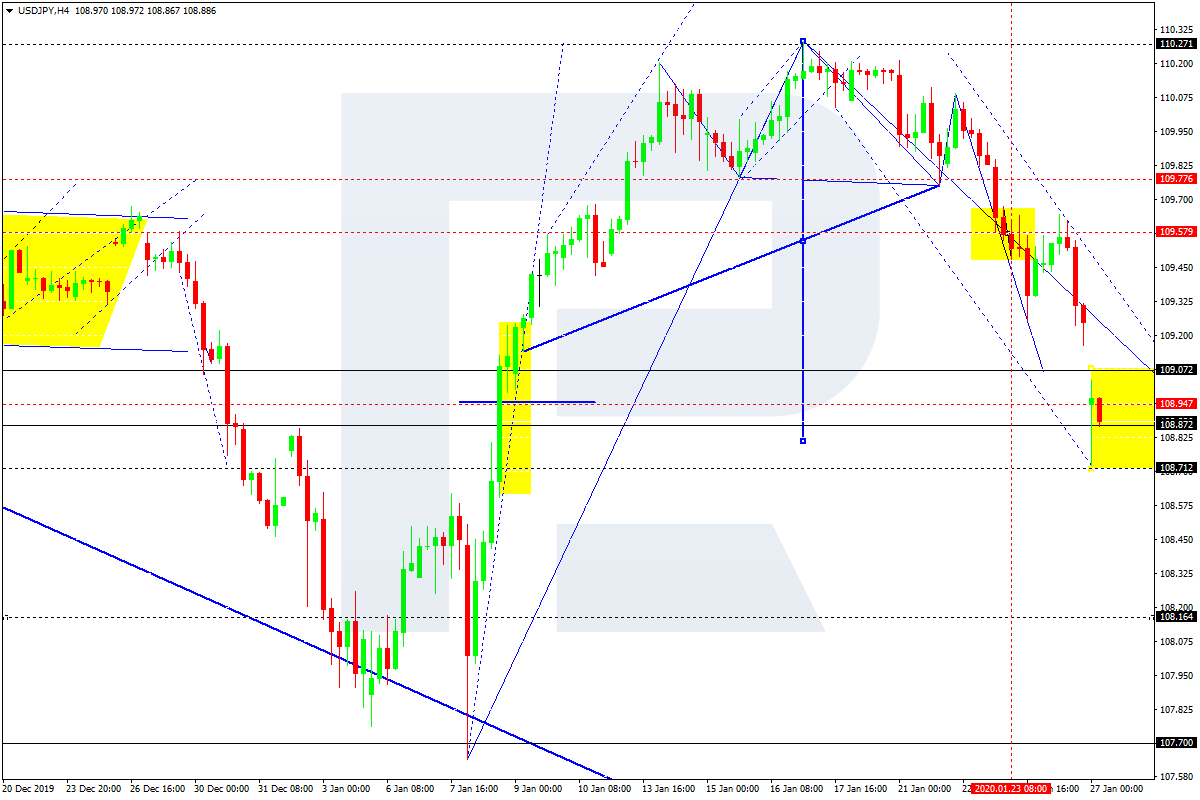
USDJPY, “US Dollar vs Japanese Yen”
After reaching the first downside target at 108.80, USDJPY is correcting towards 109.57 to test it from below. Later, the market may resume trading inside the downtrend with the target at 107.70.
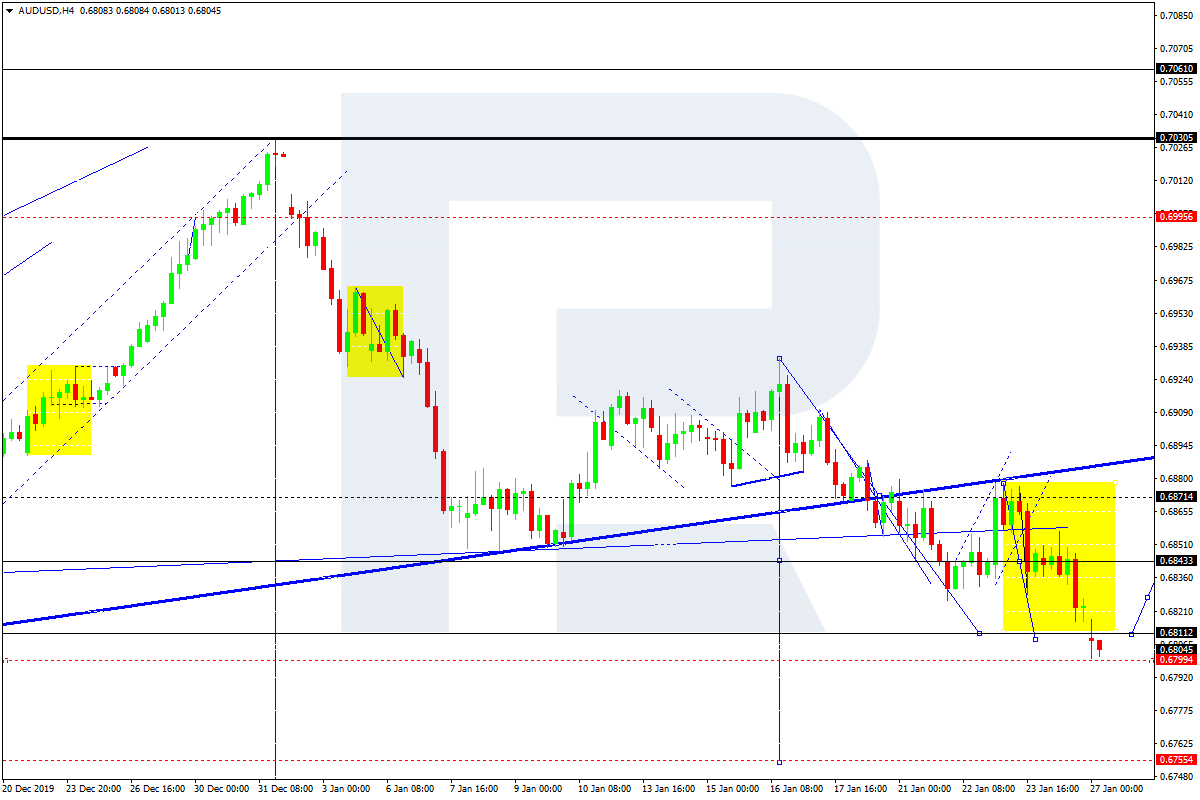
AUDUSD, “Australian Dollar vs US Dollar”
AUDUSD has reached the short-term predicted downside target at 0.6811; the entire movement is considered as the third descending wave. Possibly, the pair may consolidate near the current lows. After that, the instrument may break the range to the downside and continue moving downwards with the target at 0.6755.
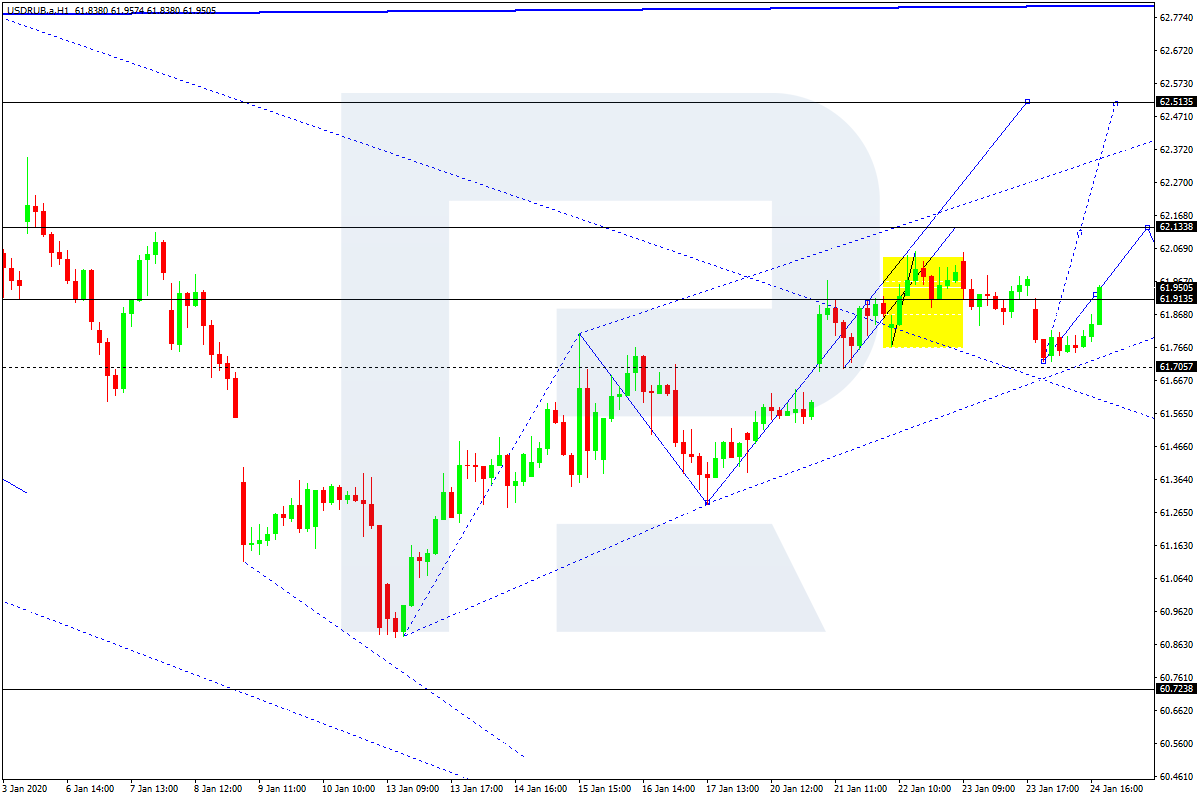
USDRUB, “US Dollar vs Russian Ruble”
USDRUB is still consolidating around 61.90 without any particular direction. According to the main scenario, the price is expected to continue the correction with the target at 63.00. Possibly, today the pair may grow to reach 62.15 and then form a new descending structure towards 61.91. Later, the market may resume trading upwards with the above-mentioned target.
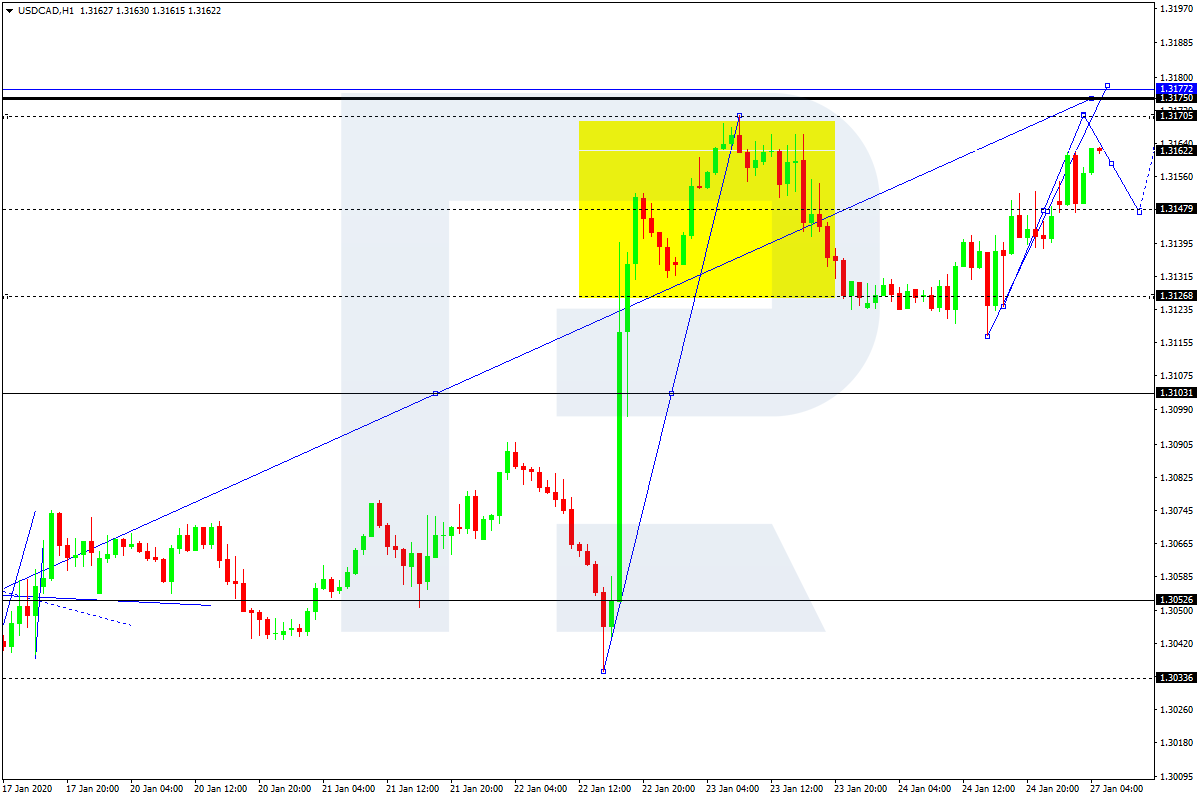
USDCAD, “US Dollar vs Canadian Dollar”
USDCAD has broken 1.3147 to the upside. Possibly, the pair may continue growing towards 1.3170 and then start another decline to return to 1.3147. After that, the instrument may form one more ascending structure with the target at 1.3177.
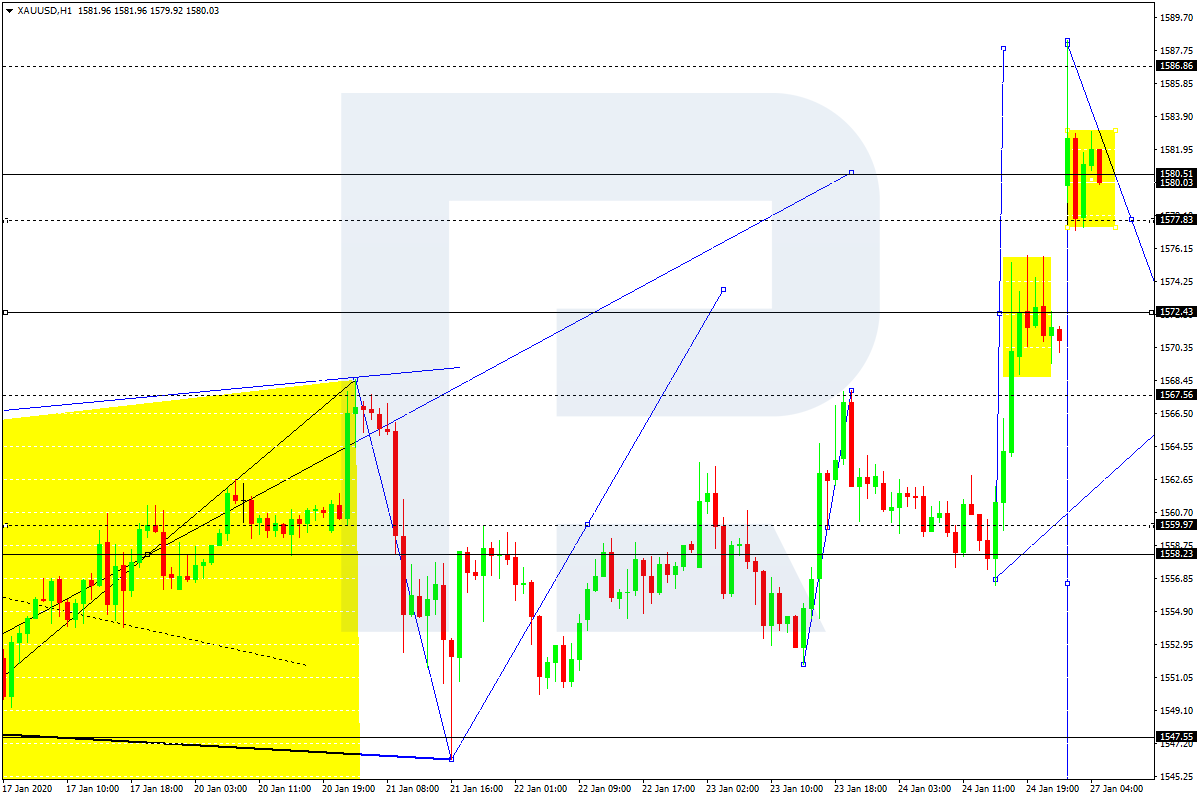
XAUUSD, “Gold vs US Dollar”
After the gap this morning, which made Gold complete its ascending structure at 1587.83, the pair has finished the descending impulse towards 1577.83; right now, it is consolidating above the latter level. Possibly, the pair may fall to reach 1567.56 and then resume trading upwards to test 1577.18 from below.
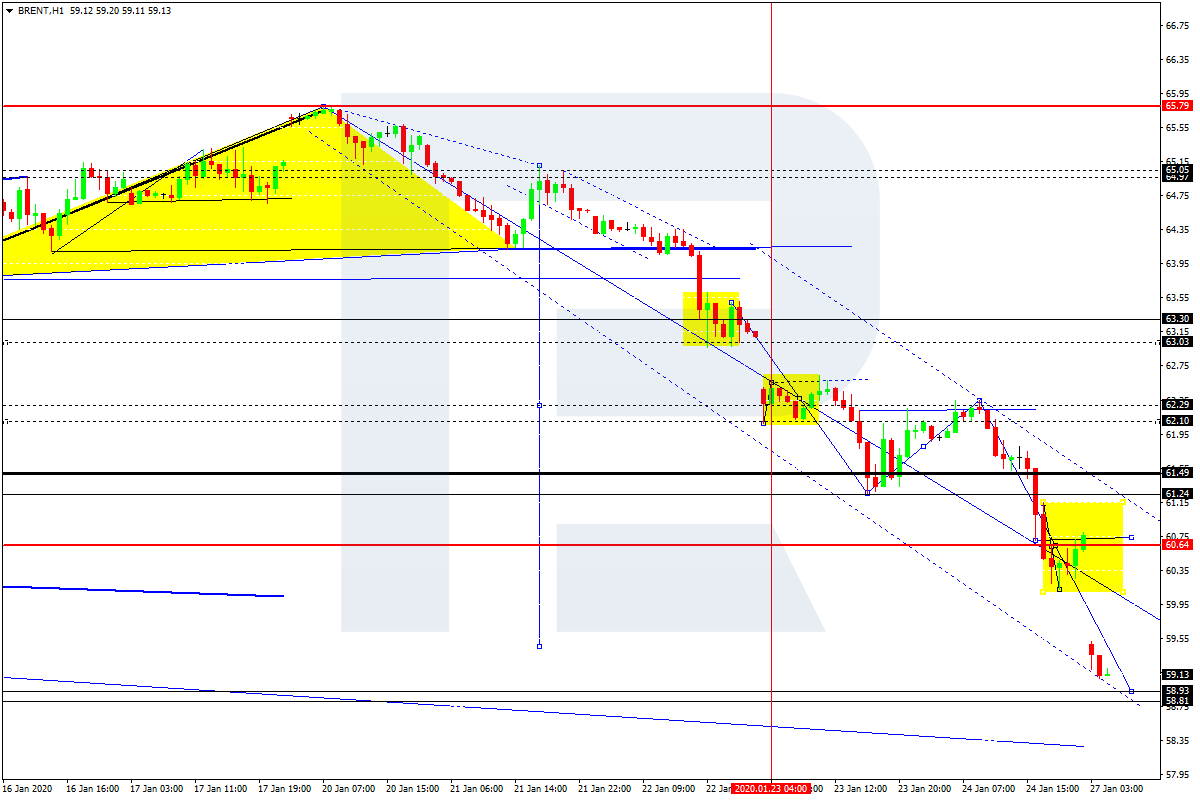
BRENT
Brent is moving downwards. Today, the pair may reach 58.62 and then start another growth to break 60.60. Later, the market may form one more ascending structure with the target at 62.30.
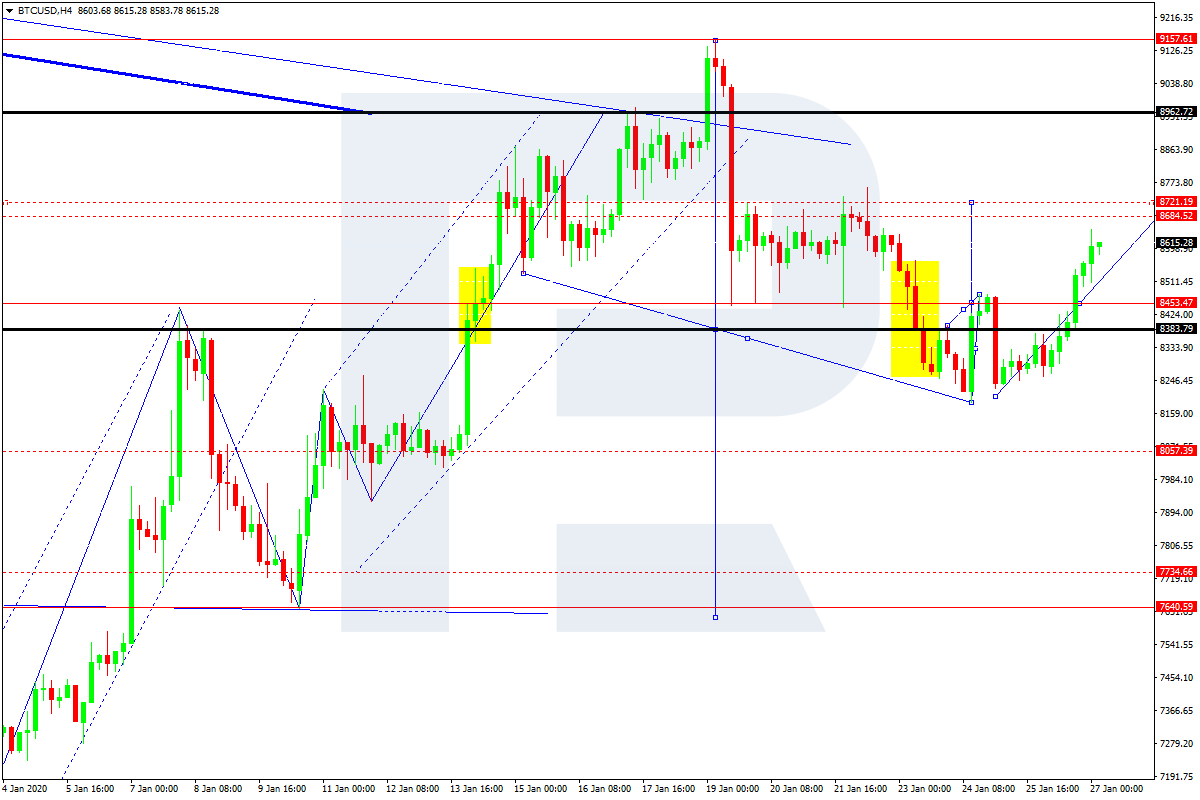
BTCUSD, “Bitcoin vs US Dollar”
BTCUSD is moving upwards; it has already broken 8444.00 to the upside. The main scenario implies that the pair may start a new correction towards 8720.00. After that, the instrument may resume trading downwards to reach 8050.00.
Attention! Forecasts presented in this section only reflect the author’s private opinion and should not be considered as guidance for trading. RoboForex LP bears no responsibility for trading results based on trading recommendations described in these analytical reviews.
As we can see in the H4 chart, the short-term correction didn’t last long and was followed by a quick growth, which may continue towards the current high at 1611.29 and then the post-correctional extension area between 138.2 and 161.8% fibo at 1599.00 and 1625.70 respectively. If the price tests the high and rebounds from it, the instrument may start a new descending wave to reach 50.0% and 61.8% fibo at 1530.60 and 1511.80 respectively.
The H1 chart shows more detailed structure of the current growth. The pair is heading towards 76.0% fibo at 1593.10 and may later continue growing to reach the high. The support is the local low at 1535.89.
USDCHF, “US Dollar vs Swiss Franc”
As we can see in the H4 chart, the convergence madу the pair start a new correctional uptrend towards 23.6% fibo. Right now, the price is trading close to this level, but may later continue growing to reach 38.2 and 50.0% fibo at 0.9770 and 0.9818 respectively. The support is the low at 0.9613.
In the H1 chart, the divergence made the pair reverse after reaching its mid-term target and start a new pullback, which has reached 50.0% fibo. The current growth is once again testing the above-mentioned mid-term target. However, if the price breaks the high at 0.9729, the instrument may continue trading upwards. Otherwise, the instrument may resume falling to reach 61.8% and 76.0% fibo at 0.9657 and 0.9641 respectively.
Attention! Forecasts presented in this section only reflect the author’s private opinion and should not be considered as guidance for trading. RoboForex LP bears no responsibility for trading results based on trading recommendations described in these analytical reviews.
When new technologies become cheaper and easier to use, they revolutionize industries. That’s what’s happening with Big Data right now.
Big Data analysts investigate large volumes of data to find hidden patterns, correlations, and other findings. Today’s technology allows you to analyze and respond to data almost instantly, which is can be slower and less efficient when using more traditional business analysis solutions.
Data plays a huge role in today’s production processes. Advances in robotics and increased levels of automation are fundamentally changing the face of production.
Today’s leaders in manufacturing are visionaries who are adopting more and more efficient methods of producing and moving physical goods while thinking not only about productivity but also about reducing costs and risks.
The future of survival will require manufacturers to be flexible, AI-centric organizations that minimize risk and seize opportunities through a deep understanding of operations and confident decision making.
Manufacturing analytics solutions enable them to set up production operations with minimal cost and risk while using data as an asset that helps deliver innovative services and quality products, which only possible in an interconnected economy.
Let’s look at the key ways big data and analytics are empowering and transforming manufacturers in 2020.
1. Increasing Data Accessibility, Availability, And Agility
One of the most significant advantages of using the analytical approach is the simplification of data.
Traditional production data sets are very complex and often require specialists with system knowledge and experience to obtain information from them. The vast amount of information generated by production processes every second also makes it virtually impossible to make accurate, timely, data-driven decisions without the use of business analytic models.
The first step to any analytical process is to collect data. Manufacturers are investing heavily in collecting data from internal sources, including production data collection systems (EMI) and production execution systems (MES).
Data is also collected from sensors, supervisory control and data acquisition systems (SCADA), human-machine interface software (HMI), and supply chain and enterprise resource planning applications.
After collecting and aggregating the data, various analytical methods are used to obtain information.
Analytical methods include predictive modeling, machine learning, simulation, optimization and process management, and business analytics tools.
However, performing analytics with comprehensive technology can be time-consuming and costly.
Various analytical methods are used to obtain information about the production:
Using data visualization, determine initial patterns (using moving averages, distribution histograms, standard deviations, and clustering) to prioritize data collection and analysis.
Using correlation analysis, identify the main determinants of process performance and formulate an initial hypothesis about the root causes of the decline and yield variability.
Using significance testing, test the underlying hypothesis for root causes of yield decline and variability and focus on the most statistically significant factors for further research.
Using artificial neural networks, simulate complex processes to quantify the impact and optimal ranges for the identified parameters.
These methods of analyzing large amounts of data reduce costs and help to avoid bottlenecks and identify KPIs to improve performance.
In a broad sense, some of the key functions of the analytics include:
Production improvement (operational efficiency)
A better understanding of plant performance and live warnings
Corresponding capacity in several plants
Perform predictive modeling based on production data
Interaction with suppliers
Understanding of customer needs
Better and faster service/customer support
2. Boosting Collaboration Opportunities Across The Board
Business analytics enables simultaneous access to different data sets for all stakeholders – from senior management to process owners, plant managers, and assembly line operators – on multiple devices or screens.
This increased sharing of information across the organization results in a closer collaboration that can ultimately improve product quality as well as minimize production costs and time.
For example, an operator on the floor can share data with a maintenance team to understand if the recent slowdown in production was caused by a technical failure on the assembly line. This allows the organization to identify and solve operational problems before they result in significant losses.
Another example is when Mercedes-Benz initially introduced an analytics system for the after-sales environment, they noticed the direct impact of this solution on operational optimization. Reporting became faster and more accurate as data processing time was significantly reduced while understanding the context allowed for more informed decisions.
This later led to the introduction of software for other functions such as production, sales, and human resources management. With a single data architecture that controls all business analytics, improved access to information thus simplified the entire organization and led to an increased inter-departmental collaboration of data.
3. Optimizing Business Functions And Driving Efficiency
No matter how efficient automated data analytics is, algorithms are often developed to find a concrete result. This often makes it difficult for manufacturers to get a holistic view of their complex data sets.
Business analytics, on the other hand, allows multiple stakeholders to interact with data sets live and conveniently. This allows for the integration of operational and experimental data for detailed information, which in turn can help optimize processes and improve the efficiency of production.
Besides, inbound and outbound supply chains can be strengthened, as well as resource discovery and utilization can be optimized to meet current and future demand.
Business data can also help identify additional sources of revenue and business growth opportunities for manufacturers more accurately.
Supply chain visibility is one of the critical challenges faced by manufacturers. This is partly due to large volumes of data such as product manufacturing, packaging, delivery/logistics, coding, etc. – involved in supply chain management.
Business analytics brings this information to the forefront, allowing manufacturers to identify and address supply chain bottlenecks. It helps improve supply chain responsiveness, reduce risk, and lower production costs.
4. Enabling swifter and more accurate decision-making
By providing a holistic view of all data across the business ecosystem, including from multiple sources, business intelligence allows manufacturers to delve deeper into their data and identify different trends and patterns relevant to them.
This review style approach allows them to analyze data using specific models and make accurate, proactive decisions.
Users can also take into account different data points, historical precedents, anomalies, measures taken, and their degree of effectiveness, acceptability of results, etc. to make more accurate decisions.
This helps them not only in their decision-making process but also in understanding why they are making particular decisions.
5. Making Factories “Smarter” And Benefiting From IoT
Industrie 4.0 is a perfect example of what modern factories will look like. It is an initiation of the German government – a high-tech strategy to promote computerization of production, which laid the foundation for smart factories. It covers every process from product idea to development and from recycling to maintenance.
Industrie 4.0 includes:
Interoperability: Machines and sensors connected to the network and working synchronously.
Automation: Physical devices are able to make their own decisions and are therefore automated.
While experts believe that India is one of the most ideal countries to benefit from, the Industrie 4.0 model, Cincinnati, Ohio, has already declared itself an “Industry 4.0 Demonstration City.” They are also investing heavily in innovation and development to address any major industry challenges they may face.
IIoT collects data from sensors, their transmissions, and microcontrollers that can track information and help manage the data. These two components together transform production processes and management, making manufacturers smart.
However, combining these two technologies requires new infrastructure, including hardware and software, as well as an operating system. Manufacturers will have to deal with the large inflow of data that begins to arrive and analyze it live as it grows over time.
6. Optimizing Quality Checks
Intel is one of the largest companies that actively integrates BDA into its production processes. Since quality assurance is an integral part of the chip production process, as with most manufacturers, they have to perform about 19,000 tests on each chip.
However, using the power of BDA, it has been able to reduce these steps significantly. For example, Intel’s analytics system can now view historical data collected during the manufacturing process at the plate level and identify only those chips that need to be tested.
In 2012, the chipmaker saved about $3 million in manufacturing costs using the predictive analysis process implemented on the Intel Core line of processors.
7. Improving Accuracy and Quantity of Production
McKinsey gave an excellent example of how BDA can significantly improve production practices. A biopharmaceutical manufacturer that manufactures a specific category of pharmaceutical products that includes blood components, hormones, and vaccines need to monitor more than 200 variables to ensure their purity.
Surprisingly, the yield of two separate batches of the same product produced using the same process can vary from 50% to 100%. Given how expensive medical products can be, even a 10% yield difference can be costly. Fortunately, there is a simple solution.
By dividing the entire production process into smaller segments and applying data analysis to each of them, the project team can process the dependencies between them and the parameters directly responsible for the yield difference.
Therefore, by adjusting these parameters accordingly, the team can quickly increase production by as much as 50%, saving up to $10 million per year.
8. Bettering Collaboration to Promote 3D Printer Factories and MaaS
3D printers are a trend, much like BDA. The factory that manufactures 3D printers can work easily and, more effectively, on the bases of BDA.
Moreover, we can offer a new type of service – Manufacture as a service (MaaS), the same as software as a service (Software-as-a-Service), which we have today.
Manufacturers of 3D printers, such as Materialise and Shapeways, already work on MaaS.
Making about 200 000 products a month, lastly, do tremendous business utilizing the automated software and 3D-printers, which work 24 hours a day, seven days a week.
Using BDA, these factories can work in the environment with a high level of cooperation where the stream of data and information passing through engineering, operators of machine tools, quality assurance, etc., is seamless. The result is amazing efficiency and fast feedback.
To Sum Up: Is BDA the future of the manufacturing industry?
In conclusion, BDA provides us with the tools and technologies to help create a world in which automated factories produce products with maximum efficiency and cause minimal wasting of time and resources. Besides, the leading players are already aware of this and have, therefore, taken the initiative.
Of the more than 200 North American manufacturing executives that were interviewed, nearly 68% outlined their plans to invest in data analytics to become more competitive in their highly competitive business environment. This indicates that data is rapidly growing into the new gold standard in manufacturing.
Nevertheless, much smaller volumes of data have begun to provide valuable information and real business value based on available data. Developing a strategy for a particular company and implementing a carefully planned initiative in this area is a complex task that requires considerable time and effort.
The US dollar closed Friday’s trading session with a slight increase against a basket of major currencies. The dollar index (#DX) closed in the green zone (+0.17%). Mixed economic statistics from the US were published on Friday. So, the index of economic activity in the manufacturing sector counted to 51.7 in January, while experts forecasted 52.5. Markit Composite PMI counted to 53.1 in January and was better than the expected value of 52.5. Services PMI was 53.2 instead of 52.9.
The Chinese yuan fell even more against the US dollar amid growing reports of an increase in the death toll from coronavirus. China announced that it would extend the New Year holidays until February 2 to strengthen the prevention and control of coronavirus. The virus has already infected more than 2,000 people in China and led to the death of 80. These events support the demand for safe-haven currencies.
The “black gold” prices continue to show negative dynamics. At the moment, futures for the WTI crude oil are testing the $52.20 mark per barrel.
Market Indicators
On Friday, there was the bearish sentiment on the US stock market: #SPY (-0.89%), #DIA (-0.60%), #QQQ (-0.84%).
The 10-year US government bonds yield fell sharply. At the moment, the indicator is at the level of 1.62-1.63%.
The Economic News Feed for 27.01.2020:
– German IFO business climate index at 11:00 (GMT+2:00);
The EUR/USD currency pair has stabilized after a significant drop last week. At the moment, the trading instrument is consolidating. There is no defined trend. The local support and resistance levels are 1.10200 and 1.10400, respectively. Investors are waiting for additional drivers. Technical correction of EUR/USD quotes is not excluded in the nearest future. Open positions from key levels.
The Economic News Feed for 27.01.2020:
– IFO business climate index (GER) – 11:00 (GMT+2:00);
– Primary Real Estate Sales (US) – 17:00 (GMT+2:00);
The indicators signal the sellers’ strength: the price has fixed below 50 MA and 100 MA.
MACD histogram is in the negative zone, but above the signal line, which gives a weak signal to sell EUR/USD.
The Stochastic Oscillator is in the neutral zone, the %K line is below the %D line, which indicates that the sentiment is bearish.
Trading recommendations
Support levels: 1.10200, 1.10000
Resistance levels: 1.10400, 1.10600, 1.10750
If the price fixes below 1.10200, expect further decline toward 1.10000-1.09700.
Alternatively, the quotes could recover toward 1.10600-1.10800.
The GBP/USD currency pair
Technical indicators of the currency pair:
Prev Open: 1.31236
Open: 1.30646
% chg. over the last day: -0.35
Day’s range: 1.30515 – 1.30752
52 wk range: 1.1959 – 1.3516
The technical pattern of the GBP/USD currency pair is ambiguous. At the moment the sterling is consolidating. Local support and resistance levels are acting: 1.30500 and 1.30800, respectively. Financial markets participants are waiting for Bank of England meeting, which is scheduled for January 30. We also recommend you to monitor the current information on Brexit. Open positions from key levels.
The news feed on the UK economy is calm.
The indicators do not give an accurate signal: 50 MA started crossing 100 MA.
The MACD histogram is in the negative zone, but above the signal line, which gives a weak signal to sell GBP/USD.
The Stochastic Oscillator is in the neutral zone, the %K line is above the %D line, which indicates a bullish mood.
Trading recommendations
Support levels: 1.30500, 1.30300, 1.30000
Resistance levels: 1.30800, 1.31000, 1.31450
If the price fixes below 1.30500, expect the quotes to fall toward 1.30000.
Alternatively, the quotes could grow toward 1.31100-1.31300.
The USD/CAD currency pair
Technical indicators of the currency pair:
Prev Open: 1.31347
Open: 1.31501
% chg. over the last day: +0.14
Day’s range: 1.31477 – 1.31699
52 wk range: 1.2949 – 1.3566
USD/CAD quotes have moved up again. At the moment the trading instrument is testing the resistance level 1.31700. 1.31400 is the nearest support. The technical picture signals the further growth of the USD/CAD currency pair. The pressure on the looney continues to have negative dynamics of oil quotations. Today, we recommend you to pay attention to the economic releases from the USA. Open positions from key levels.
Publication of important statistical data from Canada is not planned.
The indicators signal the strength of buyers: the price has fixed above 50 MA and 100 MA.
MACD histogram is in the positive zone, which gives a signal to buy USD/CAD.
The Stochastic Oscillator is in the neutral zone, the %K line crosses the %D line. There are no signals at the moment.
Trading recommendations
Support levels: 1.31400, 1.31200, 1.30900
Resistance levels: 1.31700, 1.32000
If the price fixes above 1.31700, expect further growth toward 1.32000-1.32200.
Alternatively, the quotes could descend toward 1.31200-1.31000.
The USD/JPY currency pair
Technical indicators of the currency pair:
Prev Open: 109.487
Open: 108,928
% chg. over the last day: -0.43
Day’s range: 108.732 – 109.123
52 wk range: 104.45 – 113.53
Bearish sentiment still prevails on USD/JPY currency pair. The trading instrument has renewed the local lows. Investors are concerned about the global demand slowing down amid growing risks of further coronavirus spread in China, which supports the demand for safe haven currencies. At the moment USD/JPY quotes are consolidating in the range 108.750-109.100. We also recommend to pay attention to the dynamics of US government bond yields. Open positions from key levels.
The news feed on the Japanese economy is calm.
The indicators signal the sellers’ strength: the price has fixed below 50 MA and 100 MA.
The MACD histogram is in the negative zone, which indicates a bearish mood.
The Stochastic Oscillator is located near the overbought zone, the %K line has crossed the %D line. There are no signals at the moment.
Trading recommendations
Support levels: 108.750, 108.400
Resistance levels: 109.100, 109.300, 109.650
If the price fixes below 108.750, expect the quotes to fall further toward 108.500-108.300.
Alternatively, the quotes could grow toward 109.300-109.500.
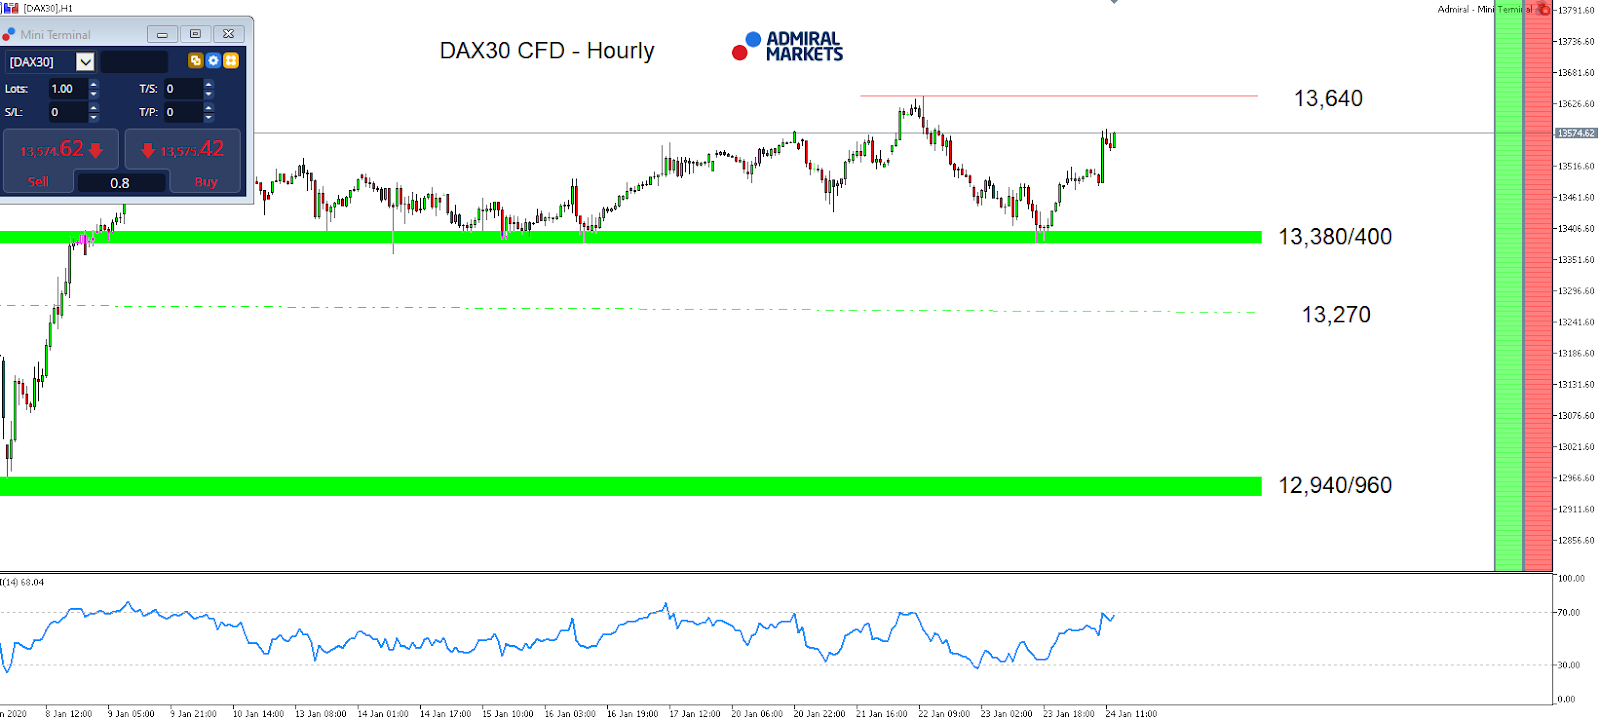
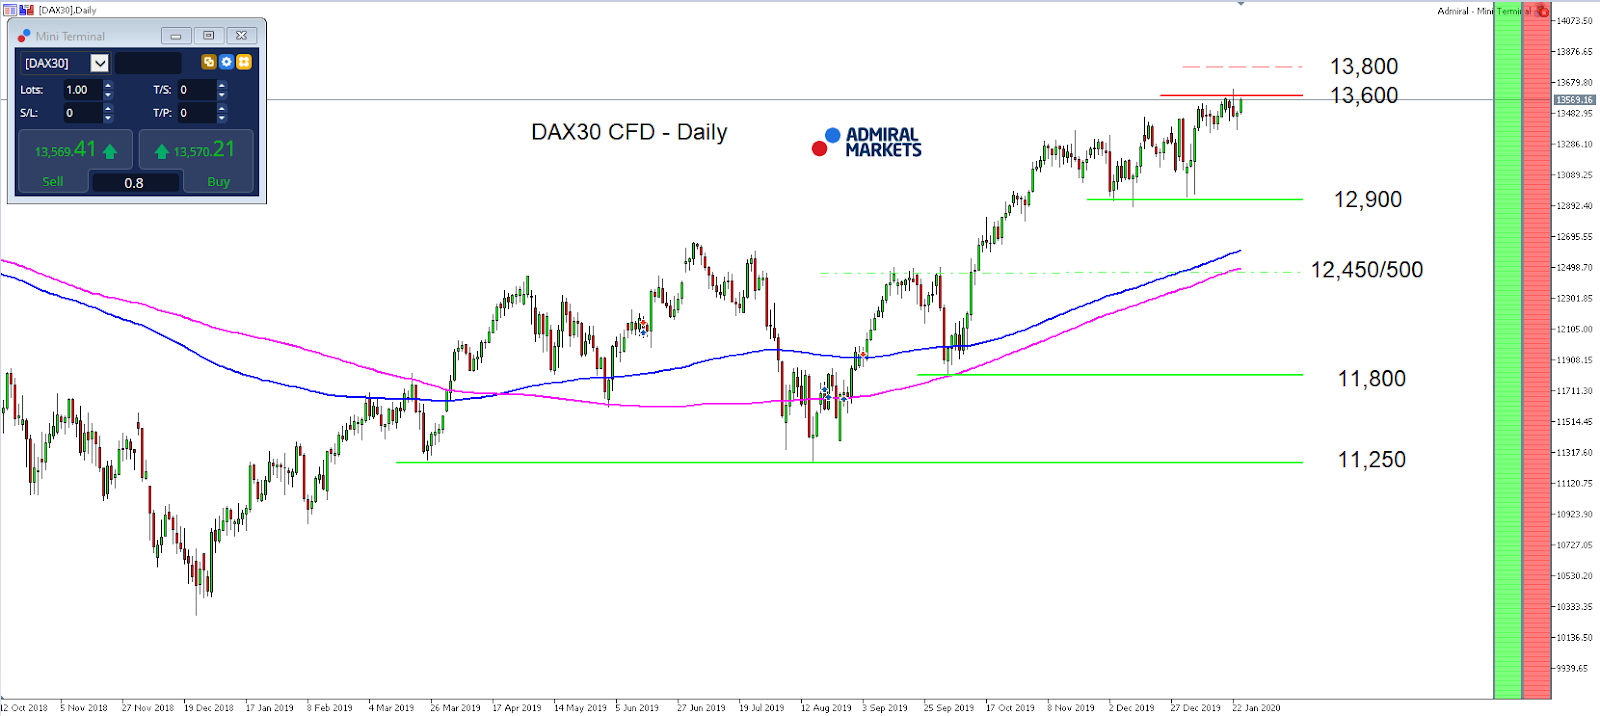
Last Wednesday, the DAX30 CFD finally made it to new all-time highs, but the question for the coming days is now whether bulls can gain further bullish momentum.
The strong weekly close after the important support around 13,380/400 points was successfully defended against the bulls last Thursday, and is a positive sign which brings the last weekly highs (and current all-time highs) of around 13,640 points into our focus for the start of the new week of trading.
A break higher activates targets on the upside around 13,800 and 14,000 points in the upcoming days, as long as we trade above 13,380/400 points.
From a seasonal perspective, we favour the long side, too: with the Fed rate decision on Wednesday, we’d like to point out several studies which show that since the 1980’s, the days before the Fed rate decision and especially the 24 hours before the event, US Equities, but also the German DAX30, showed on average a positive performance when trading the Long side.
Still, if we, on the other hand, fail to break sustainably higher, get to see another test of the region around 13,380/400 points and a break lower, a test of the region around 13,250/270 points seems likely.
Source: Admiral Markets MT5 with MT5-SE Add-on DAX30 CFD Hourly chart (between January 7, 2019, to January 24, 2020). Accessed: January 24, 2020, at 10:00 PM GMT
Source: Admiral Markets MT5 with MT5-SE Add-on DAX30 CFD Daily chart (between October 12, 2018, to January 24, 2020). Accessed: January 24, 2020, at 10:00pm GMT – Please note: Past performance is not a reliable indicator of future results, or future performance.
In 2015, the value of the DAX30 CFD increased by 9.56%, in 2016, it increased by 6.87%, in 2017, it increased by 12.51%, in 2018, it fell by 18.26%, in 2019, it increased by 26.44% meaning that after five years, it was up by 34.2%.
Discover the world’s #1 multi-asset platform
Admiral Markets offers professional traders the ability to trade with a custom, upgraded version of MetaTrader 5, allowing you to experience trading at a significantly higher, more rewarding level. Experience benefits such as the addition of the Market Heat Map, so you can compare various currency pairs to see which ones might be lucrative investments, access real-time trading data, and so much more. Click the banner below to start your FREE download of MT5 Supreme Edition!
Disclaimer: The given data provides additional information regarding all analysis, estimates, prognosis, forecasts or other similar assessments or information (hereinafter “Analysis”) published on the website of Admiral Markets. Before making any investment decisions please pay close attention to the following:
This is a marketing communication. The analysis is published for informative purposes only and are in no way to be construed as investment advice or recommendation. It has not been prepared in accordance with legal requirements designed to promote the independence of investment research, and that it is not subject to any prohibition on dealing ahead of the dissemination of investment research.
Any investment decision is made by each client alone whereas Admiral Markets shall not be responsible for any loss or damage arising from any such decision, whether or not based on the Analysis.
Each of the Analysis is prepared by an independent analyst (Jens Klatt, Professional Trader and Analyst, hereinafter “Author”) based on the Author’s personal estimations.
To ensure that the interests of the clients would be protected and objectivity of the Analysis would not be damaged Admiral Markets has established relevant internal procedures for prevention and management of conflicts of interest.
Whilst every reasonable effort is taken to ensure that all sources of the Analysis are reliable and that all information is presented, as much as possible, in an understandable, timely, precise and complete manner, Admiral Markets does not guarantee the accuracy or completeness of any information contained within the Analysis. The presented figures refer that refer to any past performance is not a reliable indicator of future results.
The contents of the Analysis should not be construed as an express or implied promise, guarantee or implication by Admiral Markets that the client shall profit from the strategies therein or that losses in connection therewith may or shall be limited.
Any kind of previous or modeled performance of financial instruments indicated within the Publication should not be construed as an express or implied promise, guarantee or implication by Admiral Markets for any future performance. The value of the financial instrument may both increase and decrease and the preservation of the asset value is not guaranteed.
The projections included in the Analysis may be subject to additional fees, taxes or other charges, depending on the subject of the Publication. The price list applicable to the services provided by Admiral Markets is publicly available from the website of Admiral Markets.
Leveraged products (including contracts for difference) are speculative in nature and may result in losses or profit. Before you start trading, you should make sure that you understand all the risks.
On Friday, January 24, the euro was down at the close of trading. Prices collapsed during ECB President Christine Lagarde’s press conference on Thursday, and continued to fall on Friday down to the 1.1020 mark. Traders and investors shifted their attention towards protective assets (gold, yen, US government bonds), with the disconcerting news coming out of China regarding the rapid spread of the new coronavirus continuing to affect the markets. Since January 20, it has been officially reported that 2,794 people have been infected, and 80 people have died.
Today’s news (GMT+3):
12:00 Germany: IFO – Business Climate (Jan), IFO – Current Assessment (Jan), IFO – Expectations (Jan).
12:30 UK: BBA Mortgage Approvals (Dec).
18:00 USA: New Home Sales (MoM) (Dec), New Home Sales Change (MoM) (Dec).
Current situation:
Our expectations for Friday were fully justified. The price shot up before falling, after which a new low was recorded at 1.1036 (the previous low was set on January 23).
Today, strong support is found at the 135th degree (1.1014). The forecasted target is lower at around 1.1009, a direct consequence of this morning’s activity which saw the market open with heavy investment in protective assets.
On Saturday, Chinese authorities declared the outbreak of the coronavirus a public health emergency in 25 provinces, special administrative regions and cities, enforcing the highest level of emergency response. According to Ma Xiaowei, Minister in charge of the PRC National Health Commission, experts are yet to identify the source of the infection.
Chinese exchanges remain closed due to the Lunar New Year Celebration. Any influential news coming out today will surely concern fresh information regarding the mystery virus. It is possible that news from Germany could boost the euro up to 1.1045. Given that today is Monday, we should be focused on any activity countering Friday’s results, but it must be noted that risky assets are under pressure due to the situation in China.
 Current situation: