Author Archive for InvestMacro – Page 95

Fibonacci Retracements Analysis 10.02.2020 (GOLD, USDCHF)

Article By RoboForex.com

XAUUSD, “Gold vs US Dollar”

As we can see in the H4 chart, after re-testing 38.2% fibo, XAUUSD has stopped the descending wave in order to start a new correctional uptrend. One of the possible scenarios implies that the pair may break the current high at 1611.29 and reach the post-correctional extension area between 138.2 and 161.8% fibo at 1599.45 and 1625.70 respectively. However, the major scenario suggests that the instrument may continue its decline towards 50.0% and 61.8% fibo at 1530.60 and 1511.80 respectively.

GOLD_H4
Risk Warning: the result of previous trading operations do not guarantee the same results in the future

In the H1 chart, the correctional uptrend has reached 61.8% fibo and may yet continue towards 76.0% fibo at 1582.27. However, if the price resumes falling towards the support at 38.2% fibo, the pair may continue trading downwards to reach the low at 1547.42. In case of a breakout, the mid-term decline may continue.

GOLD_H1
Risk Warning: the result of previous trading operations do not guarantee the same results in the future

USDCHF, “US Dollar vs Swiss Franc”

The H4 chart shows a new rising wave, which followed the previous descending impulse. By now, the wave has already reached 38.2% fibo. The next upside targets may be 50.0% and 61.8% fibo at 0.9818 and 0.9866 respectively. The support is the low at 0.9613.

USDCHF_H4
Risk Warning: the result of previous trading operations do not guarantee the same results in the future

As we can see in the H1 chart, there is a divergence on MACD within the uptrend, which may indicate a possible pullback soon. The targets may be 23.6%, 38.2%, and 50.0% fibo at 0.9746, 0.9724, and 0.9705 respectively.

USDCHF_H1

Article By RoboForex.com

Attention!
Forecasts presented in this section only reflect the author’s private opinion and should not be considered as guidance for trading. RoboForex LP bears no responsibility for trading results based on trading recommendations described in these analytical reviews.

Forex Technical Analysis & Forecast 10.02.2020 (EURUSD, GBPUSD, USDCHF, USDJPY, AUDUSD, USDRUB, USDCAD, GOLD, BRENT, BTCUSD)

Article By RoboForex.com

EURUSD, “Euro vs US Dollar”

After rebounding from 1.0975, EURUSD is forming a new descending structure towards 1.0935 at least. Possibly, today the pair may test 1.0955 from below and then resume falling to reach 1.0935. After that, the instrument may start another correction with the first target at 1.1010.

EURUSD
Risk Warning: the result of previous trading operations do not guarantee the same results in the future

GBPUSD, “Great Britain Pound vs US Dollar”

GBPUSD is still moving downwards. Today, the pair may reach 1.2862 and then start a new correction towards 1.2963. Later, the market may resume trading downwards with the target at 1.2825.

GBPUSD
Risk Warning: the result of previous trading operations do not guarantee the same results in the future

USDCHF, “US Dollar vs Swiss Franc”

USDCHF is consolidating around 0.9760. Possibly, today the pair may expand this range up to 0.9781 and then start another correction with the target at 0.9730.

USDCHF
Risk Warning: the result of previous trading operations do not guarantee the same results in the future

USDJPY, “US Dollar vs Japanese Yen”

USDJPY is moving downwards. Possibly, the pair may reach 109.32. After that, the instrument may form one more ascending structure towards 110.30 and then resume trading downwards with the first target at 108.70.

USDJPY
Risk Warning: the result of previous trading operations do not guarantee the same results in the future

AUDUSD, “Australian Dollar vs US Dollar”

AUDUSD has reached its short-term downside target at 0.6670; right now, it is consolidating near the lows. Today, the pair may correct towards 0.6716 and then resume trading downwards to reach 0.6660. Later, the market may start a new correction with the target at 0.6716.

AUDUSD
Risk Warning: the result of previous trading operations do not guarantee the same results in the future

USDRUB, “US Dollar vs Russian Ruble”

USDRUB has finished one more ascending structure towards 64.20. Possibly, today the pair may start a new decline with the first target at 63.30.

USDRUB
Risk Warning: the result of previous trading operations do not guarantee the same results in the future

USDCAD, “US Dollar vs Canadian Dollar”

USDCAD has broken 1.3293; Possibly, the pair may continue trading upwards to reach 1.3348. After that, the instrument may start a new correction to the downside with the target at 1.3188.

USDCAD
Risk Warning: the result of previous trading operations do not guarantee the same results in the future

XAUUSD, “Gold vs US Dollar”

Gold has broken its consolidation range upwards. Possibly, the pair may grow towards 1582.92 and then resume trading downwards to break 1554.75. Later, the market may continue falling with the target at 1524.50.

GOLD
Risk Warning: the result of previous trading operations do not guarantee the same results in the future

BRENT

Brent is falling towards 53.97. After that, the instrument may form one more ascending structure to reach 54.64 and then start a new decline towards 52.50 to complete this descending wave. Later, the market may resume trading upwards with the first target at 56.50.

BRENT
Risk Warning: the result of previous trading operations do not guarantee the same results in the future

BTCUSD, “Bitcoin vs US Dollar”

BTCUSD is still moving upwards. Today, the pair may reach 10200.00 and then start a new correction towards 9200.00, at least.

BITCOIN

Article By RoboForex.com

Attention!
Forecasts presented in this section only reflect the author’s private opinion and should not be considered as guidance for trading. RoboForex LP bears no responsibility for trading results based on trading recommendations described in these analytical reviews.

The Analytical Overview of the Main Currency Pairs on 2020.02.10

by JustForex

The EUR/USD currency pair

Technical indicators of the currency pair:
  • Prev Open: 1.09796
  • Open: 1.09412
  • % chg. over the last day: -0.32
  • Day’s range: 1.09412 – 1.09574
  • 52 wk range: 1.0879 – 1.1572

The EUR/USD currency pair shows a stable downtrend. The trading instrument has set new local lows again. On Friday, February 07, the USA published a quite optimistic labor market statistics for January. The demand for USD remains at a high level. Investors continue to assess the risks of further coronavirus spreading from China. Currently, EUR/USD quotes are consolidating in the range of 1.09400-1.09700. Positions should be opened from key levels.

The Economic News Feed for 10.02.2020:

EUR/USD

The indicators signal the sellers’ strength: the price has fixed below 50 MA and 100 MA.

MACD histogram is in the negative zone, but above the signal line, which gives a weak signal to sell EUR/USD.

The Stochastic Oscillator is located in the overbought zone, the %K line crossed the %D line. There are no signals at the moment.

Trading recommendations
  • Support levels: 1.09400, 1.09000
  • Resistance levels: 1.09700, 1.09900, 1.10100

If the price fixes below 1.09400, expect further decline toward 1.09000.

Alternatively, the quotes could grow toward 1.09900-1.10100.

The GBP/USD currency pair

Technical indicators of the currency pair:
  • Prev Open: 1.29261
  • Open: 1.28839
  • % chg. over the last day: -0.29
  • Day’s range: 1.28839 – 1.29086
  • 52 wk range: 1.1959 – 1.3516

GBP/USD quotes continue to show negative dynamics. Sterling has updated the local lows. The demand for the American currency remains at a high level after the release of positive labor statistics. At the moment, the trading instrument is consolidating. The local support and resistance levels are 1.28800 and 1.29200, respectively. The GBP/USD currency pair has a potential for further decline. Positions should be opened from key levels.

The news background on the UK economy is calm.

GBP/USD

The price is fixed below 50 MA and 100 MA, which signals the strength of the sellers.

The MACD histogram is in the negative zone, which indicates a bearish sentiment.

The Stochastic Oscillator is located in the overbought zone, the %K line crossed the %D line. There are no signals at the moment.

Trading recommendations
  • Support levels: 1.28800, 1.28400
  • Resistance levels: 1.29200, 1.29600, 1.30100

If the price fixes below 1.28800, expect quotes to fall toward 1.28500-1.28300.

Alternatively, the quotes could grow toward 1.29600-1.30000.

The USD/CAD currency pair

Technical indicators of the currency pair:
  • Prev Open: 1.32840
  • Open: 1.32999
  • % chg. over the last day: +0.21
  • Day’s range: 1.32894 – 1.33129
  • 52 wk range: 1.2949 – 1.3566

There is a mixed technical picture on the USD/CAD currency pair. The Mooney is traded in flat. Unidirectional trend is not observed. Financial markets participants are waiting for additional drivers. At the moment local support and resistance levels are acting: 1.32850 and 1.33150, respectively. In the nearest future correction of the trading instrument after prolonged growth is not excluded. We recommend to pay attention to the dynamics of black gold prices. Positions should be opened from key levels.

At 15:30 (GMT+2:00) a report on construction permits in Canada will be published.

USD/CAD

Indicators do not give accurate signals: the price has crossed 50 MA and 100 MA.

MACD histogram is near the 0 mark.

The Stochastic Oscillator is located in the oversold area, the %K line has crossed the %D line. No signals at the moment.

Trading recommendations
  • Support levels: 1.32850, 1.32650, 1.32450
  • Resistance levels: 1.33150, 1.33500

If the price fixes above 1.33150, expect further growth of USD/CAD quotes to 1.33500-1.33700.

Alternatively, the quotes could correct toward 1.32500-1.32300.

The USD/JPY currency pair

Technical indicators of the currency pair:
  • Prev Open: 109.986
  • Open: 109.678
  • % chg. over the last day: -0.25
  • Day’s range: 109.561 – 109.879
  • 52 wk range: 104.45 – 113.53

USD/JPY currency pair is in a sideways movement. The technical picture is ambiguous. At the moment the following key support and resistance levels can be identified 109.550 and 110.000, respectively. The correction of USD/JPY quotes is not ruled out in the nearest future. We recommend to pay attention to the dynamics of US government securities yield. Positions should be opened from key levels.

The news background on Japanese economy is rather calm.

USD/JPY

Indicators do not give accurate signals: the price has fixed between 50 MA and 100 MA.

The MACD histogram has approached the 0 point. There are no accurate signals.

The Stochastic Oscillator is located in the neutral zone, the %K line has crossed the %D line. There are no signals at the moment.

Trading recommendations
  • Support levels: 109.550, 109.300, 109.100
  • Resistance levels: 110.000, 110.250

If the price fixes above 110.000, expect further growth toward 110.250-110.400.

Alternatively, the quotes could descend toward 109.300-109.100.

by JustForex

What’s going on with the DAX? Despite strong NFPs, no new highs

By Admiral Markets

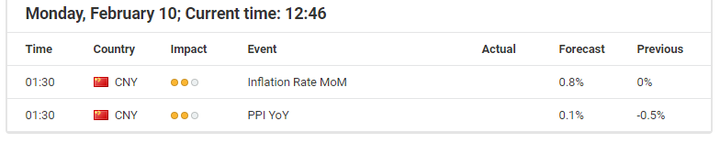
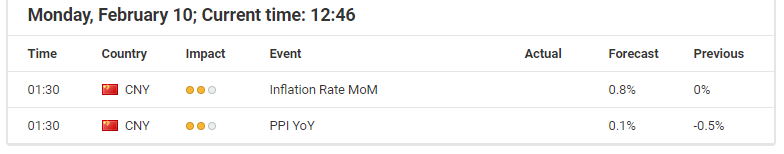
Source: Economic Events 10 February 2020 – Admiral Markets’ Forex Calendar

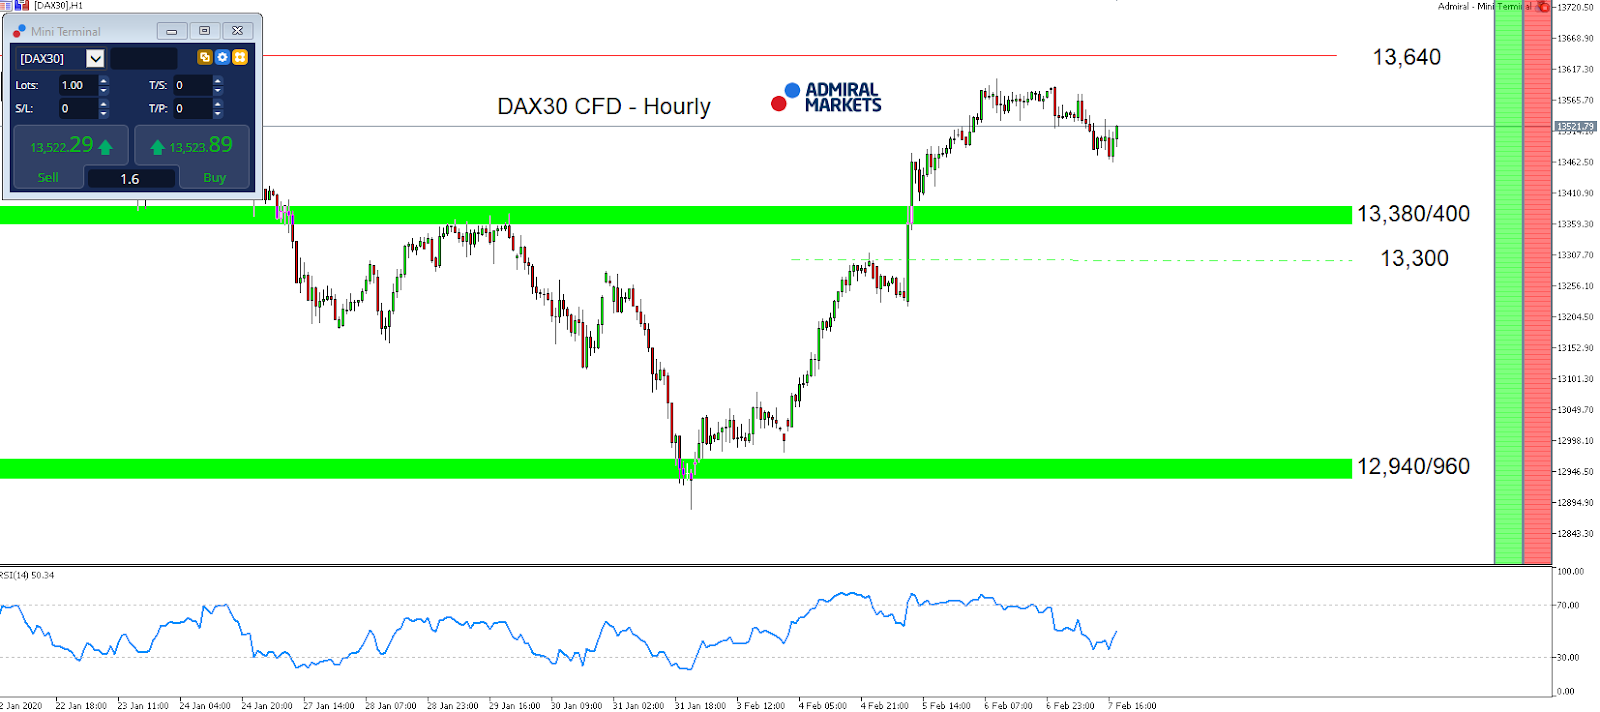
After closing January below 13,000 points, driven mainly by fears and developments around the Coronavirus which pointed to increasing risks of a widespread pandemic, the DAX bulls once again took control by the end of last Tuesday once fears began to wane, bringing the all-time highs around 13,640 points into our focus again on Monday.

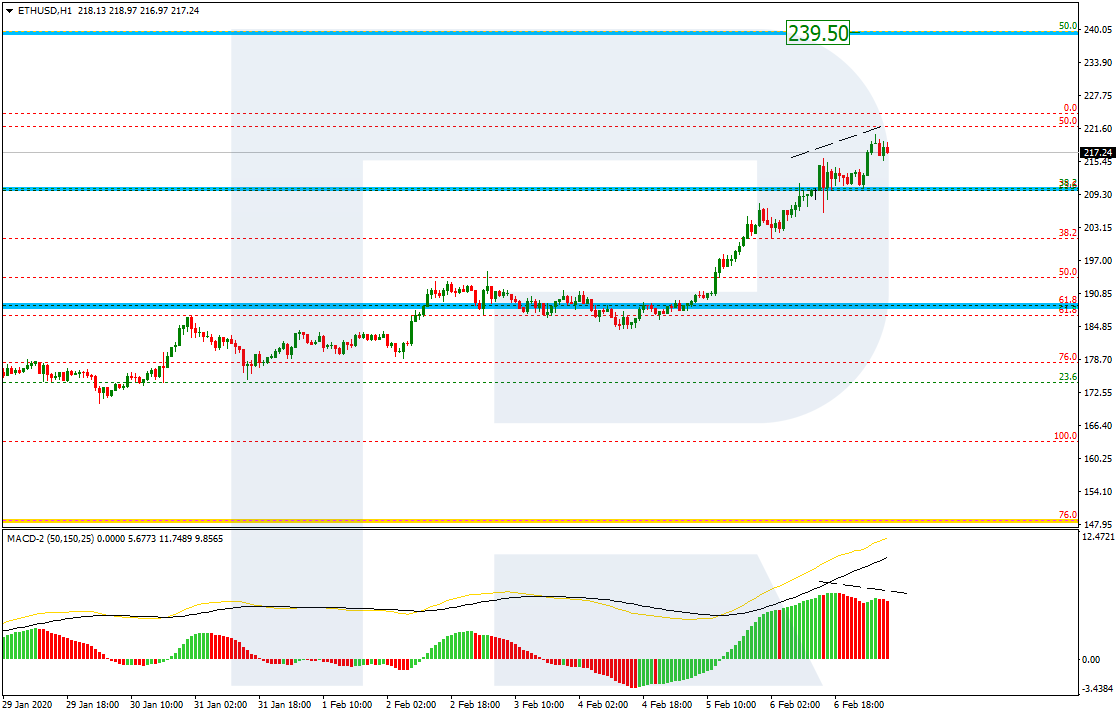
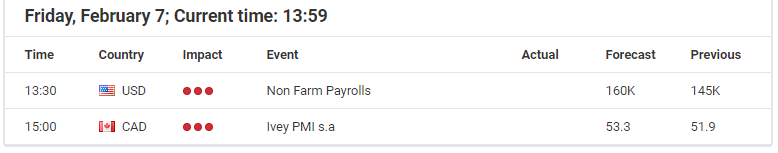
What’s certainly interesting is the mixed reaction among market participants to Friday’s solid Non-Farm Payrolls regarding the DAX30 CFD. NFPs in the US increased by 225,000 in January, following an upwardly revised 147,000 rise in the previous month, beating market expectations of 160,000.

Bulls weren’t capable of building strong momentum, making it possible for the German index to correct some of its gains of the last week with a potential target being found 13,380/400 points and slightly lower around 13,300 points.

Still, the mode stays bullish with the main focus on the upside lying on 13,640 points, the current all-time high.

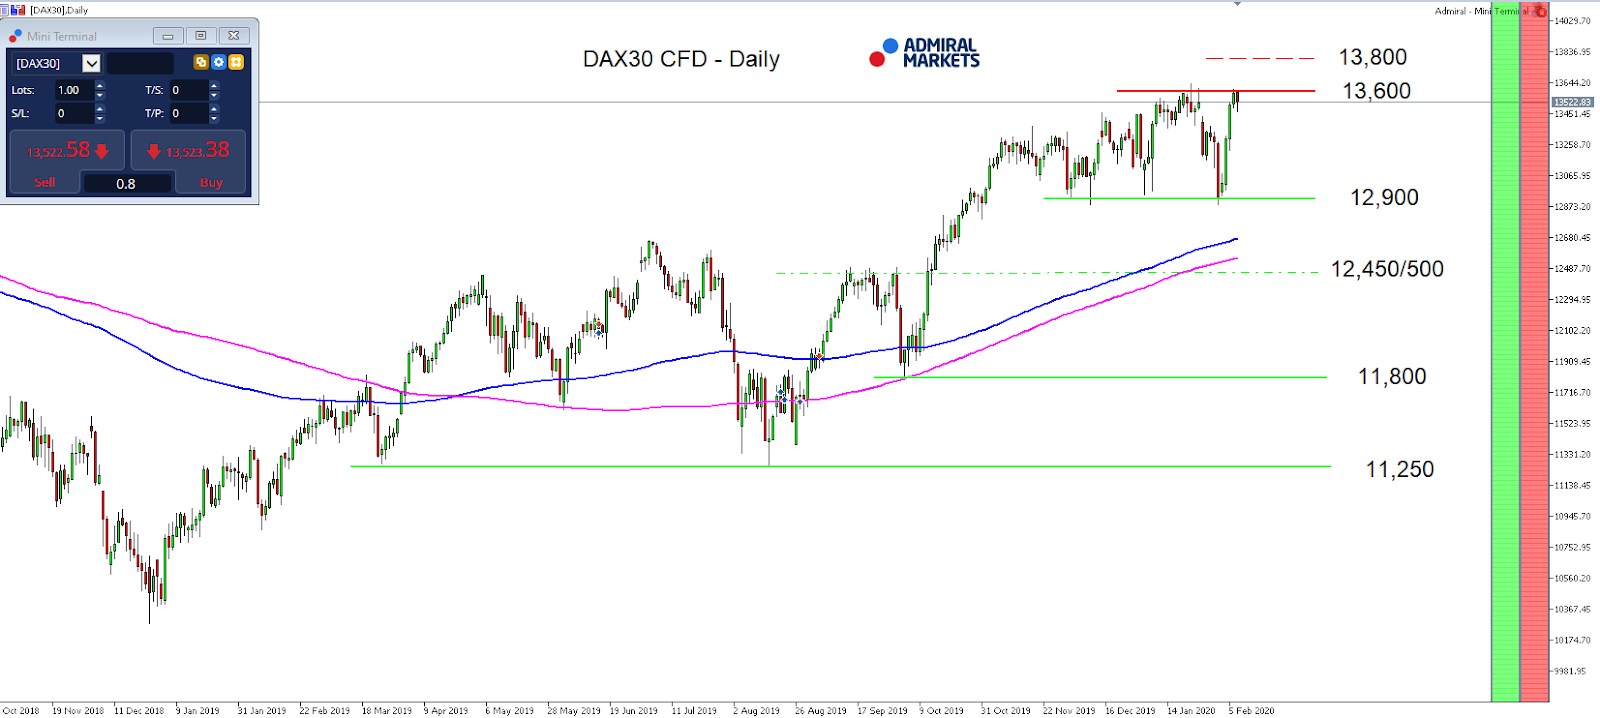
If we rather sooner than later make it to new all-time highs and break above 13,640 points, targets on the upside can be found around 13,800 and 14,000 points.

Hourly chart

Source: Admiral Markets MT5 with MT5-SE Add-on DAX30 CFD Hourly chart (between January 21, 2020, to February 7, 2020). Accessed: February 7, 2020, at 10:00pm GMT

Daily chart

Source: Admiral Markets MT5 with MT5-SE Add-on DAX30 CFD Daily chart (between October 26, 2018, to February 7, 2020). Accessed: February 7, 2020, at 10:00pm GMT – Please note: Past performance is not a reliable indicator of future results, or future performance.

In 2015, the value of the DAX30 CFD increased by 9.56%, in 2016, it increased by 6.87%, in 2017, it increased by 12.51%, in 2018, it fell by 18.26%, in 2019, it increased by 26.44% meaning that after five years, it was up by 34.2%.

Discover the world’s #1 multi-asset platform

Admiral Markets offers professional traders the ability to trade with a custom, upgraded version of MetaTrader 5, allowing you to experience trading at a significantly higher, more rewarding level. Experience benefits such as the addition of the Market Heat Map, so you can compare various currency pairs to see which ones might be lucrative investments, access real-time trading data, and so much more. Click the banner below to start your FREE download of MT5 Supreme Edition!

Download MetaTrader 5 and begin trading today!

Disclaimer: The given data provides additional information regarding all analysis, estimates, prognosis, forecasts or other similar assessments or information (hereinafter “Analysis”) published on the website of Admiral Markets. Before making any investment decisions please pay close attention to the following:

  1. This is a marketing communication. The analysis is published for informative purposes only and are in no way to be construed as investment advice or recommendation. It has not been prepared in accordance with legal requirements designed to promote the independence of investment research, and that it is not subject to any prohibition on dealing ahead of the dissemination of investment research.
  2. Any investment decision is made by each client alone whereas Admiral Markets shall not be responsible for any loss or damage arising from any such decision, whether or not based on the Analysis.
  3. Each of the Analysis is prepared by an independent analyst (Jens Klatt, Professional Trader and Analyst, hereinafter “Author”) based on the Author’s personal estimations.
  4. To ensure that the interests of the clients would be protected and objectivity of the Analysis would not be damaged Admiral Markets has established relevant internal procedures for prevention and management of conflicts of interest.
  5. Whilst every reasonable effort is taken to ensure that all sources of the Analysis are reliable and that all information is presented, as much as possible, in an understandable, timely, precise and complete manner, Admiral Markets does not guarantee the accuracy or completeness of any information contained within the Analysis. The presented figures refer that refer to any past performance is not a reliable indicator of future results.
  6. The contents of the Analysis should not be construed as an express or implied promise, guarantee or implication by Admiral Markets that the client shall profit from the strategies therein or that losses in connection therewith may or shall be limited.
  7. Any kind of previous or modeled performance of financial instruments indicated within the Publication should not be construed as an express or implied promise, guarantee or implication by Admiral Markets for any future performance. The value of the financial instrument may both increase and decrease and the preservation of the asset value is not guaranteed.
  8. The projections included in the Analysis may be subject to additional fees, taxes or other charges, depending on the subject of the Publication. The price list applicable to the services provided by Admiral Markets is publicly available from the website of Admiral Markets.

Leveraged products (including contracts for difference) are speculative in nature and may result in losses or profit. Before you start trading, you should make sure that you understand all the risks

By Admiral Markets

Is The Coronavirus bullish for Stocks?

By TheTechnicalTraders.com

Earnings volatility has certainly been big.  Tesla pushed the markets much higher early this week and the US stock markets have continued the upward momentum after the State Of The Union address and the acquittal of President Trump on Wednesday.  Still, we continue to believe this rally may be a “fake-out” rally with respect to the fallout from the Wuhan virus.  Certainly, foreign investors are continuing to pour capital into the US stock market as the strength of the US Dollar and the strong US economy is drawing investment from all areas of the globe.

We believe the scope of this parabolic rally in the US stock market should actually concern skilled traders.  Markets just don’t go straight up for very long.  The last time this happened was in the 1970s and 1980s.  Very minor volatility during that time prompted a big move higher in the US stock market that set up the eventual DOT COM collapse.

Oil, Shipping, Transportation, Consumer, Manufacturing, and Retail will all take a hit because of the Wuhan virus.  We’ve, personally, received notices from certain suppliers that factory closures in China will greatly delay the fulfillment of orders.  Our opinion is that nations may have to close all or a majority of their cities, ports, and activities in Asia for at least 90+ days in order to allow this virus event to peak and subside.  We don’t see any other way to contain this other than to shut down entire cities and nations.

The US Fed and Central Banks are doing everything possible to continue the economic growth and stability of global economics.  Yet, the reality may suddenly set in that without risking a global virus contagion, nations may be forced to actually shut down all non-essential activities for well over 90+ days (possibly even longer).  If you could stop and consider what it would be like for half of the world, and many of the major manufacturing and supply hubs, to shut down for more than 3 to 6 months while a deadly virus is spreading.

Repo lending continues to show that liquidity is a problem.  We believe this problem could get much worse.  Skilled traders need to be prepared for a sudden and potentially violent change in the direction of the global stock markets.

$TNX – 10 Year US Treasure Yield Daily Chart

30 Year Treasury Bond Price – Daily Chart

There is now a solid wall of inversions in all the treasury notes and bills.  The 10-year yield is inverted with 6-month and shorter durations.  The 30-year long bond dipped below 2.0% for the third time and is just 6 basis points from a record low.

Prepare to capitalize on this “crowd behavior” in the near future.  Right now, the US stock market is pushing higher as Q4 earnings drive future expectations.  Yet, be prepared for the reality of the situation going forward.

This Wuhan virus may present a very real “black swan” event.  At the moment, the US stock market appears to want to rally as earnings and economic data continues to impress investors.  Overall, the real risk to the markets is a broader global economic contagion related to the Wuhan virus and the potential it may have on foreign and regional economies.

Next week is going to be critical for many things I feel. Virus contagion growth, factory closures, Oil breakdown follow through, equities breakout follow through, and the precious metals pending move.

We locked more gains this week with one of our positions as we rebalance our portfolio holdings for these new big trends to emerge. If you want to know where the markets are moving each day and follow my trades then join my ETF Trading Newsletter.

Chris Vermeulen
TheTechnicalTraders.com

Forex Technical Analysis & Forecast 07.02.2020 (EURUSD, GBPUSD, USDCHF, USDJPY, AUDUSD, USDRUB, USDCAD, GOLD, BRENT, BTCUSD)

Article By RoboForex.com

EURUSD, “Euro vs US Dollar”

After reaching the short-term downside target at 1.0978, EURUSD is expected to form a new descending structure towards 1.0957 and then start another correction to test 1.1020 from below.

EURUSD
Risk Warning: the result of previous trading operations do not guarantee the same results in the future

GBPUSD, “Great Britain Pound vs US Dollar”

GBPUSD is still moving downwards. Today, the pair may reach 1.2917 and then start a new correction towards 1.2960. Later, the market may resume trading downwards with the target at 1.2885.

GBPUSD
Risk Warning: the result of previous trading operations do not guarantee the same results in the future

USDCHF, “US Dollar vs Swiss Franc”

After reaching the predicted upside target, USDCHF is consolidating near the highs. Possibly, today the pair may expand this range up to 0.9766 and then start another decline to reach 0.9739. Later, the market may break this range to the downside and start a new correction with the target at 0.9689.

USDCHF
Risk Warning: the result of previous trading operations do not guarantee the same results in the future

USDJPY, “US Dollar vs Japanese Yen”

USDJPY is consolidating above 109.88. Possibly, the pair may expand the range up to 110.05. After that, the instrument may form a new descending structure to break 109.55 and then continue the correction with the target at 109.12.

USDJPY
Risk Warning: the result of previous trading operations do not guarantee the same results in the future

AUDUSD, “Australian Dollar vs US Dollar”

AUDUSD has broken 0.6724. Today, the pair may continue trading downwards with the short-term target at 0.6697.

AUDUSD
Risk Warning: the result of previous trading operations do not guarantee the same results in the future

USDRUB, “US Dollar vs Russian Ruble”

USDRUB has finished the correction at 63.43. Possibly, today the pair may consolidate below this level. If later the price breaks this range to the upside at 63.43, the market may resume growing towards 64.00; if to the downside at 63.20 – form a new descending structure with the target at 62.42.

USDRUB
Risk Warning: the result of previous trading operations do not guarantee the same results in the future

USDCAD, “US Dollar vs Canadian Dollar”

USDCAD is consolidating above 1.3267 without any particular direction. Today, the pair may expand the range up to 1.3315. After that, the instrument may start a new decline with the target at 1.3216.

USDCAD
Risk Warning: the result of previous trading operations do not guarantee the same results in the future

XAUUSD, “Gold vs US Dollar”

Gold is still consolidating around 1559.90. Possibly, the pair may expand the range up to 1572.00 and then continue trading downwards with the short-term target at 1538.50.

GOLD
Risk Warning: the result of previous trading operations do not guarantee the same results in the future

BRENT

Brent has finished the descending wave at 54.10. Possibly, today the pair may correct to reach 55.57 and then start a new decline with the short-term target at 53.50.

BRENT
Risk Warning: the result of previous trading operations do not guarantee the same results in the future

BTCUSD, “Bitcoin vs US Dollar”

BTCUSD has broken 9655.00 upwards. Today, the pair may continue growing to reach 10200.00. Later, the market may correct to break 9000.00 and then continue trading downwards with the target at 8500.00.

BTCUSD

Article By RoboForex.com

Attention!
Forecasts presented in this section only reflect the author’s private opinion and should not be considered as guidance for trading. RoboForex LP bears no responsibility for trading results based on trading recommendations described in these analytical reviews.

Fibonacci Retracements Analysis 07.02.2020 (BITCOIN, ETHEREUM)

Article By RoboForex.com

BTCUSD, “Bitcoin vs US Dollar”

The H4 chart shows a steady rising tendency. BTCUSD is heading towards 50.0% fibo at 10142.00. At the same time, there is a divergence on MACD, which may indicate a possible pullback soon. The support is at 23.6% fibo (8184.75).

BTCUSD
Risk Warning: the result of previous trading operations do not guarantee the same results in the future

In the H1 chart, after finishing the pullback, the pair has entered the upside post-correctional extension area between 138.2 and 161.8% fibo at 9806.30 and 9930.20 respectively. The support is the local low at 9078.80.

BITCOIN
Risk Warning: the result of previous trading operations do not guarantee the same results in the future

ETHUSD, “Ethereum vs. US Dollar”

As we can see in the H4 chart, after updating the high, ETHUSD is trying to fix above 38.2%. The next upside target is 50.0% fibo at 239.50. At the same time, there is a divergence on MACD, which indicates a possible reverse.

ETHEREUM
Risk Warning: the result of previous trading operations do not guarantee the same results in the future

In the H1 chart, the pair is growing towards 50.0% fibo at 239.50, while the MACD indicator is forming a local divergence.

ETHUSD

Article By RoboForex.com

Attention!
Forecasts presented in this section only reflect the author’s private opinion and should not be considered as guidance for trading. RoboForex LP bears no responsibility for trading results based on trading recommendations described in these analytical reviews.

The Analytical Overview of the Main Currency Pairs on 2020.02.07

by JustForex

The EUR/USD currency pair

Technical indicators of the currency pair:
  • Prev Open: 1.09985
  • Open: 1.09796
  • % chg. over the last day: -0.16
  • Day’s range: 1.09770 – 1.09848
  • 52 wk range: 1.0879 – 1.1572

Euro continues to lose ground against USD. EUR/USD quotes have set new local lows. At the moment the trading instrument is consolidating in the range 1.09650-1.09900. Investors took a wait-and-see approach until the publication of the US labor market report for January. Experts predict improvements in the key indicators. We recommend you to pay attention to the difference between actual and forecast values of the indicators. Positions should be opened from key levels.

At 15:30 (GMT+2:00) the US labor statistics will be published.

EUR/USD

The indicators signal the sellers’ strength: the price has fixed below 50 MA and 100 MA.

MACD histogram is in the negative zone, but above the signal line, which gives a weak signal to sell EUR/USD.

The Stochastic Oscillator is in the neutral zone, the %K line is below the %D line, which indicates that the sentiment is bearish.

Trading recommendations
  • Support levels: 1.09650, 1.09200, 1.09000
  • Resistance levels: 1.09900, 1.10100, 1.10300

If the price fixes below 1.09650, expect further decline toward 1.09000.

Alternatively, the quotes could grow toward 1.10200-1.10400.

The GBP/USD currency pair

Technical indicators of the currency pair:
  • Prev Open: 1.29994
  • Open: 1.29261
  • % chg. over the last day: -0.55
  • Day’s range: 1.29248 – 1.29463
  • 52 wk range: 1.1959 – 1.3516

Bearish sentiment prevails on GBP/USD currency pair. During yesterday’s trading the drop in quotations exceeded 70 points. Sterling has updated the local lows. At the moment GBP/USD quotes are consolidated in the range of 1.29200-1.29600. The technical picture signals a further decline in the trading instrument. We recommend you to pay attention to the US economic releases. Positions should be opened from key levels.

The news background on the UK economy is quite calm.

GBP/USD

The price is fixed below 50 MA and 100 MA, which signals the strength of the sellers.

The MACD histogram is in the negative zone, which indicates a bearish sentiment.

The Stochastic Oscillator is in the neutral zone, the %K line started crossing the %D line. There are no signals at the moment.

Trading recommendations
  • Support levels: 1.29200, 1.28700
  • Resistance levels: 1.29600, 1.30100, 1.30450

If the price fixes below 1.29200, expect the quotes to fall toward 1.28800-1.28600.

Alternatively, the quotes could grow toward 1.30000-1.30300.

The USD/CAD currency pair

Technical indicators of the currency pair:
  • Prev Open: 1.32821
  • Open: 1.32840
  • % chg. over the last day: +0.01
  • Day’s range: 1.32824 – 1.32960
  • 52 wk range: 1.2949 – 1.3566

USD/CAD is still moving sideways. There is no defined trend. Investors are waiting for additional drivers. Local support and resistance levels are at 1.32650 and 1.33000 respectively. We expect the release of statistical data on the labor market in Canada and USA. We also recommend you to pay attention to the dynamics of oil prices. Positions should be opened from key levels.

At 15:30 (GMT+2:00) the Canadian labor market report will be published.

USD/CAD

Indicators do not give accurate signals: the price is consolidating near 50 MA and 100 MA.

MACD histogram is near the 0 mark.

The Stochastic Oscillator is located in the neutral zone, the %K line is above the %D line, which indicates a bullish sentiment.

Trading recommendations
  • Support levels: 1.32650, 1.32450, 1.32200
  • Resistance levels: 1.33000, 1.33400

If the price fixes above 1.33000, expect further growth toward 1.33400-1.33600.

Alternatively, the quotes could correct toward 1.32300-1.32100.

The USD/JPY currency pair

Technical indicators of the currency pair:
  • Prev Open: 109.817
  • Open: 109.986
  • % chg. over the last day: +0.14
  • Day’s range: 109.813 – 110.018
  • 52 wk range: 104.45 – 113.53

The USD/JPY currency pair has stabilized after a significant growth since the beginning of this week. At the moment the trading instrument is consolidating. Local support and resistance levels are at 109.700 and 110.000 respectively. The US labor market report for January is in the focus of attention. We also recommend you to pay attention to the US government securities yield dynamics. Positions should be opened from key levels.

The news background on the Japanese economy is quite calm.

USD/JPY

The indicators signal the strength of buyers: the price has fixed above 50 MA and 100 MA.

MACD histogram is close to the 0 mark. There are no accurate signals at the moment.

The Stochastic Oscillator is located in the neutral zone, the %K line is above the %D line, which indicates a bullish sentiment.

Trading recommendations
  • Support levels: 109.700, 109.550, 109.300
  • Resistance levels: 110.00, 110.250

If the price fixes above 110.000, expect further growth toward 110.250-110.500.

Alternatively, the quotes could descend toward 109.400-109.200.

by JustForex

Strong ADP = strong NFP’s and the USD/JPY for a stint above 110.00?

By Admiral Markets

Source: Economic Events February 7, 2020 – Admiral Markets’ Forex Calendar

It’s the first Friday of the month, so forex traders, particularly of the USD/JPY, will watch for the release of the Non-Farm Payrolls with excitement.

This is particularly true after the strong ADP data set last Wednesday, which is usually positively correlated with, and a good indicator of, the NFPs. Here, private businesses in the US hired 291,000 workers in January 2020, the most since May 2015, handily beating market expectations of a 156,000.

With that in mind, today’s NFPs have a solid chance to also beat expectations, and add further fuel to the strong performance of the USD/JPY over the last few days, after the currency pair failed to sustainably break below 108.00.

While the overall technical mode in the USD/JPY stays neutral and choppy, a push above 110.00 brings the region around 110.70 into our focus again, and could potentially be traded on the shorter time-frames.

Still, we remain cautious as to long engagement in the USD/JPY. Because despite solid US economic data over the last few days, expectations among market participants point to the Fed cutting rates by a minimum of 25 basis points in 2020, with a likelihood of around 80% (according to the Fed Watch Tool as of last Thursday).

With that in mind, we think that any bullish moves in the US dollar may be short-lived, and should be cautiously reviewed.

Source: Admiral Markets MT5 with MT5-SE Add-on USD/JPY Daily chart (between November 27, 2018, to February 7, 2020). Accessed: February 7, 2020, at 10:00pm GMT – Please note: Past performance is not a reliable indicator of future results, or future performance.

In 2015, the value of USD/JPY increased by 0.5%, in 2016, it fell by 2.8%, in 2017, it fell by 3.6%, in 2018, it fell by 2.7%, in 2019, it fell by 0.85%, meaning that after five years, it was down by 9.2%.

Discover the world’s #1 multi-asset platform

Admiral Markets offers professional traders the ability to trade with a custom, upgraded version of MetaTrader 5, allowing you to experience trading at a significantly higher, more rewarding level. Experience benefits such as the addition of the Market Heat Map, so you can compare various currency pairs to see which ones might be lucrative investments, access real-time trading data, and so much more. Click the banner below to start your FREE download of MT5 Supreme Edition!

Download MetaTrader 5 and begin trading today!

Disclaimer: The given data provides additional information regarding all analysis, estimates, prognosis, forecasts or other similar assessments or information (hereinafter “Analysis”) published on the website of Admiral Markets. Before making any investment decisions please pay close attention to the following:

  1. This is a marketing communication. The analysis is published for informative purposes only and are in no way to be construed as investment advice or recommendation. It has not been prepared in accordance with legal requirements designed to promote the independence of investment research, and that it is not subject to any prohibition on dealing ahead of the dissemination of investment research.
  2. Any investment decision is made by each client alone whereas Admiral Markets shall not be responsible for any loss or damage arising from any such decision, whether or not based on the Analysis.
  3. Each of the Analysis is prepared by an independent analyst (Jens Klatt, Professional Trader and Analyst, hereinafter “Author”) based on the Author’s personal estimations.
  4. To ensure that the interests of the clients would be protected and objectivity of the Analysis would not be damaged Admiral Markets has established relevant internal procedures for prevention and management of conflicts of interest.
  5. Whilst every reasonable effort is taken to ensure that all sources of the Analysis are reliable and that all information is presented, as much as possible, in an understandable, timely, precise and complete manner, Admiral Markets does not guarantee the accuracy or completeness of any information contained within the Analysis. The presented figures refer that refer to any past performance is not a reliable indicator of future results.
  6. The contents of the Analysis should not be construed as an express or implied promise, guarantee or implication by Admiral Markets that the client shall profit from the strategies therein or that losses in connection therewith may or shall be limited.
  7. Any kind of previous or modeled performance of financial instruments indicated within the Publication should not be construed as an express or implied promise, guarantee or implication by Admiral Markets for any future performance. The value of the financial instrument may both increase and decrease and the preservation of the asset value is not guaranteed.
  8. The projections included in the Analysis may be subject to additional fees, taxes or other charges, depending on the subject of the Publication. The price list applicable to the services provided by Admiral Markets is publicly available from the website of Admiral Markets.

Leveraged products (including contracts for difference) are speculative in nature and may result in losses or profit. Before you start trading, you should make sure that you understand all the risks.

By Admiral Markets

EURUSD: traders waiting on US labour market report

By Alpari.com

On Thursday, February 6, the euro was down at the close of trading. The single currency made an attempt at a recovery at the beginning of the European session, but was soon pegged back upon the release of underwhelming data on German factory orders. This suggests that the Eurozone economy remains in a weak position.

The American session saw further pressure applied, with the drop in the rate accelerating in the wake of the breakout at 1.0990. The fall of the EURUSD pair came to a stop at the 1.0965-mark. GBP also fell, this was attributed to the decline in the number of price quotes and also the favourable economic stats coming out of the USA. The number of Americans applying for unemployment benefits fell to a nine-month low last week, down to 202,000. This report is considered important ahead of today’s release of the Non-Farm Payrolls (NFP) data.

Today’s news (GMT+3):

  • 0:00 Germany: German Industrial Production n.s.a. and w.d.a. (YoY) (Dec), German Trade Balance (Dec).
  • 11:00 Switzerland: CHF Foreign Currency Reserves (Jan).
  • 16:30 Canada: Net Change in Employment (Jan), Unemployment Rate (Jan).
  • 16:30 USA: Change in Non-farm Payrolls (Jan), Unemployment Rate (Jan).
  • 18:00 Canada: Ivey Purchasing Managers Index s.a. (Jan).
  • 21:00 USA: Baker Hughes U.S. Rig Count (Feb 7).

Pic. 1Current situation:

The expectations we had for the American session did not materialise. Bears were stronger than anticipated, stopping any chance of a correction to the balance line. The 1.0990-1.0995 zone was a strong support from the daily timeframe. The rebound required to initiate the formation of a double bottom did not come to fruition.

At the time of writing, the euro is worth 1.0973. Traders are waiting for the release of the NFP report (16:30 Moscow time) and are also keeping an eye on any news that might come out of China. Investors remain cautious, worried by the growth in numbers of those infected and killed by coronavirus in China. According to the latest official data, 31,485 people are ill with the virus, 638 people have died, and 1,603 people have been successfully treated and discharged from hospital.

On days when NFP data is due to be released, we do not make forecasts.This is down to the fact that the indicator is highly unpredictable, the actual figures almost always deviate from the forecast by an average of 30-40,000. Here, we are referring to the mean average deviation from the predicted values. Deviations can sometimes reach 100,000, this is down to the fact that the indicators for the previous two-to-three months are constantly being reviewed and revised. In order for bulls to turn the tide, they need to push the price up to 1.1020 by the close. For bears, their payrolls target is 1.0920.

By Alpari.com