Author Archive for InvestMacro – Page 94

Toward Virus Crossroads?

By Dan Steinbock     

In the coming days, new confirmed cases of the virus outbreak will continue to rise. Nevertheless, there may be some possible signs of steadying in China.

With the new coronavirus – the 2019 novel coronavirus acute respiratory disease (2019-nCoV ARD) – there are now (8 pm Wuhan time, Feb 10) over 42,600 confirmed cases worldwide. If the current pace prevails, that figure will soon exceed 50,000.

And yet, there is something else going on behind the reported figures, something that may allow a sense of cautious optimism about the future.

Toward potential crossroads

Despite international concern and more sensational headlines, the number of the confirmed cases outside China has been relatively low, less than 500. So far there have been only two deaths outside China; one in Hong Kong and another in the Philippines. Both are associated with Wuhan, the epicenter of the outbreak.

While these numbers are likely to increase in the near future, the low starting-point suggests that China’s costly and draconian measures may have saved many lives within and outside China.

Moreover, the pace of the contagion may be changing. In the international media, the spotlight has been mainly on the absolute numbers of accumulated confirmed cases and accumulated deaths. Consequently, the relative increase of the cases has been on the sidelines.

Certainly, both sets of figures have a vital role. In absolute terms, accumulated cases reflect the human toll of the outbreak in which even a single number is a tragedy. Yet, relative terms are critical because they reflect the pace of the virus outbreak.

Although the absolute number of the confirmed cases and deaths is likely to climb for a while longer, the absolute number of the new cases and their daily increase may be decelerating.

In retrospect, the number of accumulated cases began to soar around the third week of January. In part, this can be attributed to the virus outbreak itself and in part to China’s stringent containment measures. On January 24, the confirmed cases exceeded 1,000; a week later, the figure jumped over 10,000; another week later, over 30,000. Unfortunately, the accumulated number will still continue to rise.

Nevertheless, the relative increase of these accumulated cases has progressively decreased ever since mid-January. Toward the end of the month, the rate accelerated briefly, perhaps as the result of the tough quarantine measures in China. While the pace peaked at almost 100% after mid-January, it has declined to zero, even negative (Figure 1).

Figure 1 Accumulated Confirmed Cases, Jan 10 to Feb 10, 2020

Source: DifferenceGroup. Data from China’s National Health Commission

Potential deceleration

Even more importantly, the relative daily increase of new cases, which have critical impact on the longer-term duration and severity of the outbreak, may be amid a crossroads.

The confirmed new cases increased steadily from mid-January soaring to almost 3,900 on February 4. Since then the numbers have fallen below 2,600. In relative terms, the change has been almost progressive, having plunged from almost 350% to negative (Figure 2).

Figure 2 Confirmed New Cases, Jan 10 to Feb 10, 2020

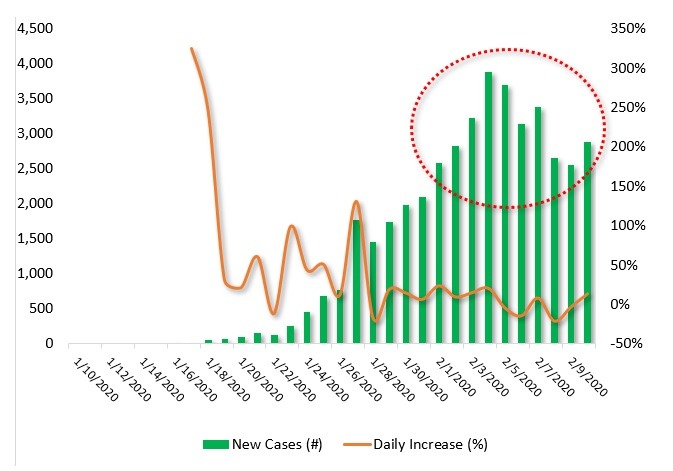
Source: DifferenceGroup. Data from China’s National Health Commission;

While the data could indicate a possible turnaround in the virus outbreak, there is no assurance that the deceleration will prevail. It is well known that virus trend lines can zigzag. Consequently, complacency in the struggle against the outbreak is no option.

There are other caveats as well. Right data is critical. The assumption is that the number of the confirmed cases is relatively realistic.  Furthermore, there is the risk of potential mutation. Current statistics are based on the assumption that the crisis will not result in adverse mutations that would drastically change the outcomes. Finally, the trend is predicated on the idea that containment will succeed outside China, where precautions have been lagging in many countries, including high-income nations.

As WHO chief Tedros Adhanom Ghebreyesus has warned, confirmed cases of coronavirus being transmitted by people who have never traveled to China could be the “tip of the iceberg.”

The big question is, will the deceleration trend remain and strengthen.

 About the Author:

Dr. Dan Steinbock is an internationally recognized strategist of the multipolar world and the founder of Difference Group. He has served at the India, China and America Institute (USA), Shanghai Institutes for International Studies (China) and the EU Center (Singapore). For more, see https://www.differencegroup.net

The original commentary was released by China Daily on Feb. 10, 2020. The data has been updated (Feb 11, 2020)


Japanese Candlesticks Analysis 11.02.2020 (GOLD, NZDUSD)

Article By RoboForex.com

XAUUSD, “Gold vs US Dollar”

As we can see in the H4 chart, the ascending tendency continues. By now, XAUUSD has completed several reversal patterns, such as Hammer, near the channel’s downside border. At the moment, the pair is still reversing. After finishing the correction, the price may resume growing to reach the upside target at 1588.00. However, one shouldn’t ignore another scenario, according to which the instrument may break the support level and continue falling towards 1555.00.

GOLD
Risk Warning: the result of previous trading operations do not guarantee the same results in the future

NZDUSD

As we can see in the H4 chart, the pair is still testing the support level, where it has formed several reversal patterns, including Hammer. At the moment, NZDUSD is expected to reverse; the closest upside target may be at 0.6455. After that, the market may resume its descending tendency. At the same time, one shouldn’t exclude an opposite scenario, according to which the instrument may fall to reach 0.6425 and continue forming the descending channel without reversing.

NZDUSD

Article By RoboForex.com

Attention!
Forecasts presented in this section only reflect the author’s private opinion and should not be considered as guidance for trading. RoboForex LP bears no responsibility for trading results based on trading recommendations described in these analytical reviews.

Fed Chairman Powell’s Speech Is in the Focus of Attention

Article By RoboForex.com

During yesterday’s trading, the US dollar strengthened slightly against a basket of major currencies. The dollar index (#DX) closed in the green zone (+0.18%). Today, investors will be focused on the report by the US Fed Chairman Jerome Powell in Congress.

The euro fell to key lows against the US dollar. The Eurozone economy, as well as the global economy as a whole, are under pressure due to the spread of coronavirus. Yesterday, the World Health Organization (WHO) warned that the spread of cases among people who were not in China could be a “spark that becomes a bigger fire.” According to recent data, the number of cases of the virus has already exceeded 42,500 people, 1,016 deaths.

The “black gold” prices have been growing. Currently, futures for the WTI crude oil are testing the $50.30 mark per barrel.

Market Indicators

Yesterday, there was the bullish sentiment in the US stock market: #SPY (+0.75%), #DIA (+0.60%), #QQQ (+1.21%).

The 10-year US government bonds yield increased slightly. At the moment, the indicator is at the level of 1.59-1.60%.

The Economic News Feed for 11.02.2020:
  • – UK GDP data at 11:30 (GMT+2:00);
  • – Manufacturing production in the UK at 11:30 (GMT+2:00);
  • – JOLTS job openings in the US at 17:00 (GMT+2:00).


We also recommend paying attention to the speech by Fed Chairman Powell.

Article By RoboForex.com

Attention!
Forecasts presented in this section only reflect the author’s private opinion and should not be considered as guidance for trading. RoboForex LP bears no responsibility for trading results based on trading recommendations described in these analytical reviews.

The Analytical Overview of the Main Currency Pairs on 2020.02.11

by JustForex

The EUR/USD currency pair

Technical indicators of the currency pair:
  • Prev Open: 1.09412
  • Open: 1.09107
  • % chg. over the last day: -0.36
  • Day’s range: 1.09080 – 1.09171
  • 52 wk range: 1.0879 – 1.1572

EUR/USD quotes continue to show negative dynamics. The single currency has set new local lows again. Demand for the U.S. dollar remains at a high level. At the moment, the trading instrument is consolidating. The key support and resistance levels are 1.09000 and 1.09400, respectively. Technical correction of the EUR/USD currency pair is not excluded in the nearest future. Positions should be opened from key levels.

Today we recommend paying attention to the speeches of the head of ECB and FOMC representatives.

EUR/USD

The indicators signal the sellers’ strength: the price has fixed below 50 MA and 100 MA.

MACD histogram is in the negative zone, but above the signal line, which gives a weak signal to sell EUR/USD.

The Stochastic Oscillator is in the neutral zone, the %K line is below the %D line, which indicates that the sentiment is bearish.

Trading recommendations
  • Support levels: 1.09000, 1.08700
  • Resistance levels: 1.09400, 1.09700, 1.09900

If the price fixes below the round level of 1.09000, expect a drop toward 1.08700-1.08600.

Alternatively, the quotes could grow toward 1.09700-1.09900.

The GBP/USD currency pair

Technical indicators of the currency pair:
  • Prev Open: 1.28839
  • Open: 1.29148
  • % chg. over the last day: +0.20
  • Day’s range: 1.29074 – 1.29217
  • 52 wk range: 1.1959 – 1.3516

The GBP/USD currency pair has stabilized. Sterling is consolidating at the moment. The key support and resistance levels are: 1.28750 and 1.29250, respectively. Technical correction of the trading instrument is not ruled out in the nearest future. The participants of financial markets took a waiting position before the release of important statistical data on the UK economy. Positions should be opened from key levels.

The Economic News Feed for 11.02.2020:

  • – UK GDP Report (GB) – 11:30 (GMT+2:00);
  • – UK manufacturing output (GB) – 11:30 (GMT+2:00);
GBP/USD

Indicators do not give accurate signals: the price has crossed 50 MA.

MACD histogram is near the 0 mark.

The Stochastic Oscillator is located in the neutral zone, the %K line has crossed the %D line. There are no signals at the moment.

Trading recommendations
  • Support levels: 1.28750, 1.28400
  • Resistance levels: 1.29250, 1.29600, 1.30100

If the price fixes below 1.28750, expect quotes to fall toward 1.28500-1.28300.

Alternatively, the quotes could grow toward 1.29600-1.30000.

The USD/CAD currency pair

Technical indicators of the currency pair:
  • Prev Open: 1.32999
  • Open: 1.33168
  • % chg. over the last day: +0.05
  • Day’s range: 1.32950 – 1.33199
  • 52 wk range: 1.2949 – 1.3566

The USD/CAD currency pair is in sideways movement. There is no defined trend. At the moment, the local support and resistance levels are at 1.32900 and 1.33250, respectively. Investors are waiting for additional drivers. Technical correction of USD/CAD quotes is not excluded in the nearest future. We recommend you to pay attention to the dynamics of black gold prices. Positions should be opened from key levels.

Publication of important economic releases from Canada is not planned.

USD/CAD

Indicators do not give accurate signals: the price has crossed 50 MA and 100 MA.

MACD histogram has gone down, which indicates a development of a correction movement.

The Stochastic Oscillator is located in the oversold area, the %K line has crossed the %D line. No signals at the moment.

Trading recommendations
  • Support levels: 1.32900, 1.32650, 1.32450
  • Resistance levels: 1.33250, 1.33500

If the price fixes above 1.33250, expect the quotes to grow toward 1.33500-1.33700.

Alternatively, the quotes could correct toward 1.32600-1.32400.

The USD/JPY currency pair

Technical indicators of the currency pair:
  • Prev Open: 109.678
  • Open: 109.746
  • % chg. over the last day: +0.14
  • Day’s range: 109.744 – 109.932
  • 52 wk range: 104.45 – 113.53

The USD/JPY currency pair keeps consolidating. The technical picture is ambiguous. At the moment local support and resistance levels are at 109.700 and 110.000, respectively. The correction of the trading instrument is not ruled out in the nearest future. Today we recommend you to pay attention to the statements of the FOMC representatives, as well as to the dynamics of the US government securities yield. Positions should be opened from key levels.

Financial markets in Japan are closed due to the holiday.

USD/JPY

Indicators do not give an accurate signal: 50 MA crossed 100 MA.

The MACD histogram has crossed the positive zone, indicating bullish sentiments.

The Stochastic Oscillator is located in the overbought zone, the %K line crossed the %D line. No signals at the moment.

Trading recommendations
  • Support levels: 109.700, 109.550, 109.300
  • Resistance levels: 110.000, 110.250

If the price fixes above 110.000, expect further growth of USD/JPY quotes towards 110.250-110.400.

Alternatively, the USD/JPY pair may decline to 109.400-109.200.

by JustForex

Stock Market Sector Rotation Should Peak Within 60+ Days – Part II

By TheTechnicalTradersThe first part of this article highlighted what we believe is the start of a broad market sector rotation setup in the US and global markets.  This second part will highlight what we believe are excellent examples of sector trade setups for our friends and followers.

As China continues to pour capital into their markets to stabilize the outflow and fall of asset prices, a number of interesting components of broader sector rotation are setting up.  First, the US stock market has rolled lower in what we are calling a “first-tier” of the “waterfall event”.

Additionally, Mid-Caps, Transportation, Energy, and Financials have all started to roll-over of already begun to rotate lower.  We believe the contraction in economic activity and global market engagement as a result of the Wuhan virus will result in a much bigger and broader downside price move than many are expecting in the coming weeks.

The death toll for the Coronavirus outbreak reached 910, surpassing the number that died in the 2003 SARS episode. This is causing huge issues with global supply chains and shipping companies as I talked about last week in my HoweStreet Interview.

We believe traders need to be aware of the continued capital shift that has been taking place over the past 4+ years.  As foreign markets struggle and the US Dollar continues to strengthen, capital has been moving into the US stock market as a protective measure.  We believe this will continue throughout the virus event, yet we believe the US stock market will contract, move lower, as a result of this virus event as well.

Many US companies are still exposed to foreign markets through overseas engagement and retail locations,  Automakers, consumer products, manufacturing, heavy equipment and dozens of other sectors derive 5% to 25%+ of their revenues from China and other overseas markets.  MacDonalds, Starbucks, Caterpillar and dozens of other US companies have broad exposure in China and Asia.  We believe this virus event could last well into July and possibly much longer.  Because of this, we believe a broader market sector rotation will take place and that volatility will continue to increase over the next 6 to 12+ months.

Here are the three sectors we believe have a strong potential for setting up a fantastic trade.  Follow our research to learn more about what we do and how we can help you find incredible trade setups.

Russell 2000 (IWM) – Weekly Chart

The Russell 2000 (IWM) has already started to move a bit lower over the last few weeks.  Even though the US stock market was plowing higher throughout most of December and January, the Russell 2000 is actually showing signs of a rounded top formation with a very clear downside “first leg” (waterfall) type of price decline.  We believe broader market contraction and sector rotation could push IWM below $144 in an attempt to target historical support near $126.

TECS Technology Sector ETF – Weekly Chart

The Technology sector may see a broader market decline over the next 30 to 60 days that could push TECS from recent lows, below $6, to levels above $12 to $16 on a reactionary move in this 3x ETF.  TECS has experienced very low volatility over the past 3+ months while the US stock market has continued to rally in Q3 and Q4.  Any breakdown in the global technology sector could push TECS well above recent peak levels near $18.

XLF Financial Sector ETF – Weekly Chart

The Financial Sector is very likely to experience a 3% to 10% decrease in consumer activity related to the lack of travel, outside entertainment, shopping and food services activities and could see extended risk to loans, debts, and other services as a result of a global economic market contraction.  We believe a downside risk exists in XLF where the price will likely break below $30 and target the $25 to $26 level over the next 30 to 60+ days.  Ultimately, XLF must hold above the December 2018 lows near $22 if the current downside rotation ends within recent price ranges.  A move below $22 would indicate we have entered a new stage of a Bear trend.

The reality of the situation for most of us is that we are not at immediate risk of catching anything except a common cold or flu.  As skilled traders, we must identify an opportunity where it presents itself and we must attempt to learn to capitalize on that opportunity.  We believe these sectors, and many others, are about to present very real trading opportunities for skilled traders.

The virus is expected to double in scope every 6.5 days based on modeling data.  Obviously China and Asia are the biggest risks right now.  Our biggest concern is that the virus spreads into India and Africa.  We believe a spread into these regions could add hundreds of thousands or millions of infected people to the lists.  At this point, it is far too early to tell how extended this virus event will become – yet we feel we are just starting this rotation and the true scope of it won’t be known for many weeks or months.

Join us in our quest to create incredible profits from these bigger trends today. As a technical analyst and trader since 1997 I have been through a few bull/bear market cycles, I have a good pulse on the market and timing key turning points for both short-term swing trading and long-term investment capital. The opportunities are massive/life-changing if handled properly.

Join my Swing Trading ETF Wealth Building Newsletter if you like what you read here and ride my coattails as I navigate these financial markets and build wealth while others lose nearly everything they own.

Chris Vermeulen
TheTechnicalTraders.com

NOTICE: Our free research does not constitute a trade recommendation or solicitation for our readers to take any action regarding this research.  It is provided for educational purposes only.  Our research team produces these research articles to share information with our followers/readers in an effort to try to keep you well informed.  Visit our web site (www.thetechnicaltraders.com) to learn how to take advantage of our members-only research and trading signals.


Is China At Risk Of A Coronavirus Recession Now?

By Orbex

First, let’s get the official Chinese response out of the way: no, there is no risk of China entering a recession because of the novel coronavirus.

The standard line from the Chinese government is that they will overcome the situation. And, while there might be some economic bruising, they claim that everything is fine.

Just like everything was fine back in December, when the doctor who was warning colleagues about a new strain of SARS-like virus, got arrested for alarming the public.

So take the official position with a grain of salt. Understand, though, that official economic measurements are likely to reflect public policy objectives.

But, Unofficially?

The thing that is most riling up the markets around coronavirus isn’t so much the epidemic itself. It’s that there are important gaps in information that would help us understand what’s going on and what to expect in the future.

The markets really don’t like uncertainty. And the lack of transparency from Chinese officials is likely to continue to spook investors.

So far, independent analysts have projected that the effect of the virus on the Chinese economy will be a loss of around one percentage point of GDP. For an economy the size of China’s, that’s a major impact.

But, if we go by the official growth rate of last year, which came in at 6.0%, the implication would be that in 2020, China would grow by around 5.0%. That’s far from a technical recession, let alone a full-blown recession.

However, that doesn’t mean it isn’t enough to tip the world into some kind of financial problem.

Let’s Take Apart a Couple of Things:

1. Technical Recession

Just two quarters of negative growth would count as a recession. But that wouldn’t include Q4. So, in order for there to be a technical recession, we’d have to have the next six months of negative growth.

This would imply that the virus would have to afflict most of the country for an extended period of time.

2. Official Numbers

There are lots of analysts who question the official numbers, saying that Chinese growth is inflated. Some say that China grows around 1-2% in reality. So, the effects of a viral outbreak could lead to a recession.

But there isn’t any consensus on what “nonofficial” economic figures are.

3. It’s a Coronavirus

Coronaviruses are not new. In fact, you likely were infected with one at least once last year. They are one of the major causes of the common cold. Usually, people who are immunocompromised are at an increased risk.

This one appears to have a higher mortality rate. But, without any trust in the official number of infections, projecting the mortality rate has been challenging. China’s initial response of suppressing reports on infections might have grossly exaggerated the lethality of the virus.

Small Moves Can Have Big Repercussions

The world has gotten used to steady growth from China. Even if the country doesn’t fall into recession, just slowing down can have a domino effect across the world.

As the largest consumer of raw materials, slower growth would imply a drop in demand (as has already been seen.) And, it would significantly lower commodities prices. This would be enough to put many other countries, which already suffering from substandard growth, over the line into recession.

Worrying about a potential Chinese recession might be one step too far ahead. Australia, Mexico, Brazil, Chile, Russia, and New Zealand among others are likely to enter a recession before China does. At least officially.

By Orbex

USD Strong Following NFP Beat

By Orbex

USD Starts Quietly

The US dollar has had a subdued start to the week with the index trading lightly at 98.54, sitting just below recent highs. A raft of better data last week has improved the outlook for USD, headlined by a strong January NFP reading which came in at 225k vs 163k expected. Looking ahead this week, retail sales and CPI will be the main readings due on Thursday and Friday.

Euro Holds Below 1.10

EURUSD has been a little higher this morning, though is still sitting at the bottom of last week’s declines, with price having broken through the 1.10 support level last week. The resurgence in USD has weighed heavily on EUR recently. The currency remains under pressure in the wake of dovish comments from ECB’s Lagarde who warned markets not to assume that ECB policy will be on auto-pilot this year.

GBP Attempting to Recover

GBPUSD is attempting to rally this morning with price pushing up off the session’s 1.2872 lows to trade 1.2902 last. GBP has been under pressure recently over concerns for the UK/EU trade talks which got off to a rocky start last week as EU and UK leaders laid out very disparate visions for the future trade relationship.

Risk Sentiment Weakens

Risk assets have been lower again over the early European session on Monday as fears continue to drive uncertainty over the ongoing spread of coronavirus. The SPX500 has come under pressure again as the recent slew of positive US data has weakened any expectations of potential US easing. The SPX500 trades 3324.68 last, having found support at 3313.93 overnight.

JPY & Gold Higher

Safe-havens have had a quiet start to the week but both JPY and gold remain supported against the US dollar, given the risk-off tone to equities markets this morning. USDJPY trades 109.76 last, with price peeling back from the recent 110 highs. XAUUSD trades 1574. 55 last, having found support at the 1555.38.

Crude Down

Oil prices have been softer at the start of the week in light of the broad risk-off tone which we have seen so far today. Equities and commodities have been under pressure from the ongoing coronavirus outbreak which is hurting the demand outlook for oil. Crude trades 50.26 last, just up off the recent 49.43 lows.

Loonie Capped at 1.33

USDCAD is still trading around the 1.33 level. Following a brief spell above the level last week, price has now dropped back below. However, given the ongoing rally in USD and the weakness in crude prices, further upside is likely.

Aussie Back Above Key Support

AUDUSD has been softer today, as the general pull-back in risk assets weighs on sentiment. Trading .6695 last, price is back above the .6682 level support. Looking ahead this week, RBA Governor Lowe is due to give a speech, which will be the main Aussie trading focus.

By Orbex

The Week Ahead: The Brexit Rewind

By Orbex

Trade of the Week

GBPUSD softens as trade uncertainty looms

Post-Brexit euphoria might have come to an end as investors shifted their focus to EU-UK trade negotiations. The reality is that each side has a different vision of the shape and the substance of their future partnership, particularly in areas of immigration and the Irish border. Markets are likely to be jittered as uncertainty remains. Tuesday’s GDP figure would offer a gauge on the impact of the Brexit on the British economy. Disappointing data could further depress cable. As the pair sinks below the rising trend line, the tide might have turned. 1.2850 would be the next support to look for.

EURJPY struggles to recover

The single currency slipped against other majors amidst worries that the bloc’s economy is far from turning around. Weak German industrial output came in sharp contrast with European Central Bank President Christine Lagarde’s reassurance of recovery. This Friday’s GDP data across the Eurozone may clarify whether the economy has indeed been stabilising. The breakout below 120.20 has dented the bullish sentiment. If the pair fails to rally above 121.00 near the moving averages, 119.40 could be the next target.

NZDCAD remains under pressure

Is the New Zealand dollar’s latest weakness a tactical retreat ahead of the RBNZ’s interest rate decision on Wednesday? December’s better-than-expected CPI, which rose to 1.9% may favour a less dovish outlook from the central bank. This could help the kiwi recoup some losses. However, as China is New Zealand’s major trading partner, disruptions from the virus could weigh on medium-term activity and cap the currency’s rebound. Sentiment has turned to the downside after the pair broke below the psychological level of 0.8600. Another break below 0.8500 may trigger an extended sell-off.

WTI crude plunges as demand falls

Weak oil demand from China amid the coronavirus outbreak continues to weigh on the commodity’s prices. Large scale quarantine and travel restriction in China and across Asia to some extent have shed global consumption. Disruptions to China’s economic activity could last for the first part of the year, which means we have yet to see an end to the oil demand shock. After a drop below the major support of 50, the bearish mood has prevailed. The price may pull back towards the 52-53 area before new sellers join in.

By Orbex


Markets Reverse As Coronavirus Worsens

By Orbex

The Chinese coronavirus outbreak continues to dominate news flows. The latest figure released over the weekend showed that the number of confirmed cases in China has soared to nearly 40,000 with the death toll rising above 800. This latest increase in the death toll means that more people have died in China as a result of the disease than died globally during the SARS outbreak of 2003.

“Intense Outbreak”

Over the last week, an average of 86 people a day have been dying in China, where almost 4000 extra cases were confirmed over the weekend alone. The Hubei province and Wuhan specifically, continue to see the majority of fresh cases confirmed.

Over recent days, the Chinese government stated that the number of new cases confirmed had begun to stabilize. However, the World Health Organisation warned that the Hubei province is still in the middle of a “very intense outbreak” adding that “it’s very, very early to make predictions”.

Vaccine hopes

Last week, there were some reports circulating suggesting that Chinese researchers were close to announcing a vaccine for the virus. However, these reports went unconfirmed. The WHO released a statement saying that research is still ongoing globally, though no vaccine has been found yet.

WHO Downplay Hopes of Cure

Referring to the ongoing outbreak and comments that deaths and cases in China have stabilized recently, the WHO’s director-general Dr. Tedros Adhanom Ghebreyesus made a statement.

He said:

“We have to understand it with caution because it can show stability for a few days and then they can shoot up. I’ve said it many times, it’s slow now but it may accelerate.”

Risk Appetite Under Pressure

The market impact from the ongoing outbreak has now reverted back to weakness in equities and commodities prices. Risk appetite has seen some improvement into the middle of last week as reports of a potential vaccine emerged.

However, with the WHO dismissing claims of a breakthrough, and warning against further spread of the infection, risk appetite has weakened again now with equities and commodities under pressure.

Technical Perspective

The pull-back in the SPX500 over recent days has seen price correcting lower from the 3358.86 highs, trading back below the 3337.75. The current price action is framed by a bearish channel, which can be viewed as a bull flag, suggesting an eventual break higher while price holds above the 3313.93 (structural support and bear channel low). If price breaks below here, the 3298.92 level is the next area to watch. For now, the current move looks corrective and a further move higher is still on watch.

By Orbex


EUR/USD: Attitude to Risk Is Still Moderate

By Dmitriy Gurkovskiy, Chief Analyst at RoboForex

On Monday, February 10th, EUR/USD is trading at 1.0955. The European currency is slightly correcting but still moving close to the lows of October 2019.

Because of the Chinese coronavirus story, the demand for risky assets remains quite cautious.

The January statistics on the employment market published last Friday by the USA were in favor of the USD. For example, the Non-Farm Employment Change showed 225K after being 147K and against the expected reading of 163K. The Unemployment Rate got a little bit worse as it increased up to 3.6% after being 3.5% the month before.

The Average Hourly Earnings added 0.2% m/m, which is a bit lower than expected (+0.3% m/m), but better than in December (+0.1% m/m).

Stay tuned to the RoboForex Blog for exclusive financial forecasts, professional expert analysis, how-to articles and more.

In the H4 chart, EUR/USD has reached its predicted downside target at 1.0955. Looking at the fifth structure of the descending wave, we may assume that the price may continue falling with the key target of this entire wave at 1.0927. Possibly, today the pair complete it and then start a new wave to the upside to reach 1.1010. From the technical point of view, this scenario is confirmed by MACD Oscillator: its signal line is moving below 0 inside the histogram area. The line is expected to leave the area and grow to break 0. After that, the instrument may boost its growth on the price chart.

As we can see in the H1 chart, EUR/USD is forming a narrow consolidating range below 1.0955. Today, the pair may break 1.0940 and then continue falling towards 1.0935. Later, the market may return to 1.0940 to test it from below and then start another decline to reach 1.0927 and finish this downtrend. From the technical point of view, this scenario is confirmed by Stochastic Oscillator: its signal line is moving above 80 and may resume falling soon. After breaking this level, the indicator may move downwards to reach 50, thus confirming further decline of the price towards its key target.

Disclaimer

Any predictions contained herein are based on the authors’ particular opinion. This analysis shall not be treated as trading advice. RoboForex shall not be held liable for the results of the trades arising from relying upon trading recommendations and reviews contained herein.