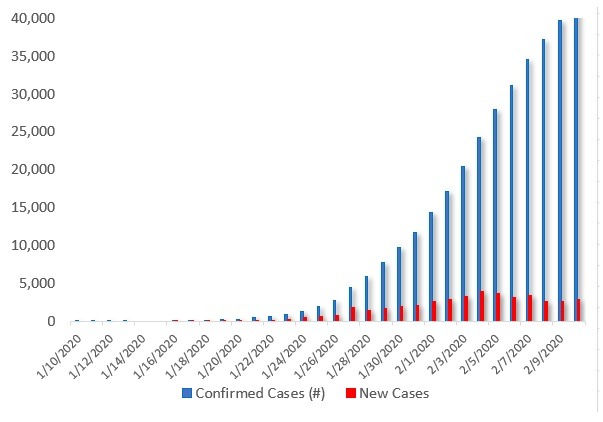
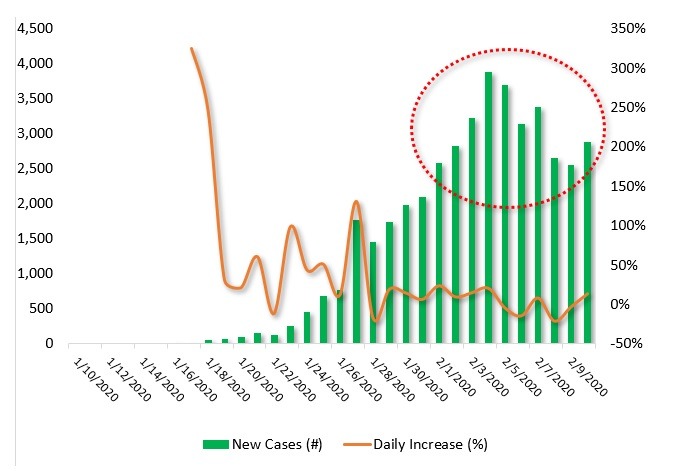
By TheTechnicalTraders – An almost immediate reaction to the Coronavirus outbreak in China and throughout most of the world has sent shock-wave through the global markets – particularly seen in Shipping and Oil. The actions within China to attempt to contain the virus spread include shutting down entire cities and setting up mass quarantine events. It is estimated that as many as 8+ million people were quarantined within cities in China throughout the Chinese New Year.
Chinese President, Xi Jinping, warned recently that the Coronavirus, and the efforts to stop it, may greatly reduce the Chinese economy over the next few months. The Chinese President urged top officials to refrain from “more restrictive measures” to contain the virus. It is our opinion that more restrictive measures are essential to efforts to contain the spread of this virus and that further contraction in the Chinese economy, as well as other economies, are almost set in stone at this point.
Information we’ve received from some friends living in China and Hong Kong suggest travel is very restricted, face masks are very scarce, people are staying inside their homes and surviving as family units within very close contact with one another. They are scared, trapped and unable to do anything other than try to wait this out. Imagine what this is doing to the local economies, shops, offices, and businesses?
Reflectively, global shipping rates have collapsed over the past 30+ days as one of the first signs of the contraction in the global markets. As of December 31, 2019, both Tanker and Dry-Bulk rates were hovering near $14,000 per day. Now, this rate is near $2500 per day – a -82% decrease. As you consider the broader aspects of this massive decrease in shipping rates, consider the global contagion event that may setup if the Belt-Road region is adversely hit with the Corona Virus.

Source: Bloomberg.com
SEA Shipping Sector ETF – Daily Chart
Shipping stocks are taking a beating. Factories are shut down, the product is not being shipped, and even product ready to be shipped many don’t want to take delivery for the time being.
From a short term standpoint, this sector is looking oversold, but depending on how much the virus spreads we could see another 20% from the current price.

China’s Belt-Road Infrastructure Projects
China’s Belt-Road Initiative consists of massive infrastructure, port, and other projects throughout Europe, Asia, India, Pakistan, Iran, Turkey, Russia, Africa, and other nations. These projects have been initiated over the past 5+ years and are well underway. We believe the spread of the Coronavirus may follow a path along with the Belt and Road projects and potentially infect a larger number of individuals over the next 30+ days than originally expected. If this virus moves into the Middle East or Africa, containment may become very difficult.

The reality is that Shipping and Commodities could see a dramatic price decline as this virus outbreak continues over the next 60+ days. Reports are already starting to hit the news wires that Autos and manufacturing supplies are starting to pile up and ports in China. Without a functioning manufacturing sector and workers to keep everything running, China’s economy will grind to a halt very quickly.
This translates into lower Oil prices, lower raw material prices and higher metals prices. A capital shift will continue to take place throughout the world where capital will move away from risky environments and towards more secure investment environments. Thus, capital will move away from Asia, India, the Middle East and potentially Europe and towards the USA, Canada and possibly Mexico. Everything depends on what happens over the next 60 to 90+ days with regards to this virus outbreak.
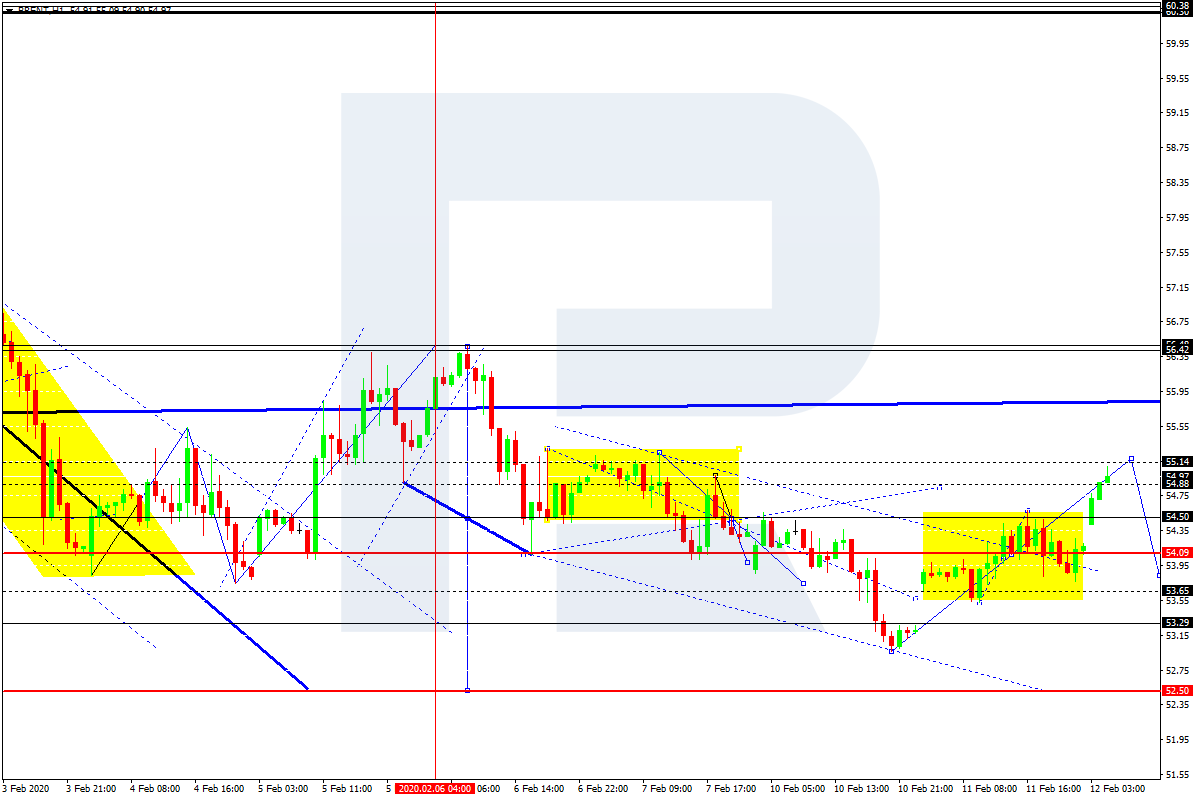
Monthly Crude Oil chart
This Monthly Crude Oil chart shows how quickly Oil rotated lower in January 2020. Currently, Oil is trading near $50 per barrel and may break lower towards the $44 to $46 price level before finding any real support. Overall, our research team believes Oil may reach as low as $35 to $36 ppb before reaching a bottom. You can read our earlier research here: https://www.thetechnicaltraders.com/oil-begins-to-move-lower-will-our-predictions-come-true. Within that research post, dated November 19, 2019, we highlighted our earlier predictive modeling research from July 2019 suggesting Oil would break substantially lower in November 2019 and again in February 2020. We predicted this downside move in Oil nearly 8+ before it happened.

Transportation Index Monthly Chart
This Transportation Index Monthly chart highlights the sideways FLAG formation setting up in the US Transportation sector. If the US market breaks lower as a result of lower global economic activity, we believe we will see the Transportation Index fall very quickly to levels below $9,500. A breakdown in the Transportation Index would be an early warning sign that the US economy is headed towards a recession or contraction event. Global shipping has already confirmed this event is taking place – yet the US Transportation sector has not shown much weakness.

Traders need to be very aware of the risks in the markets and the continued Capital Shift that is taking place throughout the planet. Capital is running away from risk and pouring into more stable markets. The ultimate risks to the global economy are for those nations where debt/economy levels are fragile, to begin with – which is why we highlighted the Belt Road project. If China enters a protective mode where the Chinese Central Bank attempts to bail out Chinese companies/initiatives, we believe the Belt Road project could become a great risk. And we believe this could happen very quickly given the current market environment.
The dynamics of global markets are changing very quickly. It is time for traders to prepare for bigger volatility and large range sector rotation. Follow our research, learn how we can help you stay ahead of these bigger moves in the markets. 2020 is going to be a fantastic year for skilled traders – you just have to stay ahead of the risks and be prepared to take advantage of the opportunities as they are presented.
Join my Swing Trading ETF Wealth Building Newsletter if you like what you read here and ride my coattails as I navigate these financial markets and build wealth while others lose nearly everything they own.
Chris Vermeulen
TheTechnicalTraders.com

NOTICE: Our free research does not constitute a trade recommendation or solicitation for our readers to take any action regarding this research. It is provided for educational purposes only. Our research team produces these research articles to share information with our followers/readers in an effort to try to keep you well informed. Visit our web site (www.thetechnicaltraders.com) to learn how to take advantage of our members-only research and trading signals.