Author Archive for InvestMacro – Page 82

Will the Non-Farm Payrolls trigger a bearish push towards 105 for the USD/JPY?

By Admiral Markets

Economic Events

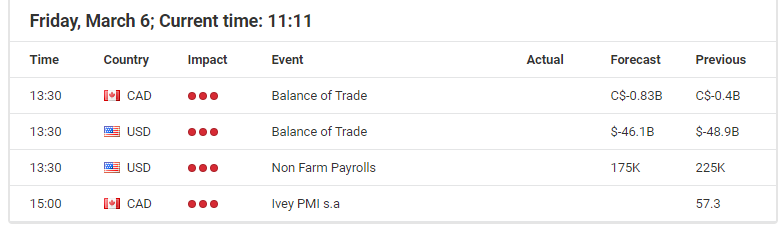
Source: Economic Events March 6, 2020 – Admiral Markets’ Forex Calendar

This past highly volatile week of trading, especially in US yields, is to finish with one of the most exciting trading news events among traders: the Non-Farm Payrolls.

Given the current bias among market participants, the risk-off mode and the anxious following of developments in the Coronavirus, the release of the Non-Farm Payrolls could trigger another round of volatility in US yields, particularly if numbers come in worse than expected, which could renew fears of a US recession.

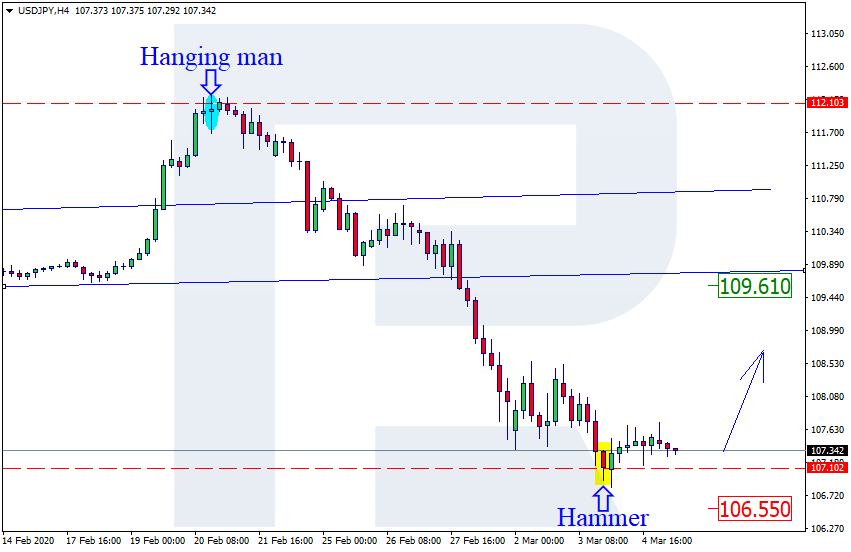
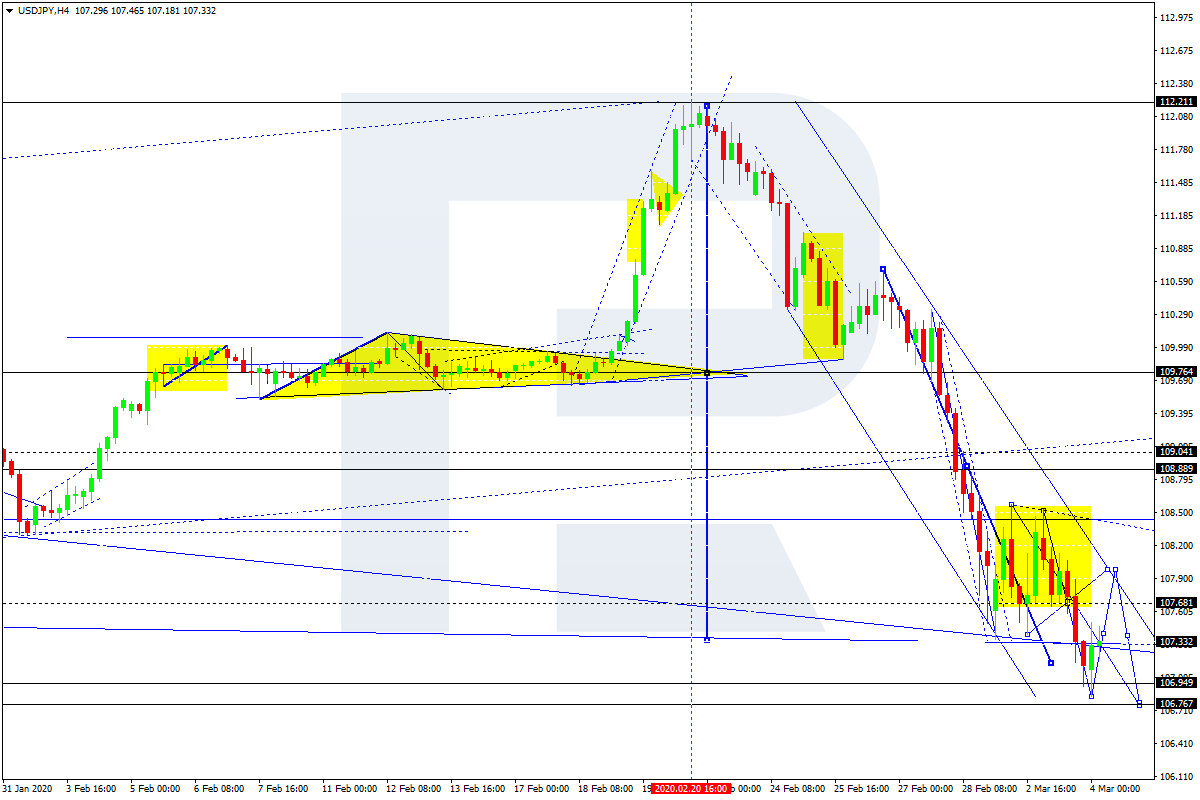
After the “emergency rate cut” of 50 basis points by the Fed last Tuesday, the USD/JPY broke below 107.80/108.00 and went for a test of the region around 106.80/107.00.

It was the first “emergency rate cut” since October 2008, during the week when the Lehman Brothers Investment bank collapsed, and 10-year US Treasury yields dropped below 1.00% for the first time ever, pushing the USD/JPY dropped to its lowest levels since last October.

A disappointing print today (something significantly below 150,000) could trigger a next bearish wave, bringing the region around 106.80/107.00 under pressure.

If we get to see a sustainable break lower into the weekly close, such an move would activate the region around the 2019 yearly lows around 105.00 as a next target.

Short-term bounces, driven probably by a surprising solid print and bounce back in 10-year US yields, would find a potential stronger zone of resistance around 108.50/109.00:

Daily chart

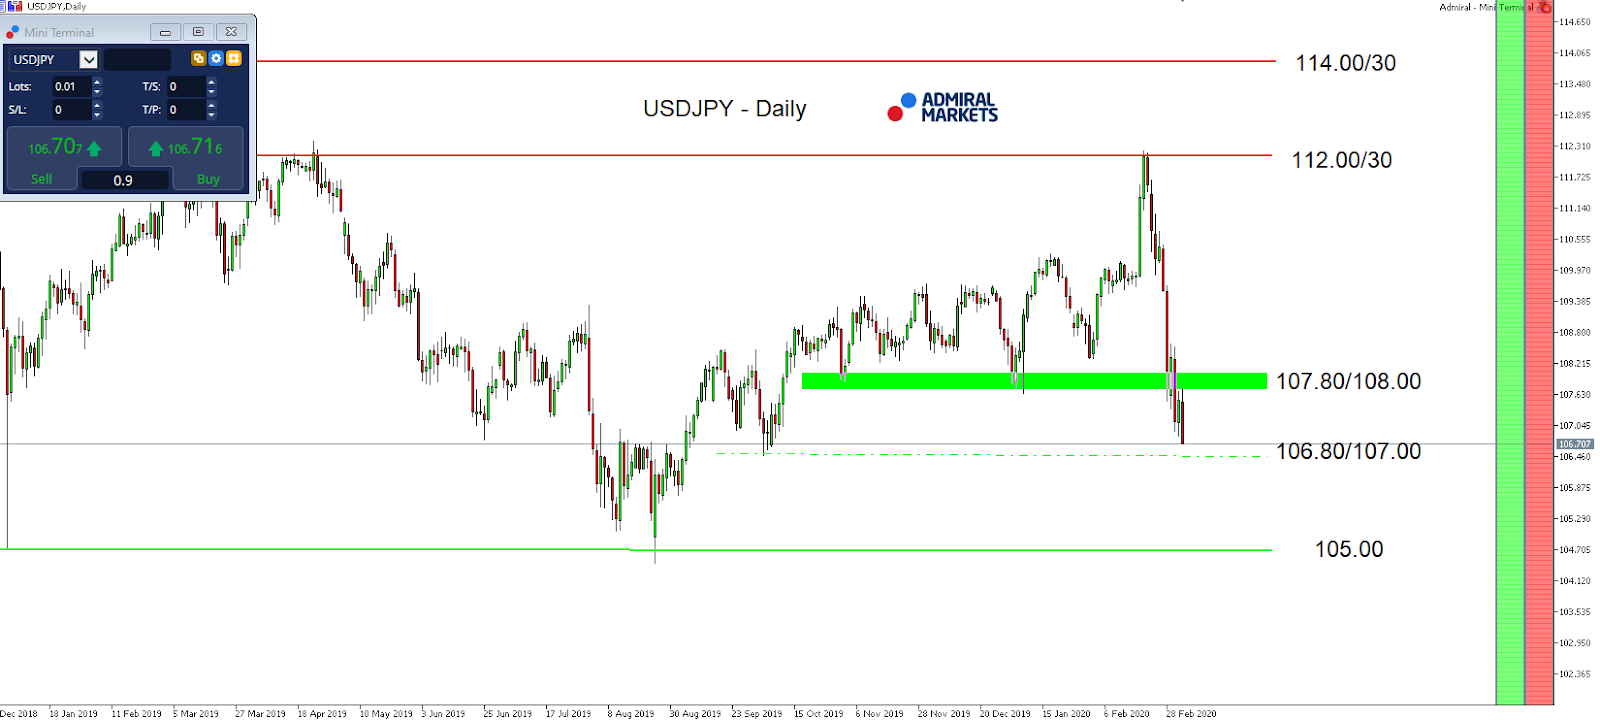
Source: Admiral Markets MT5 with MT5-SE Add-on USD/JPY Daily chart (between December 26, 2018, to March 5, 2020). Accessed: March 5, 2020, at 10:00pm GMT – Please note: Past performance is not a reliable indicator of future results, or future performance.

In 2015, the value of USDJPY increased by 0.5%, in 2016 it fell by 2.8%, in 2017 it fell by 3.6%, in 2018 it fell by 2.7%, in 2019 it fell by 0.85%, meaning that after five years, it was down by 9.2%.

Discover the world’s #1 multi-asset platform

Admiral Markets offers professional traders the ability to trade with a custom, upgraded version of MetaTrader 5, allowing you to experience trading at a significantly higher, more rewarding level. Experience benefits such as the addition of the Market Heat Map, so you can compare various currency pairs to see which ones might be lucrative investments, access real-time trading data, and so much more. Click the banner below to start your FREE download of MT5 Supreme Edition!

Trade With MetaTrader 5

Disclaimer: The given data provides additional information regarding all analysis, estimates, prognosis, forecasts or other similar assessments or information (hereinafter “Analysis”) published on the website of Admiral Markets. Before making any investment decisions please pay close attention to the following:

  1. This is a marketing communication. The analysis is published for informative purposes only and are in no way to be construed as investment advice or recommendation. It has not been prepared in accordance with legal requirements designed to promote the independence of investment research, and that it is not subject to any prohibition on dealing ahead of the dissemination of investment research.
  2. Any investment decision is made by each client alone whereas Admiral Markets shall not be responsible for any loss or damage arising from any such decision, whether or not based on the Analysis.
  3. Each of the Analysis is prepared by an independent analyst (Jens Klatt, Professional Trader and Analyst, hereinafter “Author”) based on the Author’s personal estimations.
  4. To ensure that the interests of the clients would be protected and objectivity of the Analysis would not be damaged Admiral Markets has established relevant internal procedures for prevention and management of conflicts of interest.
  5. Whilst every reasonable effort is taken to ensure that all sources of the Analysis are reliable and that all information is presented, as much as possible, in an understandable, timely, precise and complete manner, Admiral Markets does not guarantee the accuracy or completeness of any information contained within the Analysis. The presented figures refer that refer to any past performance is not a reliable indicator of future results.
  6. The contents of the Analysis should not be construed as an express or implied promise, guarantee or implication by Admiral Markets that the client shall profit from the strategies therein or that losses in connection therewith may or shall be limited.
  7. Any kind of previous or modeled performance of financial instruments indicated within the Publication should not be construed as an express or implied promise, guarantee or implication by Admiral Markets for any future performance. The value of the financial instrument may both increase and decrease and the preservation of the asset value is not guaranteed.
  8. The projections included in the Analysis may be subject to additional fees, taxes or other charges, depending on the subject of the Publication. The price list applicable to the services provided by Admiral Markets is publicly available from the website of Admiral Markets.
  9. Leveraged products (including contracts for difference) are speculative in nature and may result in losses or profit. Before you start trading, you should make sure that you understand all the risks.

By Admiral Markets

New era of negative rates looming? Investors move to top-up portfolios

By George Prior

A fresh era of negative interest rates is looming and investors are now seeking to top-up their portfolios with equities, says the CEO of one of the world’s largest independent financial advisory organisations.

Nigel Green, the deVere Group chief executive and founder, is speaking out after the U.S. Federal Reserve’s emergency rate cut on Tuesday – the first since the 2008 financial crash – as it tries to limit the economic impact of the coronavirus outbreak.

Mr Green affirms: “There’s been one historic cut already and there are signals that the Fed – the world’s de facto central bank – will make deeper cuts imminently.

“As it scrambles to protect the U.S. economy from the far-reaching fallout of the coronavirus, it can be expected that it could take rates back down to zero – emergency territory – in the next few months.

“This then raises the spectre that the Fed will ultimately follow its peers in Europe and Japan by adopting negative interest rates.”

He continues: “There is much debate and scepticism regarding the effectiveness of slashing rates in response to a global public health crisis and the resulting market turmoil.

“Negative rates can be misinterpreted by the public. They have been viewed as a warning to consumers and investors, that the underlying economies are in a dangerously weak position, and hit investor and consumer demand.”

Mr Green continues: “However, while the jury is out on whether negative interest rates help the real economy, there is no doubt that they help boost financial asset prices.

“As such, with coronavirus possibly ushering in a fresh era of negative interest rates, investors are now seeking to top-up their portfolios with equities before the next round of cuts and the likely subsequent price jump. They are seeking the lower entry points before the market surge.

“Those with savings in the bank are already getting battered by the ultra-low interest rates they are getting,

“Negative rates will give more investors more reason to increase their exposure to equities.”

The deVere CEO concludes: “There question mark remains on whether cutting rates from their already low levels will solve the issues created by the coronavirus outbreak.

“But rate cuts – and it is likely there will be deeper ones to come – will push up financial asset prices and right now many investors are looking to get ahead of the curve on this.”

About:

deVere Group is one of the world’s largest independent advisors of specialist global financial solutions to international, local mass affluent, and high-net-worth clients.  It has a network of more than 70 offices across the world, over 80,000 clients and $12bn under advisement.


Japanese Candlesticks Analysis 05.03.2020 (EURUSD, USDJPY, EURGBP)

Article By RoboForex.com

EURUSD, “Euro vs. US Dollar”

As we can see in the H4 chart, the pair continues growing. By now, EURUSD has completed several reversal candlestick patterns, such as Shooting Star, close to the resistance level. Right now, the pair is reversing. We may assume that later the price may complete the correction and move to reach 1.1125. However, one shouldn’t exclude a possibility that the price may form a more significant pullback towards 1.1045.

EURUSD
Risk Warning: the result of previous trading operations do not guarantee the same results in the future

USDJPY, “US Dollar vs. Japanese Yen”

As we can see in the H4 chart, USDJPY is no longer moving inside the rising channel. By now, the pair is testing the support level, where it has formed several reversal patterns, including Hammer. The current situation implies that the price may reverse and then grow to reach 109.61. At the same time, the pair may choose another scenario, according to which the instrument is expected to continue falling towards 106.55 after a slight correction.

USDJPY
Risk Warning: the result of previous trading operations do not guarantee the same results in the future

EURGBP, “Euro vs. Great Britain Pound”

As we can see in the H4 chart, after testing the resistance level and forming several reversal patterns, such as Shooting Star, EURGBP has almost reversed. Right now, we may assume that after reversing the price may continue growing towards 0.8800. However, one shouldn’t exclude an opposite scenario, which implies that the instrument may fall with the target at 0.8555.

EURGBP

Article By RoboForex.com

Attention!
Forecasts presented in this section only reflect the author’s private opinion and should not be considered as guidance for trading. RoboForex LP bears no responsibility for trading results based on trading recommendations described in these analytical reviews.

Ichimoku Cloud Analysis 04.03.2020 (EURUSD, USDCAD, USDRUB)

Article By RoboForex.com

EURUSD, “Euro vs US Dollar”

EURUSD is trading at 1.1134; the instrument is moving above Ichimoku Cloud, thus indicating an ascending tendency. The markets could indicate that the price may test the cloud’s upside border at 1.1095 and then resume moving upwards to reach 1.1350. Another signal to confirm further ascending movement is the price’s rebounding from the descending channel’s upside border. However, the scenario that implies further growth may be canceled if the price breaks the cloud’s downside border and fixes below 1.0965. In this case, the pair may continue falling towards 1.0845.

EURUSD
Risk Warning: the result of previous trading operations do not guarantee the same results in the future

USDCAD, “US Dollar vs Canadian Dollar”

USDCAD is trading at 1.3391; the instrument is moving above Ichimoku Cloud, thus indicating an ascending tendency. The markets could indicate that the price may test the cloud’s upside border at 1.3370 and then resume moving upwards to reach 1.3525. Another signal to confirm further ascending movement is the price’s rebounding from the rising channel’s downside border. However, the scenario that implies further growth may be canceled if the price breaks the cloud’s downside border and fixes below 1.3305. In this case, the pair may continue falling towards 1.3185.

USDCAD
Risk Warning: the result of previous trading operations do not guarantee the same results in the future

USDRUB, “US Dollar vs Russian Ruble”

USDRUB is trading at 65.93; the instrument is moving above Ichimoku Cloud, thus indicating an ascending tendency. The markets could indicate that the price may test the cloud’s upside border at 65.40 and then resume moving upwards to reach 68.85. Another signal to confirm further ascending movement is the price’s rebounding from the descending channel’s upside border. However, the scenario that implies further growth may be canceled if the price breaks the cloud’s downside border and fixes below 64.05. In this case, the pair may continue falling towards 62.75.

USDRUB

Article By RoboForex.com

Attention!
Forecasts presented in this section only reflect the author’s private opinion and should not be considered as guidance for trading. RoboForex LP bears no responsibility for trading results based on trading recommendations described in these analytical reviews.

The Analytical Overview of the Main Currency Pairs on 2020.03.05

by JustForex

The EUR/USD currency pair

Technical indicators of the currency pair:
  • Prev Open: 1.11711
  • Open: 1.11346
  • % chg. over the last day: -0.31
  • Day’s range: 1.11305 – 1.11426
  • 52 wk range: 1.0879 – 1.1572

The EUR/USD currency pair has stabilized after a long rally. At the moment the trading instrument is consolidating. EUR/USD quotes are testing key support and resistance levels at 1.11100 and 1.11850, respectively. Investors continue to assess the risks of COVID-19 virus spreading. The U.S. House of Representatives plans to allocate $8.3 bln to fight the epidemic. The greenback is under pressure from the prospects of further easing the Fed’s monetary policy. Futures indicate a 50% probability that the Central Bank will cut interest rates by another 50 basis points by July. We recommend opening positions from key levels.

The Economic News Feed for 05.03.2020:

  • – Initial Jobless Claims (US) – 15:30 (GMT+2:00);
  • – Volume of Industrial Orders (US) – 17:00 (GMT+2:00);
EUR/USD

Indicators do not give accurate signals: the price has fixed between 50 MA and 100 MA.

MACD histogram is near the 0 mark.

The Stochastic Oscillator is located in the neutral zone, the %K line is below the %D line, which indicates a correction of the EUR/USD currency pair.

Trading recommendations
  • Support levels: 1.11100, 1.10500, 1.10000
  • Resistance levels: 1.11850, 1.12200, 1.12500

If the price fixes above 1.11850, expect further growth toward 1.12200-1.12500.

Alternatively, the quotes could decline toward 1.10600-1.10400.

The GBP/USD currency pair

Technical indicators of the currency pair:
  • Prev Open: 1.28117
  • Open: 1.28697
  • % chg. over the last day: +0.46
  • Day’s range: 1.28607 – 1.28892
  • 52 wk range: 1.1959 – 1.3516

GBP/USD quotes have moved up. The pound has updated the local highs. At the moment GBP/USD currency pair is consolidating near the round level of 1.29000. 1.28400 is already a mirror support. The demand for the US dollar remains at a rather low level. GBP has a potential for further growth against greenback. We recommend opening positions from key levels.

The Economic News Feed for 05.03.2020 is calm.

GBP/USD

The indicators signal the strength of buyers: the price has fixed above 50 MA and 100 MA.

MACD histogram is in the positive zone, which indicates a bullish sentiment.

The stochastic oscillator is in the neutral zone, the %K line crosses the %D line. No signals at the moment.

Trading recommendations
  • Support levels: 1.28400, 1.27850, 1.27400
  • Resistance levels: 1.29000, 1.29450

If the price fixes above the round level of 1.29000, expect the quotes to grow toward 1.29400-1.29600.

Alternatively, the quotes could descend toward 1.27900-1.27700.

The USD/CAD currency pair

Technical indicators of the currency pair:
  • Prev Open: 1.33829
  • Open: 1.33864
  • % chg. over the last day: +0.02
  • Day’s range: 1.33846 – 1.34021
  • 52 wk range: 1.2949 – 1.3566

Yesterday, the USD/CAD currency pair showed high trading activity. The Bank of Canada reduced the key interest rate by 50 basis points to 1.25%. This decision was taken by the Board of Governors of the Central Bank in connection with the coronavirus COVID-19 outbreak, which had a significant negative impact on the growth prospects of both the Canadian and global economy. Currently, the CAD is consolidating in the range of 1.33800-1.34300. We recommend paying attention to the dynamics of oil quotations and opening positions from key levels.

The Economic News Feed for 05.03.2020 is calm.

USD/CAD

Indicators do not give an accurate signal: 50 MA crossed 100 MA.

The MACD histogram is in the positive zone, but below the signal line, which gives a weak signal to buy USD/CAD.

The Stochastic Oscillator is in the neutral zone, the %K line is below the %D line, which indicates a bearish sentiment.

Trading recommendations
  • Support levels: 1.33800, 1.33200, 1.32650
  • Resistance levels: 1.34300, 1.34600

If the price fixes above 1.34300, expect the quotes to rise toward 1.34600-1.35000.

Alternatively, the quotes could descend toward 1.33300-1.33000.

The USD/JPY currency pair

Technical indicators of the currency pair:
  • Prev Open: 107.120
  • Open: 107.529
  • % chg. over the last day: +0.54
  • Day’s range: 107.190 – 107.740
  • 52 wk range: 104.45 – 113.53

The USD/JPY has stabilized after a long slump. At the moment the quotes are consolidating. The trading instrument tests the following support and resistance levels 107.000 and 107.800, respectively. Demand for safe haven currencies remains at a high level. However, technical correction of USD/JPY currency pair is not excluded in the nearest future. We recommend paying attention to the dynamics of US government bonds yield and opening from key levels.

The Economic News Feed for 05.03.2020 is calm.

USD/JPY

Indicators do not give accurate signals: the price is consolidating near 50 MA.

MACD histogram is near the 0 mark.

The Stochastic Oscillator is located in the neutral zone, the %K line is above the %D line, which indicates a correction of the USD/JPY currency pair.

Trading recommendations
  • Support levels: 107.000
  • Resistance levels: 107.800, 108.550, 109.300

If the price fixes below the round level of 107.000, expect the quotes to fall toward 106.600-106.300.

Alternatively, the quotes could correct toward 108.500-109.000.

by JustForex

EURUSD: key support level found at 135th degree

By Alpari.com

On Wednesday, March 4, trading on the euro ended in decline. The pair corrected during the day after setting a new high as a result of the US Federal Reserve’s decision to reduce rates by 50 bp. The impetus for the selling of the euro was provided by the strengthening of the dollar off the back of the release of promising economic data.

The index of business activity in the service sector in the United States was above the forecast and hit a new high for the year. The ISM index in February rose to 57.3. Employment in the US private sector grew by 183,000, which was substantially more than the forecast of 170,000. The indicator for January was revised downwards by 82,000. Since the US Fed has already cut interest rates, employment data has become uninteresting to speculators.

Major US stock indexes rose from 3.7% to 4.5%, this was all as a result of the news concerning former Vice President Biden and his campaign to become the preferred presidential candidate for the Democratic Party in the United States.

Today’s events (GMT+3):

  • 16:30 USA: Nonfarm Productivity (Q4), Initial Jobless Claims (Feb 28), Unit Labor Costs (Q4).
  • 18:00 USA: Factory Orders (MoM) (Jan).
  • 20:00 UK: BoE’s Governor Carney speech
  • 20:45 Canada: BoC’s Governor Poloz speech

0503Current situation:

Expectations regarding a weakening of the euro came true. The price fell below the balance line (Lb) and the level of 1.1120 (lower line of the channel). In Asian trading, the euro is under pressure against other currencies. Even though the stochastics show the price is in the “buy zone”, we are still daring to consider the continuation of correctional movement to the 135th degree – 1.1053. From here it will already be possible to look out for signals to buy the euro.

There are no European stats coming out today. The scheduled Carney and Poloz speeches are happening later on in the evening, the information they announce will be interesting to market players. Following the Fed, the Bank of Canada lowered its basic interest rate by 0.50% to 1.25%.

By Alpari.com

US Fed Panics – Predictive Modeling Shows You What’s Next

By TheTechnicalTraders – March 3, 2020: the US Fed issued an emergency rate cut of 0.50% to move rates to levels near 1.0% as a result of global economic concerns related to the spread of the Coronavirus and the potential damage it may do to the global major economies.  President Trump had been suggesting the US Fed needed to be ahead of the risks associated with future market expectations to allow for increased liquidity and global economic function.  Yet, we believe this move by the US Fed came at the wrong time for most investors and traders.

The global markets had already begun a process of revaluing risk in the markets near the end of February 2020.  After the Q1 earnings data was digested and the newest Chinese data became available, investors suddenly understood the risks that we had been warning about for most of January and February.  Suddenly, the US markets collapsed and traders were revaluing forward expectations.

Now that the US Fed has engaged in a 0.50% rate cut, the real risk solidifies in investor minds as “hey, the Fed is acting in a manner to ease money supply in preparation for a broad global slowdown”.  What does this mean for skilled traders?  We’ll explore the future price action using our Adaptive Dynamic Learning modeling system.

DOW JONES Weekly Chart

This INDU Weekly chart showing the ADL predictive modeling system results suggests the INDU will likely rotate near current lows (near 27,000) with very high volatility.  Current volatility ranges on the INDU suggest the US markets could rotate 1000 points a day very easily over the next few weeks.  Near early April, our ADL modeling system is suggesting the INDU will attempt to rally back to near 29,500 setting up a potential Double-Top formation.  Our earlier research suggests the INDU/YM will likely form a bottom well before the S&P and NASDAQ – so this aligns with our earlier research.

Once the Double-Top sets up – all bets are off as risk will be extremely high for another breakdown event.  We believe a true bottom will form/setup sometime between May and June 2020.  Therefore, any recovery in the INDU to levels near 29,500 before the end of April would strongly suggest the markets are setting up for a Q1 earnings collapse – and a potential for a much deeper price low to set up as a real bottom.

Nasdaq Weekly Chart

This NQ Weekly Chart highlights a shorter-term ADL projected price outcome.  The reason we went further back in time to produce these results is because these ADL results aligned with price quite efficiently and also illustrated the perceived weakness in price throughout the end of 2019.  Notice the CYAN DASH lines below the price in December 2019 – these are the ADL predictive price levels for that span of time.  Near the early January 2020 price bars, the ADL predictive modeling system identified price levels that almost mirrored the NQ price activity.  Currently, the ADL system is predicting the NQ will find temporary support near 9000 for a few weeks before breaking lower to levels near 8000~8200.

This price move, which is opposite that of the INDU, suggests the tech-heavy NASDAQ may continue to experience price pressure with a potential for a downside “waterfall” price event setting up.

Transportation Weekly Chart

Lastly, this TRAN (Transportation Index) Weekly chart highlights was we believe to be a more true valuation event setting up over the next 60 to 90+ days.  This ADL chart suggests the TRAN price will almost immediately move back to levels near 11,000 (with a potential for a new high print above 11,300), then consolidate near 10,800 before breaking lower in late April or early May.  This type of price action aligns with the Q1 results reflecting an economic contraction while optimistic investors attempt to push price levels back towards recent highs before the reality sets into the markets.  The real forward expectations of Q2-2020 and Q3-2020 may be a fraction of levels reported for Q4-2019.

The US Fed is attempting to front-load the global markets with easier monetary policy to allow for unknown risks that may span 6 months out or longer.  Our researchers believe the US stock market will set up a major bottom sometime between May and June 2020 (possibly a bit later) and from that point we expect the US markets to begin to move gradually higher.  We believe this move will be similar to the downside price collapse that happened in January 2018 when the markets formed a clear Double-Bottom and began to move higher after May 2018 – eventually peaking above all-time highs.

Although the Fed fired an emergency rate cut of -0.50%, the reality is that investors may see this as a “miss” in terms of hitting a target.  Yes, it eases capital flows and sets investor expectations to believe the US Fed is prepared for this risk – but it also diminishes the potential for the US Fed to take decisive action in Q2 or Q3 of 2020 if the markets collapse as we expect.

As we’ve been saying for many months, 2020 is sure to be an incredible year for skilled traders.  Pay attention to our research to prepare for the biggest moves in the markets.

As a technical analysis and trader since 1997, I have been through a few bull/bear market cycles. I believe I have a good pulse on the market and timing key turning points for both short-term swing trading and long-term investment capital. The opportunities are massive/life-changing if handled properly.

I urge you visit my ETF Wealth Building Newsletter and if you like what I offer, join me with the 1-year subscription to lock in the lowest rate possible and ride my coattails as I navigate these financial market and build wealth while others lose nearly everything they own during the next financial crisis. Join Now and Get a Free 1oz Silver Bar!

Chris Vermeulen

TheTechnicalTraders.com


Forex Technical Analysis & Forecast 04.03.2020

Article By RoboForex.com

EURUSD, “Euro vs US Dollar”

After finishing the descending impulse along with the correction, EURUSD is consolidating around 1.1153. the main scenario implies that the price may form the second descending impulse to break 1.1140 and then trading downwards with the short-term target at 1.1094.

EURUSD
Risk Warning: the result of previous trading operations do not guarantee the same results in the future

GBPUSD, “Great Britain Pound vs US Dollar”

GBPUSD continues forming the second ascending impulse with the target at 1.2871. After that, the instrument may start a new correction to reach 1.2805 and then resume moving upwards with the target at 1.2902.

GBPUSD
Risk Warning: the result of previous trading operations do not guarantee the same results in the future

USDCHF, “US Dollar vs Swiss Franc”

USDCHF is consolidating around 0.9561; it has already finished the ascending impulse at 0.9585 along with the correction towards 0.9549. The main scenario implies that the pair may start another ascending impulse with the short-term target at 0.9622.

USDCHF
Risk Warning: the result of previous trading operations do not guarantee the same results in the future

USDJPY, “US Dollar vs Japanese Yen”

USDJPY has expanded its consolidation range down to 106.94; right now. it is moving upwards to reach 107.68. Later, the market may start another decline towards 106.76 and then form one more ascending structure with the target at 108.90.

USDJPY
Risk Warning: the result of previous trading operations do not guarantee the same results in the future

AUDUSD, “Australian Dollar vs US Dollar”

After finishing the ascending wave at 0.6640, AUDUSD is expected to correct towards 0.6520. After that, the instrument may form the second wave to the upside with the target at 0.6713.

AUDUSD
Risk Warning: the result of previous trading operations do not guarantee the same results in the future

USDRUB, “US Dollar vs Russian Ruble”

After finishing another descending structure towards 65.66, USDRUB is expected to start a new correction to reach 66.50. After that, the instrument may resume its decline with the target at 65.30.

USDRUB
Risk Warning: the result of previous trading operations do not guarantee the same results in the future

USDCAD, “US Dollar vs Canadian Dollar”

USDCAD is forming a wide consolidation range around 1.3347. Today, the pair may form another descending impulse towards 1.3323. Later, the market may start a new growth with the target at 1.3385 and then resume trading downwards to reach 1.3300.

USDCAD
Risk Warning: the result of previous trading operations do not guarantee the same results in the future

XAUUSD, “Gold vs US Dollar”

After completing the correction at 1650.90, Gold is consolidating around 1641.65. According to the main scenario, the instrument is expected to break the range downwards to reach 1602.08. Later, the market may break this level as well and continue trading downwards with the target at 1550.00.

GOLD
Risk Warning: the result of previous trading operations do not guarantee the same results in the future

BRENT

After finishing the second ascending impulse at 54.20, Brent has almost completed the correction towards 54.60. Today, the pair may start another growth with the target at 55.05 and then form a new descending structure towards 52.20.

BRENT
Risk Warning: the result of previous trading operations do not guarantee the same results in the future

BTCUSD, “Bitcoin vs US Dollar”

BTCUSD has completed the correction at 8660.00. Possibly, today the pair may grow towards 9200.00 and then start a new correction to reach 8900.00. Later, the market may form one more ascending structure with the first target at 9400.00.

BRENT

Article By RoboForex.com

Attention!
Forecasts presented in this section only reflect the author’s private opinion and should not be considered as guidance for trading. RoboForex LP bears no responsibility for trading results based on trading recommendations described in these analytical reviews.

Fibonacci Retracements Analysis 04.03.2020 (GBPUSD, EURJPY)

Article By RoboForex.com

GBPUSD, “Great Britain Pound vs US Dollar”

As we can see in the H4 chart, after breaking 50.0% fibo, the descending tendency has stopped at 61.8% fibo (1.2700). The convergence on MACD indicates a possible reversal, but in order to confirm it, the pair has to break the resistance at 1.3009. In case the price continues falling, the instrument may reach the closest target at 61.8% fibo (1.2700) and then 76.0% fibo at 1.2512.

GBPUSD_H4
Risk Warning: the result of previous trading operations do not guarantee the same results in the future

In the H1 chart, the convergence made the pair start a new rising pullback after the downtrend, which may reach 23.6%, 38.2%, and 50.0% fibo at 1.2912, 1.3026, and 1.3120 respectively. If the price breaks the support (the low at 1.2725), the mid-term descending tendency will continue.

GBPUSD_H1
Risk Warning: the result of previous trading operations do not guarantee the same results in the future

EURJPY, “Euro vs. Japanese Yen”

As we can see in the H4 chart, after the pair had corrected to the upside by 61.8%, there was a quick descending impulse that tested the local low at 118.46. If the price breaks the low and fixes below it, the downtrend may continue to reach 76.0% at 117.55 and then the low at 115.86. However, if the price rebounds, it may mean that the instrument can’t decide what to do and where to go next. If, after rebounding from the low, the pair breaks the previous fractal at 121.40, it may grow to break the high at 122.87 and then continue moving upwards to reach the post-correctional extension area between 138.2% and 161.8% fibo at 124.55 and 125.57 respectively.

EURJPY_H4
Risk Warning: the result of previous trading operations do not guarantee the same results in the future

In the H1 chart, the pair is stuck between 118.46 and 121.40, which are support and resistance respectively.

EURJPY_H1

Article By RoboForex.com

Attention!
Forecasts presented in this section only reflect the author’s private opinion and should not be considered as guidance for trading. RoboForex LP bears no responsibility for trading results based on trading recommendations described in these analytical reviews.

Fed Has Urgently Cut the Key Interest Rate

by JustForex

The US dollar continues to lose ground against a basket of major currencies. The dollar index (#DX) closed yesterday in the red zone (-0.20%). The US Federal Reserve unexpectedly lowered its key interest rate by 50 basis points to 1.00%-1.25% two weeks before the planned monetary policy meeting. The head of the Central Bank Powell said that the US economy remained stable, but the COVID-19 virus had brought new risks and problems. The Hong Kong Monetary Authority (HKMA) on Wednesday also cut its key rate by 50 basis points to 1.5% after the Fed. Today, investors are also waiting for the interest rate decision by the Bank of Canada. According to forecasts, the key rate will remain unchanged at 1.75%.

Also, investors remain focused on the coronavirus. The World Health Organization (WHO) said on Tuesday that coronavirus is not transmitted as efficiently as the flu, but its mortality rate is higher by 3.4%. Meanwhile, South Korean authorities intend to allocate almost $10 billion to fight the coronavirus epidemic, as well as to support businesses and citizens.

The “black gold” prices jumped after mining restrictions. Currently, the WTI crude oil futures are testing the $47.65 per barrel mark. At 17:30 (GMT+2:00), crude oil inventories will be published in the US.

Market indicators

Aggressive sales were observed yesterday in the US stock market: #SPY (-2.86%), #DIA (-2.89%), #QQQ (-3.21%).

10-year US government bonds yield fell sharply again. At the moment, the indicator is at the level of 0.98-0.99%.

The news feed on 2020.03.04:
  • – Data on business activity in the UK at 11:30 (GMT+2:00);
  • – Change in the number of people employed in the non-farm sector from ADP in the USA at 15:15 (GMT+2:00);
  • – US ISM Non-Manufacturing PMI at 17:00 (GMT+2:00);
  • – Bank of Canada interest rate decision at 17:00 (GMT+2:00);
  • – The Fed’s Beige Book at 21:00 (GMT+2:00).

by JustForex