Author Archive for InvestMacro – Page 81

DAX30 in nose-dive mode, 10,600 points in focus

By Admiral Markets

Economic Events March 6

Source: Economic Events March 6, 2020 – Admiral Markets’ Forex Calendar

While the economic calendar is quite thin this week, the strong risk aversion leading up to last week’s close should keep volatility elevated in the German DAX index.

What seems particularly alarming is the very weak reaction to the Fed emergency rate cut last Tuesday.

Last Tuesday morning, an emergency G7 phone call, led by US Treasury Secretary Mnuchin and Fed Chair Powell, didn’t result in any plans of coordinated action by the G7, in regards to fiscal stimulus or a coordinated rate cut by central banks. There was only some vague rhetoric that they are to carefully watch upcoming developments in the Coronavirus and its impact on the global economy. Meanwhile, the Fed, several hours later, cut rates by 50 basis points.

But Equity markets (and thus the DAX) only saw a short term upward squeeze, which sold off sharply as 10-year US Treasury yields dropped significantly below 1.00% over the last days.

In fact, market participants now expect the Fed to cut rates by another 50 basis points at their meeting next Wednesday, and the ECB is also expected to be extremely dovish next Thursday by cutting rates by a minimum of 10 basis points into negative territory.

But with Equities failing to gain bullish momentum in regards to liquidity, the advantage stays clearly on the downside, with the focus in the DAX30 CFD on the region around 10,600 points.

On the upside, only recapturing 12,200/230 points would, at least in the short-term, brighten the technical picture:

DAX30 CFD Hourly chart

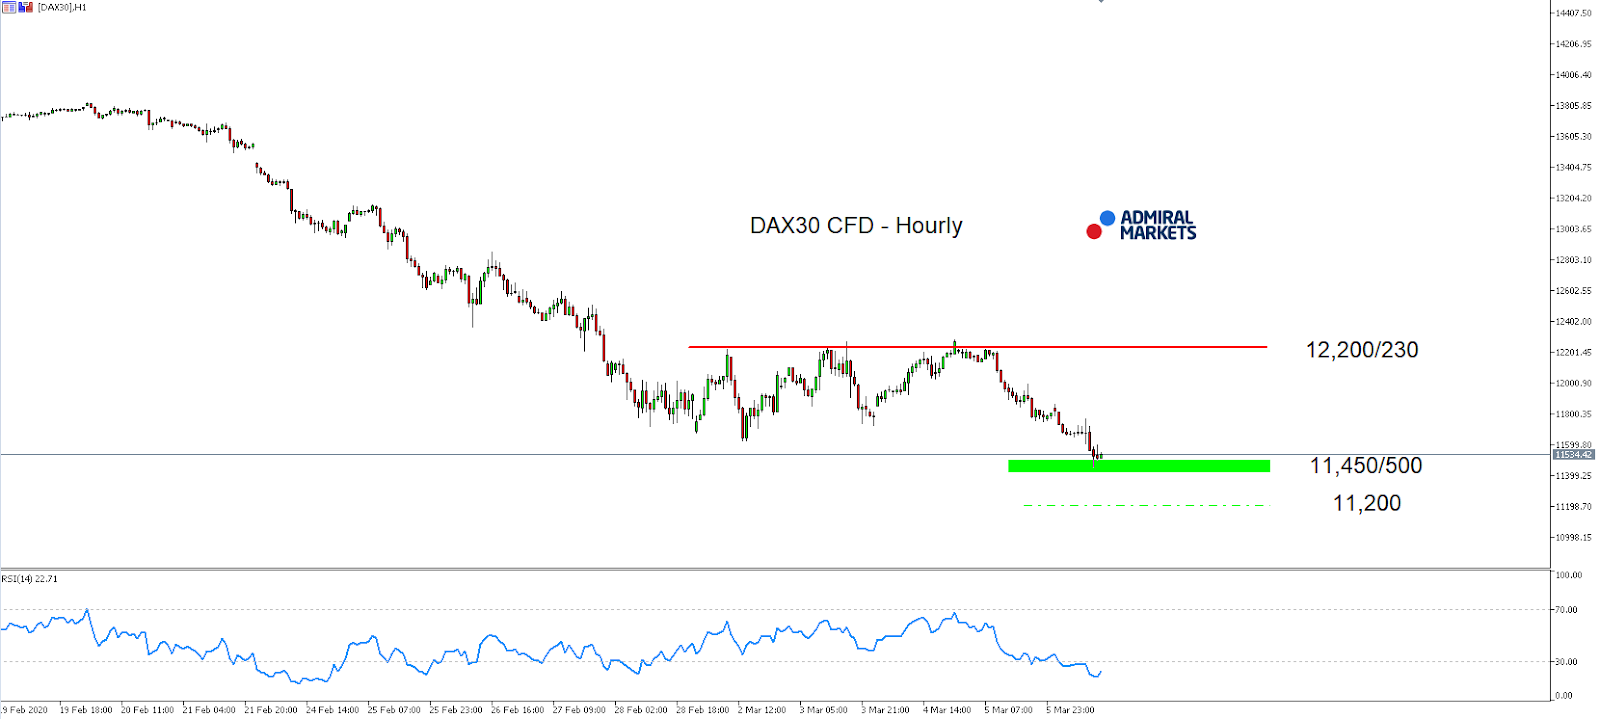
Source: Admiral Markets MT5 with MT5-SE Add-on DAX30 CFD Hourly chart (between February 19, 2020, to March 6, 2020). Accessed: March 6, 2020, at 10:00pm GMT

DAX30 CFD Daily chart

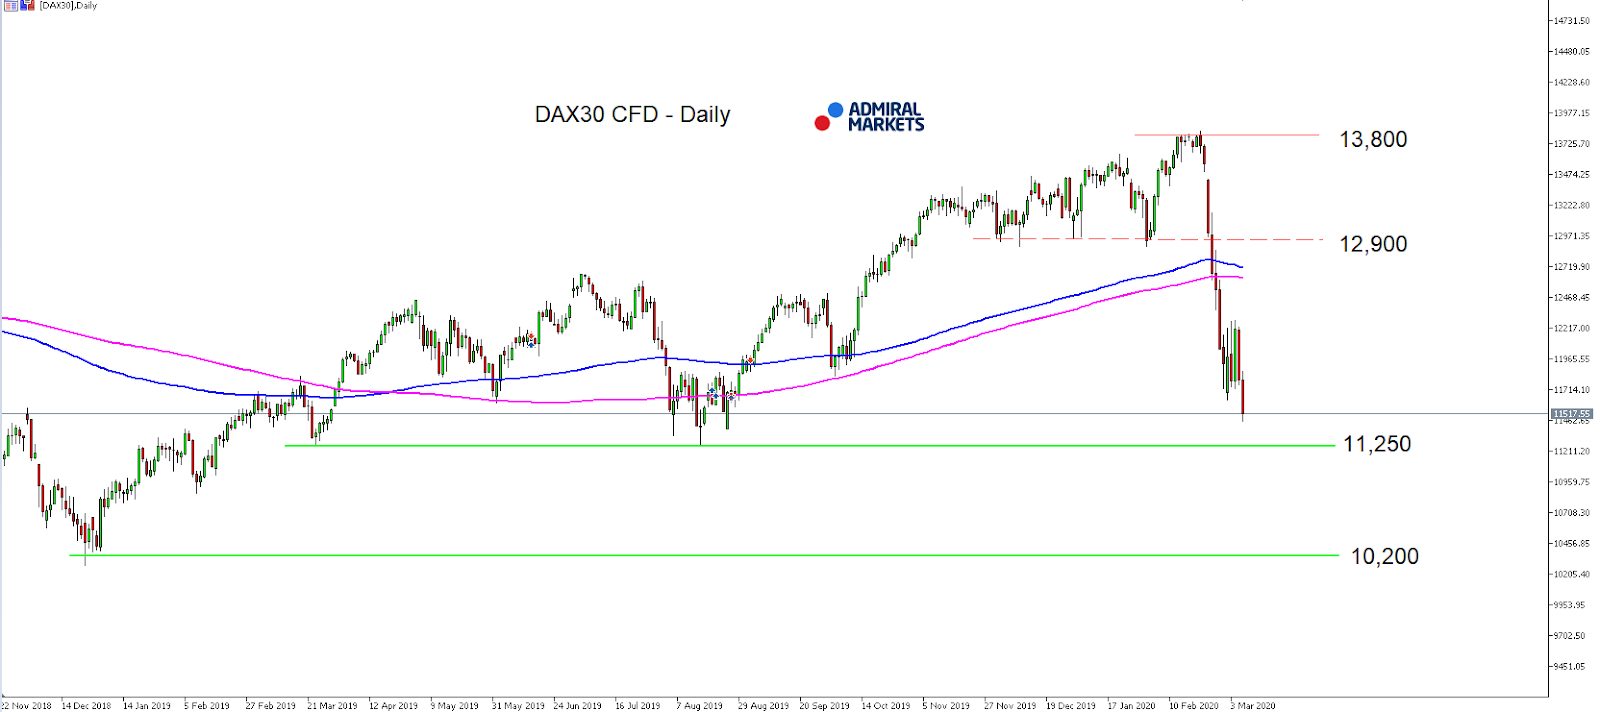
Source: Admiral Markets MT5 with MT5-SE Add-on DAX30 CFD Daily chart (between November 22, 2018, to March 6, 2020). Accessed: March 6, 2020, at 10:00pm GMT – Please note: Past performance is not a reliable indicator of future results, or future performance.

In 2015, the value of the DAX30 CFD increased by 9.56%, in 2016, it increased by 6.87%, in 2017, it increased by 12.51%, in 2018, it fell by 18.26%, in 2019, it increased by 26.44% meaning that after five years, it was up by 34.2%.

Discover the world’s #1 multi-asset platform

Admiral Markets offers professional traders the ability to trade with a custom, upgraded version of MetaTrader 5, allowing you to experience trading at a significantly higher, more rewarding level. Experience benefits such as the addition of the Market Heat Map, so you can compare various currency pairs to see which ones might be lucrative investments, access real-time trading data, and so much more. Click the banner below to start your FREE download of MT5 Supreme Edition!

Trade With MetaTrader 5

Disclaimer: The given data provides additional information regarding all analysis, estimates, prognosis, forecasts or other similar assessments or information (hereinafter “Analysis”) published on the website of Admiral Markets. Before making any investment decisions please pay close attention to the following:

  1. This is a marketing communication. The analysis is published for informative purposes only and are in no way to be construed as investment advice or recommendation. It has not been prepared in accordance with legal requirements designed to promote the independence of investment research, and that it is not subject to any prohibition on dealing ahead of the dissemination of investment research.
  2. Any investment decision is made by each client alone whereas Admiral Markets shall not be responsible for any loss or damage arising from any such decision, whether or not based on the Analysis.
  3. Each of the Analysis is prepared by an independent analyst (Jens Klatt, Professional Trader and Analyst, hereinafter “Author”) based on the Author’s personal estimations.
  4. To ensure that the interests of the clients would be protected and objectivity of the Analysis would not be damaged Admiral Markets has established relevant internal procedures for prevention and management of conflicts of interest.
  5. Whilst every reasonable effort is taken to ensure that all sources of the Analysis are reliable and that all information is presented, as much as possible, in an understandable, timely, precise and complete manner, Admiral Markets does not guarantee the accuracy or completeness of any information contained within the Analysis. The presented figures refer that refer to any past performance is not a reliable indicator of future results.
  6. The contents of the Analysis should not be construed as an express or implied promise, guarantee or implication by Admiral Markets that the client shall profit from the strategies therein or that losses in connection therewith may or shall be limited.
  7. Any kind of previous or modeled performance of financial instruments indicated within the Publication should not be construed as an express or implied promise, guarantee or implication by Admiral Markets for any future performance. The value of the financial instrument may both increase and decrease and the preservation of the asset value is not guaranteed.
  8. The projections included in the Analysis may be subject to additional fees, taxes or other charges, depending on the subject of the Publication. The price list applicable to the services provided by Admiral Markets is publicly available from the website of Admiral Markets.
  9. Leveraged products (including contracts for difference) are speculative in nature and may result in losses or profit. Before you start trading, you should make sure that you understand all the risks.

By Admiral Markets

Fear Reaches A Level Seen Only 4 Times Since 2008 – Signature Pattern

By TheTechnicalTraders – Since 2009 the stock market has had for major waves of investor fear (volatility) take place which was in 2010, 2011, 2015, and 2018. Each time the market corrected we saw a drop anywhere from 12% – 18% and both traders and investors became emotional and started selling assets in fear of lower prices. What we are experiencing right now is the same sort of setup once again.

These waves of panic selling are a signature pattern of a mini-crash and they have similar outcomes each time which I will share with you here so you know what to expect and how to trade this rare market condition.

It takes a lot to convince the masses to reach this level of fear. Each of these mini-market crashes there has been some catalysts to further induce fear/selling. This time its Covid-19 that is tipping the scales.

Only two assets have acted as a safe haven which is bonds, and gold. Once again everyone has been piling into these over the past week, and even more so on Friday with Bonds surging 6.5% at one point during the session.

What does it mean when everyone is buying bonds and gold like this?

Where should you put your money to work going forward?
If you are thinking of buying bonds or gold you may want to think again.

Take a look at the charts for gold and bonds below when fear and the volatility index (VIX) have reached the level we experienced last week.

Weekly Chart of Gold, and the VIX Performance

The chart below is straight forward. The bottom yellow section is the level of fear (VIX), while the top candlestick chart is the price of gold.

This chart shows what happens to the price of gold when everyone becomes fearful. Gold tends to rally as fear rises and the VIX spikes. But once the VIX has spiked the price of gold will trade sideways for many weeks and eventually have a deeper correction.

While gold could see more fear-based buying in the next week or two I feel most of the upside potential has always been realized and your money will be stuck in an underperforming asset when it could be deployed elsewhere in the market.

Weekly Chart of Bonds (TLT), and the VIX Performance

The below chart of bonds is a little different in how it reacts to extreme broad-based fear. Bonds tend to trade sideways or higher for a few several weeks and this is because bonds are really the core safe-haven play amount investors and financial advisors.

When extreme fear hits the market and spooks the masses it can take weeks for all those buy and hold investors recognize the market weakness and take action selling their stocks and moving their money into bonds. This buying pressure on bonds is a slow trickle-in effect as advisors have clients call them and demand they put their money into a low-risk investment like bonds.

Bonds do have another interesting twist for last week’s particular price action. Only three times since 2008 have I seen bonds move 20% in value within a short period of time which is what they reached last week. Within  1-3 weeks from a 20%+ gain, the price of bonds has corrected on average 11.5%.

Concluding Thoughts:

In short, my 23 years of technical analysis experience in reading charts, and statistical analysis is telling me we should be looking at different asset classes to trade over the next couple of months.

On Friday at the opening bell subscribers and I closed our TLT bond trade for a 20.07% gain. During that time the stock market crashed 14.5% which we avoided because of our technical analysis which closed our long SP500 position before the big drop.

As a technical analysis and trader since 1997, I have been through a few bull/bear market cycles. I believe I have a good pulse on the market and timing key turning points for short-term swing traders.

Visit my ETF Wealth Building Newsletter and if you like what I offer, and ride my coattails as I navigate these financial markets and build wealth while others lose nearly everything they own during the next financial crisis.

Chris Vermeulen

TheTechnicalTraders.com


Have We Seen The Peak In The VIX?

By TheTechnicalTraders.com

The recent price breakdown in the US stock market (near the end of February 2020) prompted a very big spike in the VIX – could we see another HUGE spike with a deeper price selloff in the near future?

Our researchers believe this first downside price rotation in the US stock market may be just the first downside move in what may become a “waterfall” price event where price declines in a series of downside price waves reaching an ultimate support level.  The way the VIX works is to attempt to normalize implied volatility based on available options call and put data over a 30-day span.  The process of normalizing this data attempt to eradicate outlier data from the equation.  Thus, a VIX level of 40 has likely resulted in completed data that attempts to eliminate outlier data points that may have resulted in a much higher VIX value.

After this recent rally in the VIX level, the current normalization process will likely take the current range of the VIX (options data) into consideration for future VIX levels.  Thus, in order for the VIX to reach levels above 40 again, a much bigger downside price move would have to take place – possibly pushing the SPY to levels near $260 or lower.  A move like this would have to happen in an aggressive type of price decline in order for the VIX to rally back above 40.  Is this something we should expect in the near future?

Options Traders Be Aware: In our next post, we will touch one why trading options in this type of market condition is a major NO-NO.

Be sure to opt-in to our free market trend signals newsletter before closing this page so you don’t miss our next special report!

Our researchers believe the likelihood of a price decline like this is greater than 60% at this time.  We believe a Waterfall type of price event is unfolding where the price will attempt to source out true support levels as global central banks position ahead of any economic fallout for Q1 and Q2 of 2020.  It is because of these expectations that we believe global traders and investors will suddenly pull capital away from risk, into CASH and safe-havens while the unknowns of the global economic situation play out.  This dramatic shift from just 30 days ago may push the VIX to levels above 50 or 60 if we experience another aggressive selloff.

Liquidity becomes a major problem as Algos begin to pull capital out of the markets – like the FLASH CRASH of years ago.  This type of activity is already happening as many of our Algos and those of some of our friends have already started identifying severe risk factors in the markets as ATR and VIX have skyrocketed.  This lack of liquidity in the global markets could prompt an extended FLASH CRASH type of price event over the next 30 to 60+ days – possibly multiple FLASH events.

Daily VIX Chart

This Daily VIX chart highlights the scale of the second Waterfall price event that recently took place.  The first Waterfall price move took place in early February and was very minor – yet our researchers caught it.

Weekly VIX Chart

This Weekly VIX chart highlights what we believe to be a likely scenario where VIX normalizes to levels below 25 over the next 2~3 weeks before another downside Waterfall event takes place as Q1 earnings data is about to hit the markets (near the end of March or early April).  It makes perfect sense to us that revisions and announcements will begin to hit the news wires relating to missed earnings and profit expectations near the end of March 2020.  If the Coronavirus is still working its way through Europe, the Middle East, and North America, we could be set up for a shocking April 2020 as Q1 earnings are announced.  This is what we believe will send the VIX skyrocketing to levels above 45~50 potentially.

A 25 to 35 day period of relative calm (2~3+ weeks) before earnings data starts to funnel into the news cycle.  Come early April, if companies have not yet already adjusted guidance, we could be in for a series of surprises that shock the US stock market and send the VIX skyrocketing.

Smart Cash Index Show Global Equity Trend

Our Smart Cash Index has recently broken below historical support channels and may begin to move into a new downward price channel soon.  This would be the first time in over 8+ years that this lower price channel has been seriously threatened in this manner.  A new downward price channel setup could indicate some extended downside price moves are in our future.  These types of downside price moves could indicate a broader global move away from risk as trader attempt to move capital into the safety of CASH and other investments.

Concluding Thoughts:

As we’ve been warning for many months, 2020 is sure to be a very exciting year for skilled traders.  Don’t miss any of these incredible opportunities for broad sector swings and bigger moves in the US and Global stock markets.  These are the types of price swings that can make fortunes for skilled traders who are ahead of the bigger moves.

In fact, on Friday while traders and investors were down 15% with equities subscribers and I locked in 20.07% profit on our TLT trade and we avoided the equities collapse all together using my proven technical analysis strategies.

As a technical analysis and trader since 1997, I have been through a few bull/bear market cycles. I believe I have a good pulse on the market and timing key turning points for both short-term swing trading and long-term investment capital. The opportunities are massive/life-changing if handled properly.

I urge you visit my ETF Wealth Building Newsletter and if you like what I offer, join me with the 1-year subscription to lock in the lowest rate possible and ride my coattails as I navigate these financial market and build wealth while others lose nearly everything they own during the next financial crisis. Join Now and Get a Free 1oz Silver Bar!

Chris Vermeulen

TheTechnicalTraders.com


Gold and Silver Rally Back After Fed Emergency Rate Cut

By TheTechnicalTradersOver the past few weeks and months, our research team has continued to sing the praises of precious metals – particularly Gold and Silver.  After last week’s dramatic selloff in precious metals (attributed mostly to margin call sales), both Gold and Silver rallied almost 3% on Tuesday, March 3 – the day the US Fed issued an emergency 0.50% rate cut.

We believe this move by the US Fed solidified a fear in the global markets that the central banks are preparing for a much broader economic contraction and attempting to front-run weakness by moving price rates lower.  This will help to ease capital restrictions, liquidity across global markets and spur some global borrowing at a time when the Coronavirus may continue to weigh on global economies.  Still, for skilled metals traders, this is likely the rocket fuel we need to see Gold rally above $1800 very quickly and for Silver to rally above $21 quickly as well.

This Weekly Gold chart highlights the early recovery that took place on Tuesday, March 3, 2020.  Gold actually closed at $1641.6 for the day – up 2.93%.  This move nearly recovered the entire bearish previous Weekly bar – suggesting that traders were not going to be forced away from the metals markets by any shakeout.

Our ADL predictive modeling system on this Gold Monthly chart suggests Gold will rally above $1700 within 2~3 weeks, then briefly pause before rallying to levels just below $1800.  From there, it appears Gold will rally very quickly to near the $1902, a pullback to levels near $1820, then settle into a range near $1875 or higher.

Considering Gold was trading at $1560 just a few days ago, this represents a +21% rally from recent lows.

This ADL Monthly Silver chart also highlights the advance in prices in Silver and how the next 3~5+ weeks will likely support a moderate upside price advance to levels near $18.35 before a more aggressive upside move begins where $19, the $20, then $21 will be reached over a very short period of time (roughly 30 days).  Remember, the Gold to Silver ratio was sitting near 94 at the end of February.  If this ratio reverts back to levels near 75, Silver would likely rally 45% or more from current levels.

Don’t miss these incredible moves in precious metals.  The markets are actually gifting these recent low price levels to skilled traders.  We issued a research post just last week that suggested any move below $1600 in Gold was an excellent opportunity for skilled traders to load up.  Silver prices just above $16 was another gift for skilled traders.

We don’t believe these current levels will be available for much longer.  Our modeling systems are suggesting precious metals is just beginning a much bigger upside price move.  Now is the time to get in while you can before the +20% to +40% rally begins.

As a technical analysis and trader since 1997, I have been through a few bull/bear market cycles. I believe I have a good pulse on the market and timing key turning points for both short-term swing trading and long-term investment capital. The opportunities are massive/life-changing if handled properly.

I urge you visit my ETF Wealth Building Newsletter and if you like what I offer, join me with the 1-year subscription to lock in the lowest rate possible and ride my coattails as I navigate these financial market and build wealth while others lose nearly everything they own during the next financial crisis. Join Now and Get a Free 1oz Silver Bar!

Chris Vermeulen

TheTechnicalTraders.com


TLT Trade of the Year and What Is Next!

By TheTechnicalTraders.com

We just closed out our TLT position, which opened up 20.07% from our entry price, amazing. Who said bonds are dull and boring? haha

Only three times since 2008 have I seen bonds rally more than 20% from a new swing trade entry. Each time the move was short-lived, and the price collapsed after it within a few weeks. My goal is not to try and time tops and bottoms for the best entry and exit level. That is a gambler/losing strategy. Sure it pays big if you luck out and nail the timing, but they are few and far between, and the losses from trying will eat up any previous gain.

What I do is follow the price using my proven technical trading experience and tools, which I have acquired since 1997 and then apply position management to limit risk. I then use my trading systems for statistical analysis, so I know the odds for trade are favorable to win and also to pinpoint profit taking levels just like today’s TLT position closure.

Sure, TLT could pop and rally another 5-10%, but its highly unlikely, and it’s fear/volatility driven, so any spike higher from here is likely to drop straight back down shortly after. We got the low-risk easy money portion of the trade, and we are back in cash while everyone today is freaking out and losing money and piling into bonds because of fear, which is likely a top for the price of bonds for a while.

The bottom line, we avoided the stock market crash. We will not be trading inverse ETFs on the stock market until we enter a bear market. Until then, we avoid market corrections by moving to cash, then into bonds just like we have done with TLT. The SP500 is down 14% from the high a few weeks ago, and our TLT bond position is up 20% as of today.

We also made some good money on GDXJ for those who follow our trading strategy and position management. The last couple of weeks has been a tremendous learning experience, in my opinion. The recent price action amplifies how critical position management is (targets, stops) are for our long term trading success. No one knows where the price will ultimately move to or reverse, but through the use of technical analysis and our trading systems, we can consistently pull money out of the market each year.

Yes, we will have small losing trades from time to time like SSO, and UNG but when we do take a loss, they don’t cause much damage to our overall account because of our position sizing and stop levels. I was once told by my trading mentor in 2001 that you should be proud of yourself for taking a loss.

Taking a loss (closing a losing trade) means you are following rules, managing risk, and that you can accept your timing for the trade was wrong. That has stuck with me and pops into my head every time I have to bite the bullet and close out a losing trade.

The stock market is down 9.5% for the year as of today, our account is positive and making money, not many can say that right now. The Power of Technical Analysis!

Remember, successful trading is not about having a bunch of positions you have open, and thinking you always need to own something. It’s about limiting/avoided risk when the odds are unfavorable, and getting back into the market when they do become favorable. Cash is a position and sometimes its the best and only position to be in like right now.

Thanks, everyone, for the kind and uplifting emails, it really is amazing to navigate the market like this with all of you.

Happy Members Making Money!

Hi Chris, Many thanks for your sterling work. The beauty of your work is that you cover all asset classes to identify setups. One key lesson we learnt is to trust the bond market more than the equities market when the trend between the two asset classes diverges. 
Regards, Yusuf

Hi Chris,
I just wanted to send a quick note to tell you how impressed I am with your service and your trading system.  I’ve followed/subscribed to several folks over the past several years and have never seen anything like what you provide. Your timely and accurate technical analysis of the major markets is incredible and perfectly aligns with my preferred swing trading approach. My favorite part of the day is watching (and learning from) your morning videos. And to know that my account is steadily increasing in the face of utter market panic is invaluable.


Thanks so much for all you do!

Ryan M.

If you want to become part of an exquisite trading newsletter where you can learn to reach the charts, spot trades, profit targets, stops, and be force-fed winning trades like this TLT trade, and our GDXJ trade then join my Wealth Building Trading Newsletter Today!

Click Here: https://www.thetechnicaltraders.com/#pricing

Chris Vermeulen
Chief Market Strategist
Technical Traders Ltd.


Forex Technical Analysis & Forecast 06.03.2020

Article By RoboForex.com

EURUSD, “Euro vs US Dollar”

After forming another consolidation range around 1.1178, EURUSD has broken it to the upside. Possibly, the pair may extend the wave up to 1.1260. Today, the price may reach 1.1250 and then fall to return to 1.1185. After that, the instrument may form one more ascending structure towards 1.1260 to complete the wave and then resume trading downwards with the target at 1.1170.

EURUSD
Risk Warning: the result of previous trading operations do not guarantee the same results in the future

GBPUSD, “Great Britain Pound vs US Dollar”

After forming the consolidation range around 1.2870 and breaking it to the upside, GBPUSD has reached the short-term correctional target at 1.2960; right now, it is forming a new consolidation range around it. Possibly, today the pair may fall to test 1.2870 from above and then start a new growth towards 1.3010.

GBPUSD
Risk Warning: the result of previous trading operations do not guarantee the same results in the future

USDCHF, “US Dollar vs Swiss Franc”

After forming another consolidation range around 0.9565, USDCHF has broken it to the upside to reach 0.9444. Today, the pair may form grow towards 0.9515 and then fall to reach 0.9474, thus forming a new consolidation range between these two levels. After that, the instrument may start a new growth with the target at 0.9600.

USDCHF
Risk Warning: the result of previous trading operations do not guarantee the same results in the future

USDJPY, “US Dollar vs Japanese Yen”

After breaking the consolidation range downwards and extending the wave, USDJPY has reached the target at 105.85. Possibly, today the pair may start another growth towards 107.10 and then form a new descending structure to reach 106.38, thus forming a new consolidating rage between these two levels. Later, the market may break the range to the upside and resume trading upwards with the target at 109.00.

USDJPY
Risk Warning: the result of previous trading operations do not guarantee the same results in the future

AUDUSD, “Australian Dollar vs US Dollar”

AUDUSD is still consolidating above 0.6580. If later the price breaks this range to the downside, the market may start a new correction to reach 0.6520; if to the upside – resume trading upwards with the target at 0.6700.

AUDUSD
Risk Warning: the result of previous trading operations do not guarantee the same results in the future

USDRUB, “US Dollar vs Russian Ruble”

USDRUB is consolidating around 66.86. If later the price breaks this range to the upside, the market may grow to reach 67.97 or even extend this wave up to 68.20; if to the downside – start a new decline with the target at 65.25.

USDRUB
Risk Warning: the result of previous trading operations do not guarantee the same results in the future

USDCAD, “US Dollar vs Canadian Dollar”

USDCAD is still consolidating around 1.3410. Possibly, the pair may expand the range down to 1.3379 and then form one more ascending structure with the short-term target at 1.3494.

USDCAD
Risk Warning: the result of previous trading operations do not guarantee the same results in the future

XAUUSD, “Gold vs US Dollar”

After forming the consolidation range around 1639.00, Gold has broken it to the upside. According to the main scenario, the instrument is expected to form one more ascending structure with the target at 1694.00. Possibly, today the pair may reach 1688.40 and then start a new correction towards 1652.00. Later, the market may resume trading upwards with the above-mentioned target.

GOLD
Risk Warning: the result of previous trading operations do not guarantee the same results in the future

BRENT

Brent has broken its consolidation range to the downside. Today, the pair may fall to reach 59.40 and then start another growth with the target at 51.25. Later, the market may form a new descending structure towards 48.50 to complete this wave and then resume trading upwards to reach 55.05.

BRENT
Risk Warning: the result of previous trading operations do not guarantee the same results in the future

BTCUSD, “Bitcoin vs US Dollar”

BTCUSD has broken 8900.00 to the upside; right now, it is trading around 9000.00. Possibly, the pair may continue growing with the short-term target at break 9400.00. After that, the instrument may start a new correction to return to 9000.00 and then form one more ascending structure with the first target at 9600.00.

BITCOIN

Article By RoboForex.com

Attention!
Forecasts presented in this section only reflect the author’s private opinion and should not be considered as guidance for trading. RoboForex LP bears no responsibility for trading results based on trading recommendations described in these analytical reviews.

Fibonacci Retracements Analysis 06.03.2020 (BITCOIN, ETHEREUM)

Article By RoboForex.com

BTCUSD, “Bitcoin vs US Dollar”

As we can see in the H4 chart, after correcting to the downside by 50.0% and forming a short-term convergence, BTCUSD is starting a new rising wave. The targets are the high at 10505.60 and then 61.8% at 11015.00.

BTCUSD_H4
Risk Warning: the result of previous trading operations do not guarantee the same results in the future

The H1 chart shows more detailed structure of the current uptrend. The pair is steadily growing towards 38.2% fibo at 9212.00 and may later reach 50.0% and 61.8% fibo at 9460.00 and 9706.40 respectively.

BTCUSD_H1
Risk Warning: the result of previous trading operations do not guarantee the same results in the future

ETHUSD, “Ethereum vs. US Dollar”

As we can see in the daily chart, ETHUSD is consolidating around 38.2% fibo. Right now, the pair is trying to break the range to the upside and reach the high at 288.98 and then 76.0% fibo at 304.00. In the case of a further decline, the targets will be 50.0% and 61.8% fibo at 202.54 and 182.15 respectively.

ETHUSD_H4
Risk Warning: the result of previous trading operations do not guarantee the same results in the future

The H1 chart says that the current consolidation is a correction of the previous descending wave, which has already reached 38.2%. The next targets are 50.0% and 61.8% fibo at 243.65 and 251.57 respectively. The resistance is the high at 209.28.

ETHUSD_H1

Article By RoboForex.com

Attention!
Forecasts presented in this section only reflect the author’s private opinion and should not be considered as guidance for trading. RoboForex LP bears no responsibility for trading results based on trading recommendations described in these analytical reviews.

Coronavirus-fueled short recession risk, investors urged to take action

By George Prior

A coronavirus-driven short, sharp global recession risk is growing and investors are urged to take steps now to build and protect their wealth, warns the CEO of one of the world’s largest financial advisory organizations.

The warning from Nigel Green, the chief executive and founder of deVere Group, comes as confirmed cases rise and governments and central banks around the world are taking increasingly aggressive measures to try and combat the economic impact of the outbreak.

Amongst the steps being taken on Tuesday, the U.S. Federal Reserve announced that it would slash interest rates by half a percentage point. Meanwhile, the Bank of England is drafting an action plan to deliver a “powerful and timely” response to the coronavirus outbreak, and Australia signals it may resort to Quantitative Easing.

Mr Green affirms: “The outbreak is developing and evolving quickly and no-one accurately can predict what will be the economic fallout.

“However, I believe that based on what we currently know, the risk of a coronavirus-driven short, sharp global recession this year is significantly growing.

“The epidemic has already dented anaemic global economic growth this year and it can be expected to slow further, then contract, as the fear of the virus takes hold.”

He continues: “The outbreak has already sent the stock market into bouts of volatility not seen since the 2008 financial crisis, severely disrupted global supply chains, shuttered factories, grounded flights, closed attractions and cancelled major events. Entire powerhouse cities in Asia and Europe are nearly shut down. Multinational companies have warned that coronavirus will severely hit profits. Workers are being evacuated and forced to work from home and to avoid travelling.

“We can see both supply and consumer demand are already being impacted in key sectors, such as travel and tourism, hospitality, manufacturing and retail, and it is going to extend to others.

“This scenario is then likely to feed on itself: a lack of consumer confidence and spending, lack of business investment, more job cuts, which means even less spending and demand, which leads to further job cuts.

“Unfortunately, companies already on the edge are likely to fold as we have seen this week.”

Mr Green goes on to say: “Against this backdrop, we should prepare for a short-term but severe global recession.

“However, the world economy is likely to bounce back strongly. We could even see revived global growth as economies rebuild and adapt; and especially so if central banks and governments step in to actively kick-start growth.”

The deVere CEO says: “The short-term economic impact of coronavirus is likely to affect capital markets, which in turn affects investor returns.

“Coronavirus has shifted the landscape. Investors are urged to review their portfolios to ensure that they are still on track to create, build and protect their wealth.”

About:

deVere Group is one of the world’s largest independent advisors of specialist global financial solutions to international, local mass affluent, and high-net-worth clients.  It has a network of more than 70 offices across the world, over 80,000 clients and $12bn under advisement.

The US Dollar Is Declining. Spread of the COVID-19 Virus Is Still in the Spotlight

by JustForex

The US dollar continues to lose ground against a basket of major currencies. The dollar index (#DX) closed in the red zone (-0.59%). The US currency is still under pressure amid the prospects for a further reduction in the Fed interest rates. Quite weak economic data from the US were also published yesterday. So, initial jobless claims counted to 216K, while experts forecasted 215K. At the moment, financial market participants have taken a wait-and-see attitude before the publication of the US labor market report for February.

The British pound has updated local highs again. Comments by the Governor of Bank of England supported the pound. The official believes that more clarity is needed regarding the COVID-19 virus before rushing into an emergency rate cut. Meanwhile, it is reported that coronavirus is spreading throughout the United States. At least 57 new cases of coronavirus were confirmed nationwide on Thursday when the virus was first detected in Colorado, Maryland, Tennessee and Texas, as well as in San Francisco.

The “black gold” prices have updated the lows again. At the moment, futures for the WTI crude oil are testing the $44.10 mark per barrel.

Market indicators

Yesterday, there were aggressive sales in the US stock market: #SPY (-3.32%), #DIA (-3.48%), #QQQ (-3.04%).

The 10-year US government bonds yield fell sharply again. At the moment, the indicator is at the level of 0.77-0.78%.

The news feed on 2020.03.06:
  • – Report on the US labor market at 15:30 (GMT+2:00);
  • – Data on the labor market of Canada at 15:30 (GMT+2:00).


We also recommend paying attention to the speeches by FOMC representatives.

by JustForex

The Analytical Overview of the Main Currency Pairs on 2020.03.06

by JustForex

The EUR/USD currency pair

Technical indicators of the currency pair:
  • Prev Open: 1.11346
  • Open: 1.12397
  • % chg. over the last day: +0.78
  • Day’s range: 1.12112 – 1.12488
  • 52 wk range: 1.0879 – 1.1572

The EUR/USD currency pair continues to show positive trends. During yesterday’s trading the growth of quotations exceeded 100 points. The EUR found resistance at 1.12500. The mark 1.11800 is already a mirror support. Greenback remains under pressure amid prospects for further Fed interest rate cuts. At the moment, the financial markets participants are waiting for the release of the US Labor Market Report for February. We recommend paying attention to the difference between actual and forecasted values of the indicators. Open positions from key levels and keep an eye on the FOMC presentations.

The Economic News Feed for 06.03.2020 is calm.

EUR/USD

The indicators signal the strength of buyers: the price has fixed above 50 MA and 100 MA.

MACD histogram is in the positive zone, which indicates a bullish sentiment.

The Stochastic Oscillator is in the neutral zone, the %K line is below the %D line, which gives a sell signal for EUR/USD.

Trading recommendations
  • Support levels: 1.11800, 1.11000, 1.10500
  • Resistance levels: 1.12500, 1.13000

If the price fixes above 1.12500, further growth of EUR/USD quotes is expected to 1.13000-1.13200.

Alternatively, the EUR/USD currency pair may decline to 1.11400-1.11000.

The GBP/USD currency pair

Technical indicators of the currency pair:
  • Prev Open: 1.28697
  • Open: 1.29477
  • % chg. over the last day: +0.60
  • Day’s range: 1.29400 – 1.29655
  • 52 wk range: 1.1959 – 1.3516

The GBP/USD currency pair is dominated by bullish sentiments. Sterling has updated the local highs again. The pound was supported by the comments of the Head of the Bank of England. The official believes that more clarity on the COVID-19 virus is needed before rushing to an emergency drop in rates. At the moment, GBP/USD quotes are testing resistance level 1.29700. The mark 1.29100 is already a mirror support. The trading instrument has a potential for further growth. We expect economic releases from the USA. We recommend opening positions from key levels.

The news background on the British economy is quite calm.

GBP/USD

The indicators signal the power of buyers: the price has fixed above 50 MA and 100 MA.

MACD histogram is in the positive zone, which indicates a bullish sentiment.

The Stochastic Oscillator is in the neutral zone, the %K line crosses the %D line. No signals at the moment.

Trading recommendations
  • Support levels: 1.29100, 1.28600, 1.28250
  • Resistance levels: 1.29700, 1.30150

If the price fixes above 1.29700, expect further growth to 1.30100-1.30400.

Alternatively, the GBP/USD currency pair may decline to 1.28700-1.28400.

The USD/CAD currency pair

Technical indicators of the currency pair:
  • Prev Open: 1.33864
  • Open: 1.34058
  • % chg. over the last day: +0.05
  • Day’s range: 1.33870 – 1.34134
  • 52 wk range: 1.2949 – 1.3566

There is a mixed technical picture on the USD/CAD currency pair. The CAD is in sideways movement. USD/CAD quotes are testing local support and resistance levels at 1.33800 and 1.34300, respectively. Investors took a waiting position before the publication of reports on the labor market in the USA and Canada. We also recommend paying attention to the dynamics of black gold prices. Open positions from key levels.

At 15:30 (GMT+2:00) we expect the labor statistics for the Canadian labor market.

USD/CAD

Indicators do not give an accurate signal: 50 MA crossed 100 MA.

MACD histogram is near the 0 mark.

The Stochastic Oscillator is in the neutral zone, the %K line is below the %D line, which indicates a bearish sentiment.

Trading recommendations
  • Support levels: 1.33800, 1.33200, 1.32650
  • Resistance levels: 1.34300, 1.34600

If the price fixes above 1.34300, expect the quotes to grow toward 1.34700-1.35000.

Alternatively, the quotes could descend toward 1.33300-1.33000.

The USD/JPY currency pair

Technical indicators of the currency pair:
  • Prev Open: 107.529
  • Open: 106.128
  • % chg. over the last day: -1.18
  • Day’s range: 105.754 – 106.263
  • 52 wk range: 104.45 – 113.53

USD/JPY quotes continue showing a steady downtrend. The yen reached its semi-annual highs against the USD. Demand for safe haven currencies remains at a high level. At the moment, the trading instrument is consolidating in the range 105.800-106.500. The focus is on the US labor market report. We also recommend paying attention to the dynamics of US government bond yields. Open positions from key levels.

The Economic News Feed for 06.03.2020 is calm.

USD/JPY

The indicators signal the sellers’ strength: the price has fixed below 50 MA and 100 MA.

The MACD histogram is in the negative zone, which indicates a bearish sentiment.

The Stochastic Oscillator started to exit the oversold zone, the %K line is above the %D line, which indicates a possible correction of the USD/JPY currency pair.

Trading recommendations
  • Support levels: 105.800, 105.000
  • Resistance levels: 106.500, 107.000, 107.700

If the price fixes below 105.800, USD/JPY quotes are expected to fall further. Potential for movement towards the round level of 105.000.

Alternatively, the quotes could correct toward 107.000-107.700.

by JustForex