Author Archive for InvestMacro – Page 80

US yields about to collapse – Gold breaking 1,700 USD only a question of time

By Admiral Markets

Economic Events

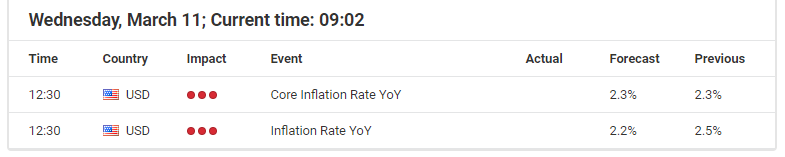
Source: Economic Events March 11, 2020 – Admiral Markets’ Forex Calendar

Global financial markets were hit by another risk-off wave at the start of the week, after oil prices collapsed in response to Russia resisting Saudi Arabia’s push for deeper production cuts at the OPEC meeting last week.

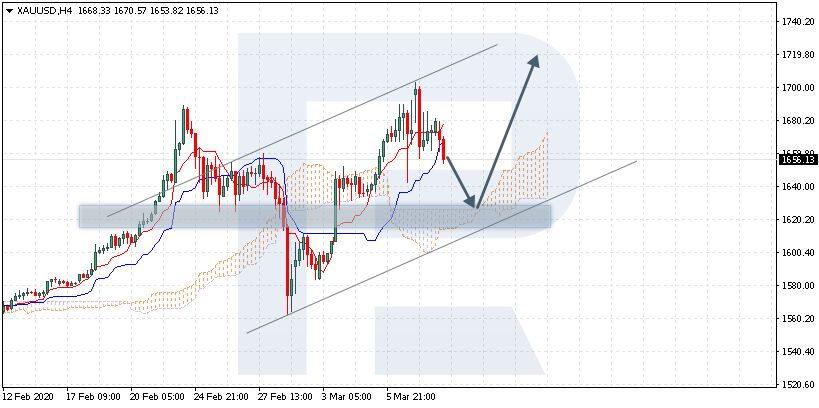
While Equity markets dropped massively, and market participants talked of a “Black Monday”, Gold failed to significantly break above 1,700 USD.

This seemed to be because traders sold profitable Gold positions to meet margin calls resulting out of dropping Equity prices.

But even if Gold lost some of its bullish momentum, the outlook stays very favourable for the precious metal: after the Fed announced its “emergency rate cut” last Tuesday, the first time since October 2008, and market participants expect further cuts by the Fed.

In fact, the Fed Watch Tool currently sees the Fed cutting another 75 basis points at the meeting on March 18, with volatility staying elevated and a clear risk-off bias among market participants, which should keep the pressure on US yields high. Thus, the outlook for Gold stays very positive and a sustainable break above 1,700 USD seems only to be a question of time.

Technically, the mode stays bullish as long as we trade above the daily trend support which can still be found around 1,535/545 USD:

Gold Daily chart

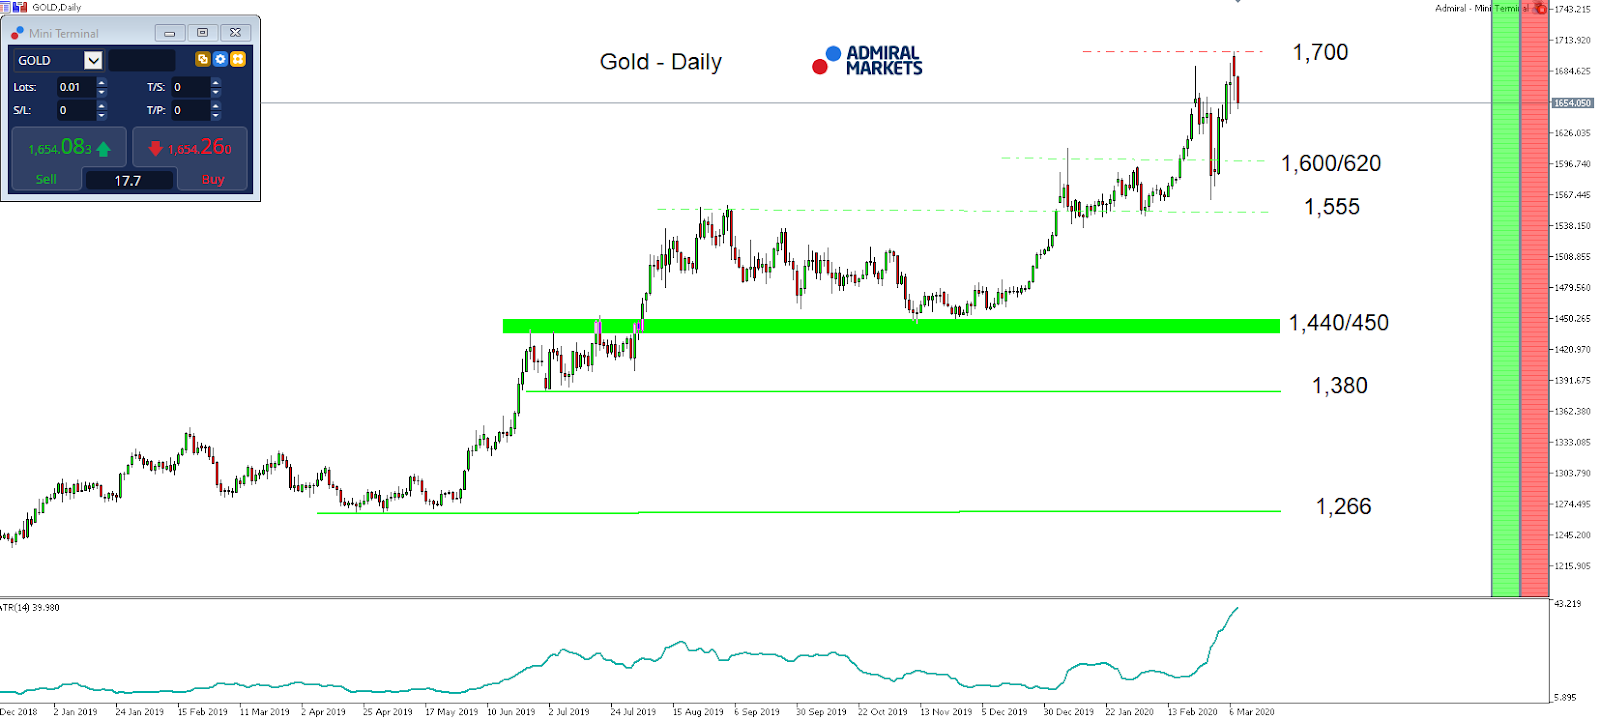
Source: Admiral Markets MT5 with MT5-SE Add-on Gold Daily chart (between December 7, 2018, to March 10, 2020). Accessed: March 10, 2020, at 10:00pm GMT – Please note: Past performance is not a reliable indicator of future results, or future performance.

In 2015, the value of Gold fell by 10.4%, in 2016, it increased by 8.1%, in 2017, it increased by 13.1%, in 2018, it fell by 1.6%, in 2019, it increased by 18.9%, meaning that after five years, it was up by 28%.

Discover the world’s #1 multi-asset platform

Admiral Markets offers professional traders the ability to trade with a custom, upgraded version of MetaTrader 5, allowing you to experience trading at a significantly higher, more rewarding level. Experience benefits such as the addition of the Market Heat Map, so you can compare various currency pairs to see which ones might be lucrative investments, access real-time trading data, and so much more. Click the banner below to start your FREE download of MT5 Supreme Edition!

Trade With MetaTrader 5

Disclaimer: The given data provides additional information regarding all analysis, estimates, prognosis, forecasts or other similar assessments or information (hereinafter “Analysis”) published on the website of Admiral Markets. Before making any investment decisions please pay close attention to the following:

  1. This is a marketing communication. The analysis is published for informative purposes only and are in no way to be construed as investment advice or recommendation. It has not been prepared in accordance with legal requirements designed to promote the independence of investment research, and that it is not subject to any prohibition on dealing ahead of the dissemination of investment research.
  2. Any investment decision is made by each client alone whereas Admiral Markets shall not be responsible for any loss or damage arising from any such decision, whether or not based on the Analysis.
  3. Each of the Analysis is prepared by an independent analyst (Jens Klatt, Professional Trader and Analyst, hereinafter “Author”) based on the Author’s personal estimations.
  4. To ensure that the interests of the clients would be protected and objectivity of the Analysis would not be damaged Admiral Markets has established relevant internal procedures for prevention and management of conflicts of interest.
  5. Whilst every reasonable effort is taken to ensure that all sources of the Analysis are reliable and that all information is presented, as much as possible, in an understandable, timely, precise and complete manner, Admiral Markets does not guarantee the accuracy or completeness of any information contained within the Analysis. The presented figures refer that refer to any past performance is not a reliable indicator of future results.
  6. The contents of the Analysis should not be construed as an express or implied promise, guarantee or implication by Admiral Markets that the client shall profit from the strategies therein or that losses in connection therewith may or shall be limited.
  7. Any kind of previous or modeled performance of financial instruments indicated within the Publication should not be construed as an express or implied promise, guarantee or implication by Admiral Markets for any future performance. The value of the financial instrument may both increase and decrease and the preservation of the asset value is not guaranteed.
  8. The projections included in the Analysis may be subject to additional fees, taxes or other charges, depending on the subject of the Publication. The price list applicable to the services provided by Admiral Markets is publicly available from the website of Admiral Markets.
  9. Leveraged products (including contracts for difference) are speculative in nature and may result in losses or profit. Before you start trading, you should make sure that you understand all the risks.

By Admiral Markets

Why You May Want to Avoid Buying Options This Week

By TheTechnicalTraders – If you do not understand implied volatility and you are buying put or call options or some combination, you have been warned!

The market continues to move very fast, has large swings, and one would think that makes it an excellent time to buy options for huge gains, right? Our Research Team believes that large Volatility swings will be here for a while. Once you understand the significant role Volatility plays in Option Pricing, you may want to avoid this investment construct for some time to come.

The VIX is at an extreme level and has only been over 50 only seven times in the past 25 years based on a daily closing price. It evident the last two trading sessions the investment sentiment has been bearish and option puts make money if price declines, which has been the popular trade of choice until now.

What many options traders do not understand, however, is that the price of options is configured using implied volatility.

The more volatility, the more expensive the options become to factor in the wild swings the underlying security may experience. This is reflected in the price the option trades off to factor in the fear and trepidation.

This can be seen in the substantial premium on top of the intrinsic pricing from the strike price.

Be sure to opt-in to our free market trend signals before closing this page, so you don’t miss our next special report!

For example, bank stocks are usually considered very conservative when implied volatility is under 20. This results in options being priced accordingly.

However, in the last few trading sessions, volatility has jumped, reaching 62 at one point this week already, which is more than 3x what you would want when simply buying options. This is a VERY HIGH RISK and a difficult time to buy options. Unfortunately, this is what most options traders do, they BUY options, and while it may work in most market conditions, this is most likely NOT the time you want to do so until such time Volatility and VIX begin to subside and we do not see that in the near future.

Let me try to explain in the most basic laymen terms because I know 95% of options trades don’t really get this, and it boggles my mind. As you know, or should know, buying options is one of the riskiest and hardest ways to profit from the market, in my opinion (and statistics continue to prove this out as MOST option buyers LOSE money). I traded options years ago and do very little options trading now, though they are still a great way to make money with certain trade setups and in certain market conditions.

Options Risk #1: Time Decay/Theta

In short, trying to time the market with an index, stock, sector, commodity, or currency is hard enough, but when you buy options, you make things a whole lot harder for yourself. Not only do you need to time this almost perfectly so that the underlying asset has time to move, but you need to time it with precision because now the time is your enemy (Theta).

Every day the option contract you bought is going to lose value because you lose time, and there are fewer days left for your asset to move in the direction to make up for the large premium embedded in the option price. Each day this time premium begins to erode. The closer you get to the time expiration, the faster the time premium decays.

Options Risk #2: Implied Volatility

This is the main issue I want to share and the reason for writing this article for you.

If options are valued in relation to implied volatility (which they are), then when the volatility is above 50 (62 as of Monday, March 9) and the option is worth $1,00.

Here is the issue, even if the price of your asset stays the same, but the fear in the market fades away as it always does from this extreme level, your option value will decline dramatically. I’m just using numbers out of thin air for the example so you can grasp the issues easily.

If implied volatility drops from 62 down to 35, the option contract value will go down with the volatility as well. The $1.00 contract priced with huge volatility could now be worth $0.85 overnight.

If you traded a short-term option contract, then you will also have time decay, and your option would drop even more to say $0.82.

Remember this is the type of price action you will experience and the VIX falling (and fear subsiding) and even if your asset price just stays the same you have the potential for a significant loss and is the reason why buying options during extreme high volatility is not the trade that should be taken.

Options Trading Tip

If implied volatility is over 25 then 
it is usually better to be a seller of options, 
if it’s under 25, then its often better to be a buyer.

So what does a trader do? 

We encourage investors to use probabilities to work in your favor!

You could put on debit spreads: This way, some of the volatility is reduced as you sell a put or call, so the volatility premium is now in your favor, and time decay is mitigated.

OR

Sell it to those people that are so sure of this big move!

We have already identified that we are in a period where the VIX in an area very rarely seen. But since the VIX can stay here for a while, a more logical option move may be to sell calls going out into the future. Due to contango, it will retrace back down as the contango effect will begin to change as trader sentiment improves, and fear is reduced.

Credit spreads have so many advantages over simply buying calls and puts

  • Defined risk – Can only lose the difference of your strikes less the premium received.
  • If the trade starts to go against, you have backup options to manage risk.
  • Roll the trade to a future date giving your trade time to work out.
  • Sell another option spread opposite of your existing trade (if a put spread on place a credit call spread, this creates an iron condor) now giving you a larger cushion for the trade to work as you received more premium.
  • Buyback the offending strike at a loss and let the profitable strike run if you feel it has legs.
  • Buy a put to defend your spread further out in time as theta decay does not get affected as quickly.
  • Use a stop loss of 2x or 3x premium received etc.
  • or take possession of the stock
  • Income – selling out of the money credit spreads can be an effective way of generating a passive revenue stream

RISK REWARD is most important, and it is critical to get into the right trade at the right time. Remember that theta-neutral trades and buying options are when implied volatility is low. Selling options, when implied volatility is high, is your best option.

  • This is where we are right now.

I hope this helps shed some light on the basics of why buying options during high volatility is an uphill battle, no matter how good your timing is to predict the movement of the underlying asset you are trading.

In the near future, my team and I will make our options trades available to follow. As you know, timing the market is our specialty. Knowing what time frame an asset will rally or breakdown, and how far its first move will give us a distinct advantage to pinpoint the ideal option contracts to consider buying or selling for maximum short-term gains.

Happy Trading!

Chris Vermeulen

TheTechnicalTraders.com


Markets rebound on stimulus hopes, expected to recover by year end: deVere CEO

By George Prior

Global stocks are rebounding on stimulus measures and can be expected to recover considerably by the end of the year, affirms the CEO of one of the world’s largest independent financial advisory organizations.

The comment from Nigel Green, CEO and founder of deVere Group, comes as shares in the Asia-Pacific region jumped and European indices opened higher on Tuesday, recovering from dramatic losses on Monday following the increase in the number of certified coronavirus cases and the oil price war that ignited over the weekend.

Mr Green notes: “Stock markets will rebound quickly on news of stimulus measures to be implemented by governments around the world to help cushion the economic impact of coronavirus and the oil price war that developed over the weekend.”

China has an investment plan for this year of tens of trillions of yuan, including gas pipelines and nuclear power plants.

U.S. President Donald Trump has pledged a “major” economic relief package, potentially to include a payroll tax cut.

The UK Chancellor is expected to announce a raft of emergency measures to support businesses in his first budget on Wednesday.

Meanwhile, Australia’s billion-dollar coronavirus stimulus package is likely to include one-off cash payments to certain groups.

The deVere chief executive continues: “The stimulus packages within major economies, together with the practical measures being taken to limit the spread of coronavirus – such as Italy’s Prime Minister Giuseppe Conte placing the entire country on lockdown – plus China signalling that the outbreak has peaked with a visit to Wuhan by President Xi, will serve to calm markets.

“We expect global stock markets – which are actively seeking bullish signals – to have recovered significantly before the year end.

“Right now investors, such as myself, are using this wave of volatility to review their portfolios where necessary and, importantly, to drip-feed new money into the market.

“A growing number of investors are going to be taking advantage of the current lower entry points to enhance their portfolios in the near-term.”

The deVere CEO concludes: “Markets are rebounding and it is likely that they will recover significantly by the end of 2020.

“Investors need to ensure that they remain in the markets with well-diversified portfolios and should consider topping up their portfolios sooner rather than later in order to create, grow and protect their wealth.”

About:

deVere Group is one of the world’s largest independent advisors of specialist global financial solutions to international, local mass affluent, and high-net-worth clients.  It has a network of more than 70 offices across the world, over 80,000 clients and $12bn under advisement.


Japanese Candlesticks Analysis 10.03.2020 (EURUSD, USDJPY, EURGBP)

Article By RoboForex.com

EURUSD, “Euro vs. US Dollar”

As we can see in the H4 chart, the pair continues growing. By now, EURUSD has completed several reversal candlestick patterns, such as Shooting Star, close to the resistance level. Right now, the pair is still reversing. We may assume that later the price may move to reach 1.1250. However, one shouldn’t exclude a possibility that the price may continue growing without any pullbacks towards 1.1250.

EURUSD
Risk Warning: the result of previous trading operations do not guarantee the same results in the future

USDJPY, “US Dollar vs. Japanese Yen”

As we can see in the H4 chart, the fundamental background made USDJPY fall. After testing the support level, the price has formed several reversal patterns, including Hammer. Right now, the pair is reversing. The current situation implies that the price may grow to reach 107.10. At the same time, the pair may choose another scenario, according to which the instrument is expected to continue falling towards 101.20 after a slight correction.

USDJPY
Risk Warning: the result of previous trading operations do not guarantee the same results in the future

EURGBP, “Euro vs. Great Britain Pound”

As we can see in the H4 chart, after testing the resistance level again, EURGBP has formed several reversal patterns, such as Shooting Star. Right now, the pair is reversing. At the moment, we may assume that later the market may form a new pullback towards 0.8645. However, one shouldn’t exclude an opposite scenario, which implies that the instrument may continue the rising tendency with the target at 0.8800.

EURGBP

Article By RoboForex.com

Attention!
Forecasts presented in this section only reflect the author’s private opinion and should not be considered as guidance for trading. RoboForex LP bears no responsibility for trading results based on trading recommendations described in these analytical reviews.

Ichimoku Cloud Analysis 10.03.2020 (GBPUSD, XAUUSD, USDCAD)

Article By RoboForex.com

GBPUSD, “Great Britain Pound vs US Dollar”

GBPUSD is trading at 1.3045; the instrument is moving above Ichimoku Cloud, thus indicating an ascending tendency. The markets could indicate that the price may test Tenkan-Sen and Kijun-Sen at 1.2975 and then resume moving upwards to reach 1.3315. Another signal to confirm further ascending movement is the price’s rebounding from the support level. However, the scenario that implies further growth may be canceled if the price breaks the cloud’s downside border and fixes below 1.2780. In this case, the pair may continue falling towards 1.2675.

GBPUSD
Risk Warning: the result of previous trading operations do not guarantee the same results in the future

XAUUSD, “Gold vs US Dollar”

XAUUSD is trading at 1656.00; the instrument is moving above Ichimoku Cloud, thus indicating an ascending tendency. The markets could indicate that the price may test the cloud’s upside border at 1625.00 and then resume moving upwards to reach 1720.00. Another signal to confirm further ascending movement is the price’s rebounding from the rising channel’s downside border. However, the scenario that implies further growth may be canceled if the price breaks the cloud’s downside border and fixes below 1605.00. In this case, the pair may continue falling towards 1575.00.

GOLD
Risk Warning: the result of previous trading operations do not guarantee the same results in the future

USDCAD, “US Dollar vs Canadian Dollar”

USDCAD is trading at 1.3623; the instrument is moving above Ichimoku Cloud, thus indicating an ascending tendency. The markets could indicate that the price may test Tenkan-Sen and Kijun-Sen at 1.3565 and then resume moving upwards to reach 1.3845. Another signal to confirm further ascending movement is the price’s rebounding from the rising channel’s downside border. However, the scenario that implies further growth may be canceled if the price breaks the cloud’s downside border and fixes below 1.3305. In this case, the pair may continue falling towards 1.3210.

USDCAD

Article By RoboForex.com

Attention!
Forecasts presented in this section only reflect the author’s private opinion and should not be considered as guidance for trading. RoboForex LP bears no responsibility for trading results based on trading recommendations described in these analytical reviews.

EURUSD: correction sees price meet balance line

By Alpari.com

On Monday, March 9, trading on the euro ended with an increase of 1.35% (+152 points). This was the worst day for the stock market. Trading on the New York Stock Exchange was suspended during the session after the indices fell by 7.0%. This was the first suspension in trading on the stock exchange since 2008. After trading was resumed, the indices corrected slightly.

The main reason for the strengthening of the euro and the fall of stock indices was the collapse of the oil market. The price of Brent fell 31% to $31 USD. Russia refused to agree to the OPEC deal, and Saudi Arabia promised to increase its production to 12 million barrels and reduced the price of its oil for buyers.

The fall in oil prices negatively affected commodity currencies. AUSUSD fell to 0.6314 (winning back all losses in the process), the lowest since 2009. USDCAD rose to 1.3759, the highest since 2018.

Today’s events (GMT+3):

  • 13:00 Eurozone: Gross Domestic Product s.a. (YoY) (Q4), Employment Change (YoY) (Q4).
  • 23:30 USA: API Weekly Crude Oil Stock (Mar 6).

1003Current events:

Due to the collapse in oil prices, no one is currently discussing macroeconomic indicators. Everyone forgot about the release of Friday’s payroll data. The price per barrel of Brent crude oil corrected by $5 UDS from a minimum of $31.25 USD.

In Asia, the EURUSD pair completely blocked yesterday’s growth. The correction was at the 135th degree, and the price rolled back to the balance line. Technically, the pair can expect growth. Given that futures on the SP500 recovered by 3.5%, then against the backdrop of positive dynamics of stock indices and oil, the downwards correction may gather pace.

According to the forecast, a breakdown of the lower line of the channel and a decrease down to the 180th degree were considered – 1.1281. It is more logical to rely on a price reversal model, which is similar to the models observed with cryptocurrencies.

We expect growth to 1.1395-1.14. If it is sharp, then above 67th degree. Then the realization of the decline will be in question. Here we will have to wait a day to understand what position the market will form and what market players expect. There are a lot of long positions open, so bears are looking for a moment to advance in order to tear off the stops over the longs and use them as fuel to lower the price down to the 1.12 area. But, buying after yesterday’s rally is risky business.

By Alpari.com

Forex Technical Analysis & Forecast 09.03.2020

Article By RoboForex.com

EURUSD, “Euro vs US Dollar”

EURUSD has broken 1.1230 to the upside and may continue growing towards 1.1512. After that, the instrument may start a new correction to reach 1.1217 and then form one more ascending structure towards 1.1669.

EURUSD
Risk Warning: the result of previous trading operations do not guarantee the same results in the future

GBPUSD, “Great Britain Pound vs US Dollar”

After breaking 1.2999 to the upside, GBPUSD has reached 1.3123. Possibly, the pair may fall towards 1.3049 and then form one more ascending structure to reach 1.3130 or even 1.3159. Later, the market may start a new decline with the target at 1.2950.

GBPUSD
Risk Warning: the result of previous trading operations do not guarantee the same results in the future

USDCHF, “US Dollar vs Swiss Franc”

After breaking 0.9350, USDCHF is still trading downwards. Possibly, the pair may fall to reach 0.9065 and then start a new correction with the target at 0.9460.

USDCHF
Risk Warning: the result of previous trading operations do not guarantee the same results in the future

USDJPY, “US Dollar vs Japanese Yen”

After breaking 105.44 to the downside, USDJPY has reached 101.85. Possibly, today the pair may start another growth towards 103.50 and then resume trading inside the downtrend with the target at 100.75.

USDJPY
Risk Warning: the result of previous trading operations do not guarantee the same results in the future

AUDUSD, “Australian Dollar vs US Dollar”

After rebounding from 0.6657 to the downside, AUDUSD has reached the target at 0.6336. Today, the pair may resume trading upwards to reach 0.6624 and then form a new descending structure with the target at 0.6252.

AUDUSD
Risk Warning: the result of previous trading operations do not guarantee the same results in the future

USDRUB, “US Dollar vs Russian Ruble”

USDRUB is moving upwards. Possibly, today the pair may break 68.48 and then continue growing with the short-term target at 72.48. After that, the instrument may start a new correction towards 68.50 and then resume trading upwards with the target at 74.24.

USDRUB
Risk Warning: the result of previous trading operations do not guarantee the same results in the future

USDCAD, “US Dollar vs Canadian Dollar”

After breaking 1.3460, USDCAD has reached 1.3707. Later, the market may correct towards 1.3520 and then continue trading inside the uptrend with the key target at 1.3850.

USDCAD
Risk Warning: the result of previous trading operations do not guarantee the same results in the future

XAUUSD, “Gold vs US Dollar”

After finishing the ascending wave at 1694.40, Gold is correcting towards 1656.80. After that, the instrument may form one more ascending structure with the target at 1715.20.

GOLD
Risk Warning: the result of previous trading operations do not guarantee the same results in the future

BRENT

After breaking its consolidation range to the downside at 45.20, Brent has reach 34.20. Today, the pair may consolidate near the current lows. If later the price breaks this range to the upside, the market may start a new correction towards 41.75; if to the downside – resume trading inside the downtrend with the target at 20.65.

BRENT
Risk Warning: the result of previous trading operations do not guarantee the same results in the future

BTCUSD, “Bitcoin vs US Dollar”

After reaching 8200.00 and forming a new consolidation range around 8153.00, BTCUSD has broken it to the downside; right now, it is extending the descending wave with the short-term target at 7600.00. After that, the instrument may start a new correction to return to 8000.00 and then form a new descending structure towards 7150.00.

BTCUSD

Article By RoboForex.com

Attention!
Forecasts presented in this section only reflect the author’s private opinion and should not be considered as guidance for trading. RoboForex LP bears no responsibility for trading results based on trading recommendations described in these analytical reviews.

Emergency Technical Traders Market Crash Update & Video Analysis

By TheTechnicalTraders

The US stock market opened Sunday, March 8, 2020, dramatically lower.  Oil collapsed 25% to near $30.  Gold shot higher to levels just above $1700.  All of the major US indexes were lower than 5%.  As of this morning, the US major indexes are lower by 6.40%, and oil down 23%. Bonds are set to open 7-8% higher at this time.

As mentioned in yesterday’s update, we could see metals and miners get hit with margin calls, and silver took a beating last night down over 5%, and miners are down 5% in pre-market, so things could get uglier yet.

The war on oil has officially started. To me, it’s a typical bully/bad guy move. When everyone is bleeding, and in trouble like the financial markets, everyone’s mental state, and our health, the true bullies and bad guys (sharks) come out of the woodwork. Russia is being difficult and will keep production high for oil; the Saudis are giving out hug discounts on oil and jacking up their production to flood the market with their oil and take as much of the market share possibly. When blood is in the water, the sharks attack.

This oil war is going to devastate the USA and Canadian oil sectors and businesses if the price of oil trades between $20-35 per barrel, which I think is what will happen and could last a few years.

The US futures for stock hit a circuit breaker and halted futures trading of the Indexes once a 5% drop took place, but ETF and regular stocks will continue to trade. The next round of circuit breakers are only during regular trading hours and was implemented after the May 10, 2010, flash crash.

This new set of circuit breakers have never been hit before which are:
A drop of 7% stock halt for 15 minutes.
A drop of 13% stocks halt for 15 minutes.
A drop of 20% stocks halt for the rest of the session.

This is a huge breakdown in the US markets and indicates much greater weakness within the global markets and further concern that the COVID-19 virus may continue to disrupt the US and European markets (as well as others).

The potential that multiple billion-dollar disruptions in the US and other foreign markets, including travel, leisure, autos, hospitality, and many others, may see a continued decline in sales and incomes over the next 6+ months.  We don’t believe we will truly understand the total scope of this COVID-19 virus event until possibly well after July 2020.

The crazy part is I’m in a little secluded town in Canada, and people are starting to panic and buy food and toilet paper for their bunker stash. Almost everyone I talked to this weekend while out snowboarding has been affected by manufacturing, trade show cancellations, travel restrictions, etc..  We are in a full out global crisis that seems to affect everyone in some way no matter their location, occupation, or business.

There will be some great opportunities to find and execute incredible trading opportunities – yet the risks are very high right now for volatility and price rotation.  Think of the markets like a body of water in a severe storm.  The waters are very choppy, unstable, and chaotic – just like the markets.

Unless you have the right information, skills, and vehicle to navigate these waters, there is a very high probability that a dangerous outcome could happen. I closed out our last position on Friday with our TLT bond trade for a 20.07% profit and we are 100% cash watching this market VS trying to survive it.

Right now, Cash is king.
Waiting for proper setups and understanding risks is critical.  Timing your entries and targets is critical.  Learning to stay away from excessive risk is essential.

We’ll scan the markets for you and find the best opportunities that set up over the next week.

We appreciate your loyalty and want to continue to deliver superior analysis and research.  Please be well aware that the current market environment is very dangerous for traders.  The VIX recently touched above 50.  We believe it could reach levels above 75~90 still.  These are incredible levels for the VIX.

WATCH VIDEO ANALYSIS


Stay tuned for more free info, but if you like what you read here and
watched then subscribe to the premium trading newsletter today and
get this information EVERY MORNING before the opening bell – CLICK HERE

Chris Vermeulen
Chief Market Strategist


TheTechnicalTraders.com


Fibonacci Retracements Analysis 09.03.2020 (GOLD, USDCHF)

Article By RoboForex.com

XAUUSD, “Gold vs US Dollar”

As we can see in the daily chart, the long-term trend was a little bit shy of reaching 76.0% fibo at 1708.10. after that, there was a divergence on MACD, which made the pair reverse and start falling. The key downside target may be 50.0% fibo at 1482.50.

GOLD_D1
Risk Warning: the result of previous trading operations do not guarantee the same results in the future

In the H4 chart, the correctional downtrend may be followed by a new rising wave. In this case, the upside targets may be above 76.0% fibo (1708.10) inside the post-correctional extension area between 138.2% and 161.8% fibo at 1736.80 and 1767.15 respectively.

GOLD_H4
Risk Warning: the result of previous trading operations do not guarantee the same results in the future

USDCHF, “US Dollar vs Swiss Franc”

As we can see in the daily chart, the long-term bearish trend continues. The pair is heading towards 38.2% and 50.0% fibo at 0.9094 and 0.8707 respectively. the resistance is the high at 1.0344.

USDCHF_D1
Risk Warning: the result of previous trading operations do not guarantee the same results in the future

In the H1 chart, the pair is quickly plunging towards 38.2% fibo at 0.9094.

USDCHF_H4

Article By RoboForex.com

Attention!
Forecasts presented in this section only reflect the author’s private opinion and should not be considered as guidance for trading. RoboForex LP bears no responsibility for trading results based on trading recommendations described in these analytical reviews.

Oil price war and coronavirus: global recession is almost inevitable

By George Prior

A global recession is now almost inevitable this year, warns the CEO of one of the world’s largest independent financial advisory and services organizations.

The warning from Nigel Green, chief executive and founder of deVere Group, comes as global stocks and government bond yields fell after oil prices plummeted by almost 30 per cent Monday.

He notes: “Oil’s sharpest one-day drop since the 1991 Gulf war has further fuelled the sell-off in global stock markets that started a couple of weeks ago on fears that coronavirus is going to severely damage economic growth.

“Every major stock market is getting hammered as oil prices plunge due to a price war following the breakdown of Saudi Arabia’s oil-cutting alliance with Russia over the weekend.”

He continues: “This is an issue that will not be resolved overnight and it can be expected to have far-reaching consequences.

“It comes as the world scrambles to deal with the market mayhem and economic fallout caused by the relentless global spread of coronavirus.

“With the combination of the implications of the oil stand-off and the outbreak, I now believe that it’s almost inevitable that there will be a global recession this year.”

Before the oil price drop, last week Mr Green noted: “The outbreak has already sent the stock market into bouts of volatility not seen since the 2008 financial crisis, severely disrupted global supply chains, shuttered factories, grounded flights, closed attractions and cancelled major events. Entire powerhouse cities in Asia and Europe are nearly shut down. Multinational companies have warned that coronavirus will severely hit profits. Workers are being evacuated and forced to work from home and to avoid travelling.

“We can see both supply and consumer demand are already being impacted in key sectors, such as travel and tourism, hospitality, manufacturing and retail, and it is going to extend to others.

“This scenario is then likely to feed on itself: a lack of consumer confidence and spending, lack of business investment, more job cuts, which means even less spending and demand, which leads to further job cuts.”

The deVere CEO affirms: “In times of increasing volatility, investors need to ensure that they remain in the markets with their suitably diversified portfolios – not only to safeguard their wealth, but to create and build it too.

“As ever, there will be winners and losers and savvy investors and their financial advisers will be eyeing the opportunities that fluctuations, panic-selling and mis-pricing generate, allowing them to revise and add high quality equities to their portfolios at lower prices.”

Mr Green concludes: “The ultimate impact that the oil price war will have on an already vulnerable world economy that’s struggling to cope with the spread of coronavirus remains unknown.

“However, the risk of a short but severe global recession in 2020 has now been heightened dramatically.”

About:

deVere Group is one of the world’s largest independent advisors of specialist global financial solutions to international, local mass affluent, and high-net-worth clients.  It has a network of more than 70 offices across the world, over 80,000 clients and $12bn under advisement.