Author Archive for InvestMacro – Page 75

The Fed’s surprise move on Sunday Makes Wednesday’s rate decision a non-event

By Admiral Markets

Economic Events

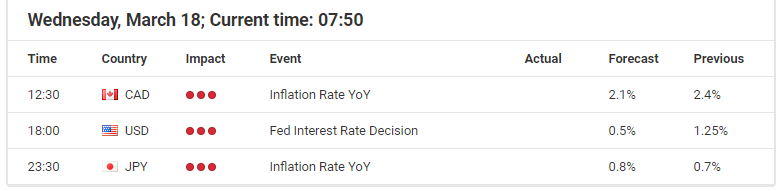
Source: Economic Events March 18, 2020 – Admiral Markets’ Forex Calendar

The state of Gold, given the recent developments around the Coronavirus, collapse in oil prices, and the massive monetary stimulus from the Fed last Sunday, is clearly bullish in the mid- to long-term. A run above 2,000 USD seems only a question of time, so the short-term picture stays way more complex.

On Sunday evening, the US central bank, the Fed, took a massive step: it cut rates to 0.0%-0.25%, launched a massive QE program of USD 700 billion, announced swap lines with global central banks to make sure that enough USD are available, and cut reserve ratios for banks to 0 in anticipation of today’s Fed rate decision. This potentially makes the event a ‘non-event’.

However, these extreme measures failed to lift the market. Equities and Gold dropped. Gold, usually a safe-haven by typically profiting from a dovish Fed and any US yield collapses, failed to gain momentum.

While we could certainly argue that this is a result out of the sharper bounce in US yields after its short-term drop below 0.3% over the last week, this seems only half the truth.

In fact, recent data from the Commitment of Traders Report underlines the point that the drop in Equities resulted in margin calls, which led larger market participants to reduce their Gold Long exposure to meet these.

In addition to this, traders should also recall the drop in Gold during the 2008 financial crisis, where a deflationary shock resulted out of the credit crunch which had a negative impact on the yellow metal with dropping and taking on momentum from 2010 onwards.

This time could be similar, meaning that despite elevated volatility and dropping US yields driven by risk-off tendencies, Gold may fail to profit and see a drop, going hand in hand with a dropping USD and dropping Equity prices.

While the mid- to long-term mode in Gold stays bullish, short-term a drop below 1,440/450 USD would technically darken the picture, activating 1,250/260 USD as a first target:

Gold Daily chart

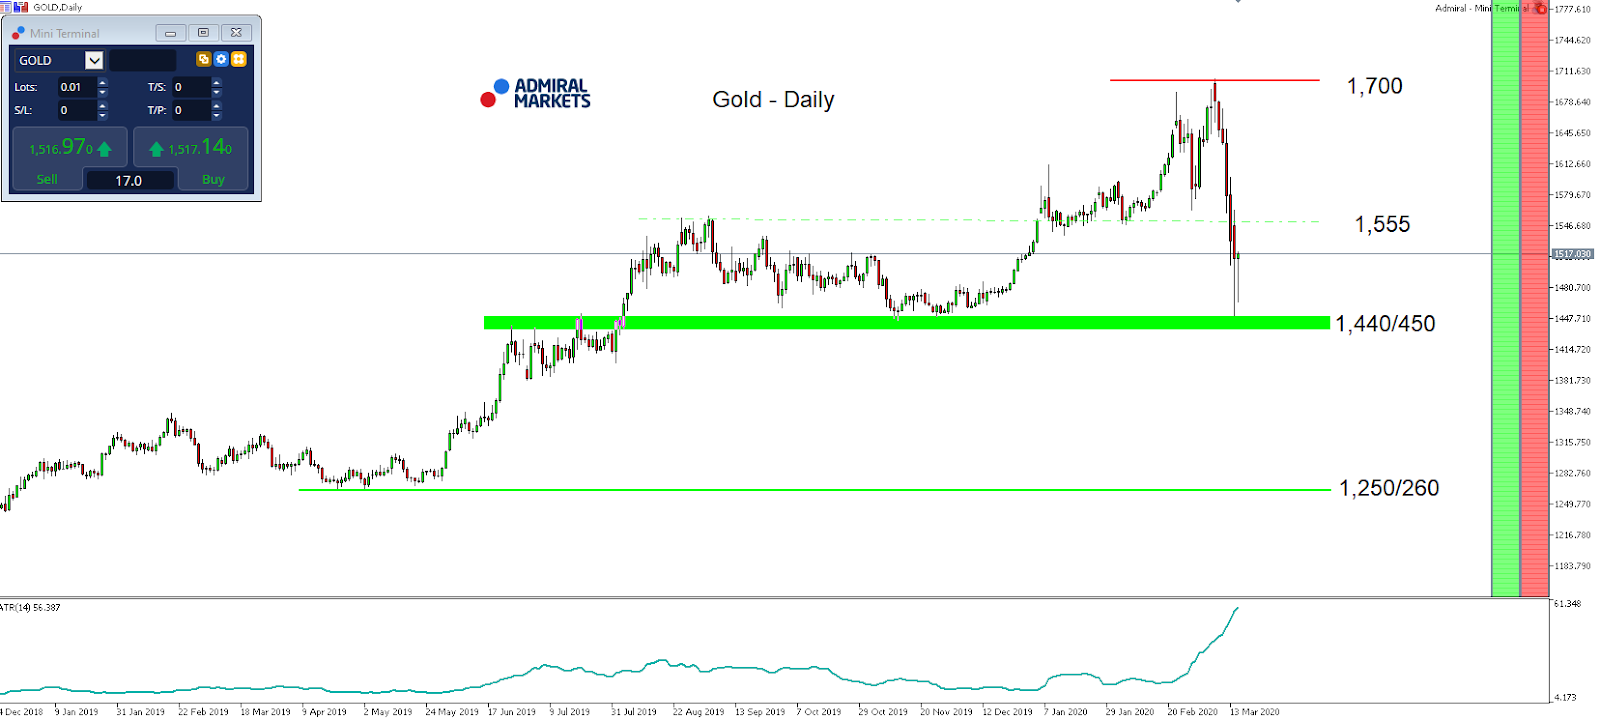
Source: Admiral Markets MT5 with MT5SE Add-on Gold Daily chart (between December 14, 2018, to March 17, 2020). Accessed: March 17, 2020, at 10:00 PM GMT – Please note: Past performance is not a reliable indicator of future results, or future performance.

In 2015, the value of Gold fell by 10.4%, in 2016, it increased by 8.1%, in 2017, it increased by 13.1%, in 2018, it fell by 1.6%, in 2019, it increased by 18.9%, meaning that after five years, it was up by 28%.

Discover the world’s #1 multi-asset platform

Admiral Markets offers professional traders the ability to trade with a custom, upgraded version of MetaTrader 5, allowing you to experience trading at a significantly higher, more rewarding level. Experience benefits such as the addition of the Market Heat Map, so you can compare various currency pairs to see which ones might be lucrative investments, access real-time trading data, and so much more. Click the banner below to start your FREE download of MT5 Supreme Edition!

Download MetaTrader 5 and begin trading today!

Disclaimer: The given data provides additional information regarding all analysis, estimates, prognosis, forecasts or other similar assessments or information (hereinafter “Analysis”) published on the website of Admiral Markets. Before making any investment decisions please pay close attention to the following:

  1. This is a marketing communication. The analysis is published for informative purposes only and are in no way to be construed as investment advice or recommendation. It has not been prepared in accordance with legal requirements designed to promote the independence of investment research, and that it is not subject to any prohibition on dealing ahead of the dissemination of investment research.
  2. Any investment decision is made by each client alone whereas Admiral Markets shall not be responsible for any loss or damage arising from any such decision, whether or not based on the Analysis.
  3. Each of the Analysis is prepared by an independent analyst (Jens Klatt, Professional Trader and Analyst, hereinafter “Author”) based on the Author’s personal estimations.
  4. To ensure that the interests of the clients would be protected and objectivity of the Analysis would not be damaged Admiral Markets has established relevant internal procedures for prevention and management of conflicts of interest.
  5. Whilst every reasonable effort is taken to ensure that all sources of the Analysis are reliable and that all information is presented, as much as possible, in an understandable, timely, precise and complete manner, Admiral Markets does not guarantee the accuracy or completeness of any information contained within the Analysis. The presented figures refer that refer to any past performance is not a reliable indicator of future results.
  6. The contents of the Analysis should not be construed as an express or implied promise, guarantee or implication by Admiral Markets that the client shall profit from the strategies therein or that losses in connection therewith may or shall be limited.
  7. Any kind of previous or modeled performance of financial instruments indicated within the Publication should not be construed as an express or implied promise, guarantee or implication by Admiral Markets for any future performance. The value of the financial instrument may both increase and decrease and the preservation of the asset value is not guaranteed.
  8. The projections included in the Analysis may be subject to additional fees, taxes or other charges, depending on the subject of the Publication. The price list applicable to the services provided by Admiral Markets is publicly available from the website of Admiral Markets.
  9. Leveraged products (including contracts for difference) are speculative in nature and may result in losses or profit. Before you start trading, you should make sure that you understand all the risks.

By Admiral Markets

EURUSD: bears aim to rekindle downward movement

By Alpari.com

On Tuesday, March 17, trading on the EURUSD pair was down at the close. The fall of the pair accelerated after the breakout from the level at 1.11. The level of 1.1060 also did nothing to stop the euro from weakening. The USD strengthened on all fronts, leaving no chance for a rebound. This came on the back of news that US Treasury Secretary Steven Mnuchin presented a package of measures worth $850bn. USD to Republican senators to help stimulate the economy.

At the end of the day, major US stock indexes rose from 5.2% to 6.2%. The S&P500 closed at 2529.19. The EURUSD pair fell to 1.0955.

Today’s news (GMT+3):                                       

  • 13:00 Eurozone: Consumer Price Index (MoM) (Feb), Trade Balance s.a. (Jan).
  • 15:30 Canada: BoC Consumer Price Index Core (YoY) (Feb).
  • 15:30 USA: Housing Starts (MoM) (Feb), Building Permits Change (Feb).
  • 17:30 USA: EIA Crude Oil Stocks Change (Mar 13).

1803Current situation:

On Tuesday, bears sold the euro at 1.1055. Bulls were not ready to meet them at this price, and so refused to buy back the proposed euros. As a result, the price went into the off-peak zone, below the D3 line. The price rebounded, but only recovered to 1.1045.

Today, futures for US indices dipped into negative territory by 3.5%. Yields on 10-year US bonds also fell 5%, to 1.028. The situation is ambiguous, since the USD continues to weaken due to a decrease in profitability, and technical analysis on the hourly TF indicates a continued decline to the level of 1.0900 or 1.0870.

There is no “bullish” divergence between AO and the current price and so therefore, bears dominate the market. Considering that yesterday, the price fell into the off-peak zone and is now being traded at the D3 line, the flat can drag on until it meets the balance line (Lb). I do not have a current forecast to work off, so I’ll reserve judgement until after the opening of the American session.

By Alpari.com

Part III – Crunching Some Numbers – Researcher Shares His Outlook

By TheTechnicalTraders – In this section of this multi-part research article related to the potential economic destruction of the Covid-19 virus event across the global markets (Part I, Part II).

We’re going to peer into data related to the GDP and other factors of the US economy.  Remember, the US economy is the largest single economy and consumption component in the world.  As we suggested in our earlier research, the US and China (combined) account for about 30% of the total global GDP each year.  The top 12+ GDP nations on the planet account for just under 80% of the total annual GDP for the globe.  What happens if economic activity and global GDP collapse for the next 24+ months because of the Covid-19 virus?

First, be sure to opt-in to our free market trend signals before closing this page, so you don’t miss our next special report!

The second thing we want to discuss is the real potential for economic interruption within the global markets.  As of today, the US has declared an emergency status and many states and cities have already started to shut down schools, sporting events, entertainment venues and many other aspects of the US economy.  Additionally, a travel ban has been set up in an attempt to prevent the spread of the Covid-19 virus and the potential of an uncontrolled global contagion.  We believe these travel restrictions will stay in place for at least 60+ days and we believe the spread of this virus will continue for at least another 45+ days before potentially “leveling off”.

The third thing we want to discuss is the economic fallout that is resulting from this Covid-19 event.  It has clearly become evident that exporting a large portion of our manufacturing capabilities to China and other nations puts the USA in a very dangerous situation.  China has threatened to withhold vital medical supplies and other items from the USA over the past few weeks as China attempts to blame the USA for initiating this virus event.  Simply put, America will not be held hostage by China under any circumstances.

Additionally, we believe other mature economies and nations are also starting to reconsider many policies and manufacturing processes related to this event.  Although we don’t have any real proof that this Covid-19 virus event originated in a Chinese lab in China, the very first instance of this virus was documented in China in November 2019 and didn’t really spread to any other country until well into 2020.  It makes perfect sense this Virus originated in China and spread throughout the Chinese New Year to other nations.

Debt and Banking capabilities become a real issue at times when consumers shift spending and economic habits.  Large sectors of the economy become “at-risk” very quickly.  The way our researchers put it is “isolated economic events may cause certain economic events to unfold, but extended economic events put greater pressure on even mostly healthy corporations and enterprises as lack of revenues and a shift in consumer activity can result in a broad market collapse”.

So, here we have the setup of the economic event and now we can speculate about the consequences.  Our researchers believe the immediate needs of all nations is to attempt to contain this virus event and to reconsider policies and manufacturing processes/locations to eliminate risks related to hostile countries.  Is it worth it to save a few pennies to manufacture something while putting your entire nation at risk when an event like this happens?

The funny thing about all major events, like this, is that usually cause people and nations to “shift gears”.  Remember after 9/11 how America shifted away from certain policies and came together to support our military against terrorists around the world?  Remember after the 2008-09 credit crisis how the US took immediate steps to attempt to prevent this type of financial event from happening again and how consumers were “shell-shocked” to re-enter the marketplace after the fallout?  This same type of social constriction happens all over the world as consumers/people act in a flock-mentality.

What do our researchers believe is the most likely outcome for Q1 and Q2 of 2020?

We took the past 73 years of quarterly US GDP data and attempted to run two rolling Standard Deviations on them.  The first, a 12 quarter (roughly three years) rolling Standard Deviation.  The second, a full 10-year rolling Standard Deviation.  The purpose of this was to determine how volatile past economic events have been related to these standard deviation ranges.

There have only been a few economic events that meet any of the criteria similar to the Covid-19 virus event.  The closest was the 2008-09 Credit Crisis.  All other events were isolated US types of events related to bubble events and Federal Reserve functions.

1957-1958: a collapse in GDP growth (below the 12 QTR StdDev) took place where GDP contracted by nearly 10 billion (-2%), then almost immediately rebounded back to 2x StdDev growth by 1959.

Mid 1960 to mid-1961: GDP growth collapsed to below 1x StdDev range, at one point almost stalling in Q1 1961, then immediately rebounded back to 2x StdDev growth by the end of 1961.

Q1 1982 to Q1 1983: GDP growth stalled to levels near 0.5 StdDev range for a period of 12 months before slowly rebounding back to 1x+ levels by late 1983 into 1984.

Q3 1990 to Q4 1991: GDP growth stalled to nearly 0.6 of the StdDev range, then rebounded back to 1.5x StdDev range by Q2 1992

Q4 2000 to Q3 2002: The Dot Com bubble and the 9/11 terrorist attacks resulted in an extended contraction in GDP expansion throughout this time.  By Q4 2001, GDP growth was only 0.53x the StdDev range.  Growth finally rebounded in late 2002.

Q1 2008 to Q1 2010: The Credit Crisis really took a toll on GDP.  Throughout most of 2008, GDP levels were still positive and above 0.5x the StdDev range.  Yet in Q3 2008, everything turned negative and GDP reached an extreme (-2.088x) StdDev range in Q3 2009.  Gdp rebounded back to 2x StdDev range in Q1 2010.

Q3 2015 to Q3 2016: This was an election year GDP contraction.  GDP continued to grow, but fell below the 1x StdDev range that seems to be very consistent.  Q4 2016 returned to levels above 1x StdDev.

What this shows us is that a -2x StdDev range is not uncommon and that a bigger move could take place with the right global economic setup.  A 3x or 4x GDP reversion (downside collapse) is also not out of the question if certain circumstances setup to present such an event.

In conclusion

This lengthy article and extensive research, our researchers do believe a 2x to 3x GDP reversion event is on the immediate horizon.  Given current data points and the fact that we’ve had little “transition” from previous growth phases to this potential new contraction phase, we believe the GDP contraction for Q1 2020 is likely going to be -10% or more from previous levels.  We believe Q2 GDP contraction may actually be higher (-12% or more).  This will be the result of China’s contracting and quarantining economy as well as the fallout from the continued spread of the Covid-19 virus throughout the rest of the world.

We believe Q4 2020 may result in a positive GDP quarter before further GDP contraction takes place in early 2021. We believe this will likely be the result of extended global economic malaise, global banking issues, global credit, and corporate earnings issues and the possibility that a global asset revaluation event may be taking place (similar to the 2008-09 Credit Crisis event).  This time, though, we believe it will be foreign markets engaging in a Credit Crisis and asset revaluation process that will drag the US economy into a 2021~2023 slump.

A 2x StdDev GDP event right now would be a collapse of $1.65T.  A 3x StdDev GDP event right now would be a collapse of $2.486T.  A 4x StdDev GDP event (God forbid), right now would be a collapse of $3.316T.  Remember, it is not really the size that matters – it is the length of time this contraction takes place.

Be prepared for some really ugly earnings data in Q1 an Q2 of this year, then we’ll figure out if our expectations were accurate or not and what we should be doing to plan going forward.

The type of market condition I think we have entered could be here for a long time, and it’s going to be a traders’ market, which means you must have a trading strategy, plan your trades, and trade your plan. It’s amazing how simple a few trading rules that are written down on paper can save you thousands of dollars a week or month from locking in gains or cutting losses.

I have this mini trading strategy mastery course if you want to take control of your trades and override your emotional issues. And also if you want to start making money from home which is the only option going forward the next 3-6 months from the looks of it my trading as a business program is something to think about doing.

– If you hold winners until they turn into losers

– Taking too large of a position and get stuck with a drawdown so large that if you close the position you will lose 10-50% of your trading account

– have mastered the art of buying high and selling low repeatedly?

All these things happen to most traders, and they can easily be overcome with a logical game plan I cover in the crash courses, pun intended ?

In short, if you have lost money with your trading account this year giving back years of gains, I think it’s worth joining my trading newsletter so you can stay on top of the markets and if you really want to excel take my mini-courses. I take the loud, emotional, and complex markets and deliver simple common sense commentary and a couple of winning trades each month for you to follow.

My trading is nothing extreme or crazy exciting because I’m not an adrenaline trading junky. I only want to grow my entire portfolio 2-4% a month with a couple of conservative ETF trades. Earning a 22%-48% return on my capital every year without the stress of being caught up in this type of market, and knowing I have a proven bear market trading strategy incase this market continues to fall is a comforting thought.

As a technical analysis and trader since 1997, I have been through a few bull/bear market cycles. I believe I have a good pulse on the market and timing key turning points for short-term swing traders.

Visit my ETF Wealth Building Newsletter and if you like what I offer, and ride my coattails as I navigate these financial markets and build wealth while others lose nearly everything they own during the next financial crisis.

Chris Vermeulen

TheTechnicalTraders.com


Japanese Candlesticks Analysis 17.03.2020 (USDCAD, AUDUSD, USDCHF)

Article By RoboForex.com

USDCAD, “US Dollar vs Canadian Dollar”

As we can see in the H4 chart, the pair continues growing and updating its highs; it has formed an Engulfing reversal pattern close to the resistance level. Right now, USDCAD is expected to start reversing; the downside target is at 1.3850. The current situation implies that after completing a pullback the price may resume growing towards 1.4090. At the same time, one shouldn’t exclude an opposite scenario, according to which the instrument may continue growing without forming a correction towards 1.3850.

USDCAD
Risk Warning: the result of previous trading operations do not guarantee the same results in the future

AUDUSD, “Australian Dollar vs US Dollar”

As we can see in the H4 chart, the pair continues the descending tendency. After completing a Hammer reversal pattern near the support level, AUDUSD is reversing. Later, the price may complete a correction at 0.6169 and then resume trading downwards. Still, the instrument may choose a different scenario and continue falling towards 0.5940 without any corrections.

AUDUSD
Risk Warning: the result of previous trading operations do not guarantee the same results in the future

USDCHF, “US Dollar vs Swiss Franc”

As we can see in the H4 chart, the pair is testing the descending channel’s upside border; by now, USDCHF has formed several reversal patterns, such as Shooting Star, near the resistance level. The current situation suggests that the pair may reverse and then continue the descending tendency with the target at 0.9243. However, one shouldn’t ignore another scenario, according to which the instrument may return to 0.9530.

USDCHF

Article By RoboForex.com

Attention!
Forecasts presented in this section only reflect the author’s private opinion and should not be considered as guidance for trading. RoboForex LP bears no responsibility for trading results based on trading recommendations described in these analytical reviews.

Ichimoku Cloud Analysis 17.03.2020 (BTCUSD, XAUUSD, NZDUSD)

Article By RoboForex.com

BTCUSD, “Bitcoin vs US Dollar”

BTCUSD is trading at 5273.00; the instrument is moving below Ichimoku Cloud, thus indicating a descending tendency. The markets could indicate that the price may test the cloud’s downside border at 5445.00 and then resume moving downwards to reach 2655.00. Another signal to confirm further descending movement is the price’s rebounding from the descending channel’s upside border. However, the scenario that implies further decline may be canceled if the price breaks the cloud’s upside border and fixes above 6825.00. In this case, the pair may continue growing towards 7605.00. After breaking the Triangle’s downside border and fixing below 3865.00, the price may resume moving downwards.

BITCOIN
Risk Warning: the result of previous trading operations do not guarantee the same results in the future

XAUUSD, “Gold vs US Dollar”

XAUUSD is trading at 1487.00; the instrument is moving below Ichimoku Cloud, thus indicating a descending tendency. The markets could indicate that the price may test Tenkan-Sen and Kijun-Sen at 1505.00 and then resume moving downwards to reach 1375.00. Another signal to confirm further descending movement is the price’s rebounding from the rising channel’s downside border. However, the scenario that implies further decline may be canceled if the price breaks the cloud’s upside border and fixes above 1555.00. In this case, the pair may continue growing towards 1605.00.

GOLD
Risk Warning: the result of previous trading operations do not guarantee the same results in the future

NZDUSD, “New Zealand Dollar vs US Dollar”

NZDUSD is trading at 0.6029; the instrument is moving below Ichimoku Cloud, thus indicating a descending tendency. The markets could indicate that the price may test the cloud’s downside border at 0.6045 and then resume moving downwards to reach 0.5875. Another signal to confirm further descending movement is the price’s rebounding from the descending channel’s upside border. However, the scenario that implies further decline may be canceled if the price breaks the cloud’s upside border and fixes above 0.6155. In this case, the pair may continue growing towards 0.6225.

NZDUSD

Article By RoboForex.com

Attention!
Forecasts presented in this section only reflect the author’s private opinion and should not be considered as guidance for trading. RoboForex LP bears no responsibility for trading results based on trading recommendations described in these analytical reviews.

deVere launches Contactless Advice service amid coronavirus outbreak

By George Prior

One of the world’s largest independent financial advisory organisations is offering free financial advice to anyone in the world on a remote basis as social distancing is universally embraced as the best tool to fight coronavirus.

deVere Group, which operates in more than 100 countries worldwide, is launching its Contactless Advice service with immediate effect.

The chief executive and founder of the $12bn organisation, Nigel Green, says: “We are launching Contactless Advice now – which is an industry first – for four clear reasons.

“First, social distancing is currently the only tool available to fight the spread of the coronavirus. As such, more and more cities, regions and countries are going into lockdown and people into enforced or self-imposed isolation to help fight Covid-19. This means that they might not be able to see their financial adviser face-to-face as they do ordinarily.

“And second, the economic landscape is shifting. The global economy is facing a short and deep recession. As always, new industries will emerge and, of course, there will be winners and losers in terms of sectors, jobs and wages – and this will, naturally, directly impact people’s finances.

“Third, we’re moving towards an era of negative interest rates, which will affect people’s investment decisions, amongst other financial matters.

“And fourth because the ongoing volatility will present challenges that will need attention, but also major – perhaps once-in-a-generation – buying possibilities and ways to shore-up your retirement income.

“Against this backdrop, in order to create, build-up and safeguard their wealth as the world adapts to a new era, investors should be revising their portfolios to ensure they mitigate risk and take advantage of the opportunities.”

He adds: “Using a combination of existing technology, and our industry-leading applications, we’re able to offer unparalleled financial advice from the comfort of your home.

“In these trying times we must all play our part, by removing physical interactions from our services, you can have peace of mind that your health, and your wealth will remain secure.

“The free Contactless Advice service will include a wealth scan in which you and your professional adviser will discuss your financial objectives and answer any questions you may have; a fact find in which your adviser will discuss your current financial situation with you; and a customised report which your adviser will analyse and discuss with you and outline your recommended next steps, if any are needed.

“Moving forward, using our pioneering app, you’ll be able to track your entire portfolio and financial strategy in real time and book an e-meeting with your adviser, should you have any queries.”

The deVere CEO adds: “The world is changing fast and a short coronavirus-triggered global recession and the subsequent recovery will have lasting and far-reaching consequences for people’s wealth.

“Experts agree that very seldom is it a good idea to take a DIY-approach to something so fundamental to your life as your finances. With the financial and economic landscape shifting and evolving so rapidly, this, I suggest, is certainly not the time.

“With this free service that offers professional, independent advice, there’s no need to do that.”

Mr Green concludes: “The ground-breaking Contactless Advice is designed for today’s world and with client experience and outcome expectations front and centre.”

The content of this publication is for information purposes and should not be treated as a forecast, research or advice to buy or sell any particular investment or to adopt any investment strategy.  It does not provide personal advice based on an assessment of your own circumstances.  Any views expressed are based on information received from a variety of sources which we believe to be reliable, but are not guaranteed as to accuracy or completeness. Any expressions of opinion are subject to change without notice.

Past performance is not a reliable indicator of future results. Investing involves risk and the value of investments, and the income from them, may fall as well as rise and are not guaranteed. Investors may not get back the original amount invested.

About:

deVere Group is one of the world’s largest independent advisors of specialist global financial solutions to international, local mass affluent, and high-net-worth clients.  It has a network of more than 70 offices across the world, over 80,000 clients and $12bn under advisement.

The Analytical Overview of the Main Currency Pairs on 2020.03.17

by JustForex

The EUR/USD currency pair

Technical indicators of the currency pair:
  • Prev Open: 1.10831
  • Open: 1.11783
  • % chg. over the last day: +0.47
  • Day’s range: 1.11021 – 1.11981
  • 52 wk range: 1.0879 – 1.1572

The EUR/USD currency pair is in sideways movement. There is no defined trend. Investors continue to assess the risks of further spread of the COVID-19 virus and its impact on the global economy. On Monday, the U.S. Presidential Administration urged the Senate to urgently support the Coronavirus Bill approved by the House of Representatives. Earlier, the U.S. Federal Reserve has urgently reduced the key interest rate range to 0-0.25%. At the moment the key levels of support and resistance are at 1.10700 and 1.11850, respectively. The trading instrument can descend further. Open positions from key levels.

The Economic News Feed for 17.03.2020:

  • – ZEW Economic Sentiment Index in Germany – 12:00 (GMT+2:00);
  • – US retail sales – 14:30 (GMT+2:00);
  • – Job Openings and Labor Turnover Survey (JOLTS) – 16:00 (GMT+2:00).
EUR/USD

Indicators do not give accurate signals: the price has crossed 50 MA.

MACD histogram is near the 0 mark.

The Stochastic Oscillator is located in the oversold area, the %K line is below the %D line, which gives a weak sell signal for EUR/USD.

Trading recommendations
  • Support levels: 1.10700, 1.10000
  • Resistance levels: 1.11850, 1.12350, 1.13250

If the price fixes below 1.10700, expect the quotes to fall toward 1.10000.

Alternatively, the quotes could grow toward 1.12500-1.13000.

The GBP/USD currency pair

Technical indicators of the currency pair:
  • Prev Open: 1.24085
  • Open: 1.25688
  • % chg. over the last day: -1.06
  • Day’s range: 1.21747 – 1.22723
  • 52 wk range: 1.1959 – 1.3516

The GBP/USD currency pair still shows a steady downtrend. The pound has renewed the key lows. At the moment, GBP/USD is testing the level of 1.21750. The round level 1.23000 is the nearest resistance. The trading instrument has potential for further decline. We recommend you to keep track of the current information about the COVID-19 virus spread. Open positions from key levels.

At 11:30 (GMT+2:00) the UK labor market report will be published.

GBP/USD

The indicators signal the sellers’ power: the price has fixed below 50 MA and 100 MA.

The MACD histogram is in the negative zone, which indicates a bearish sentiment.

The Stochastic Oscillator is located in the oversold area, the %K line crossed the %D line. There are no signals at the moment.

Trading recommendations
  • Support levels: 1.21750, 1.21000
  • Resistance levels: 1.23000, 1.24250, 1.25200

f the price fixes below 1.21750, expect the quotes to fall toward 1.21000.

Alternatively, the quotes could correct toward 1.24000-1.25000.

Open Account

The USD/CAD currency pair

Technical indicators of the currency pair:
  • Prev Open: 1.37394
  • Open: 1.40007
  • % chg. over the last day: +1.60
  • Day’s range: 1.39607 – 1.40787
  • 52 wk range: 1.2949 – 1.4079

USD/CAD quotes moved up again after a long consolidation. The trading instrument has updated its multi-year highs. The CAD remains under pressure amid the negative dynamics of black gold prices. At the moment local support and resistance levels are at 1.39600 and 1.40750, respectively. The trading instrument can grow further. Open positions from key levels.

The publication of important economic releases from Canada is not planned.

USD/CAD

The indicators signal the power of buyers: the price has fixed above 50 MA and 100 MA.

MACD histogram is in the positive zone, which indicates a bullish sentiment.

The Stochastic Oscillator is located near the overbought zone, the %K line is above the %D line, which gives a weak signal to buy USD/CAD.

Trading recommendations
  • Support levels: 1.39600, 1.37900, 1.37100
  • Resistance levels: 1.40750, 1.41500

If the price fixes above 1.40750, expect the quotes to grow toward 1.41500-1.42000.

Alternatively, the quotes could correct toward 1.38700-1.38200.

The USD/JPY currency pair

Technical indicators of the currency pair:
  • Prev Open: 107.304
  • Open: 105.877
  • % chg. over the last day: -1.33
  • Day’s range: 105.866 – 107.188
  • 52 wk range: 101.19 – 112.41

The USD/JPY currency pair has an ambiguous technical pattern. The trading instrument is in sideways movement. There is no defined trend. USD/JPY quotes are testing local support and resistance levels at 105.700 and 107.000, respectively. Investors are waiting for additional drivers. Today we recommend you to pay attention to economic reports from the USA and open positions from key levels.

The Economic News Feed for 17.03.2020 is calm.

USD/JPY

Indicators do not give accurate signals: the price has crossed 50 MA.

MACD histogram is near the 0 mark.

The Stochastic Oscillator is located in the neutral zone, the %K line has crossed the %D line. There are no signals at the moment.

Trading recommendations
  • Support levels: 105.700, 104.550, 103.300.
  • Resistance levels: 107.000, 108.400

If the price fixes above 107.000, expect the quotes to rise toward 108.200-109.000.

Alternatively, the quotes could descend toward 105.000-104.000.

by JustForex

EURUSD: consolidation inside the flat expected

By Alpari.com

On Monday, March 16, trading on the euro ended with an increase of 0.69%. The daily candle closed at 1.1180. During the day, the pair showed multidirectional dynamics against the backdrop of various global events.

The market opened with growth amid a decision by the US Federal Reserve to cut rates by 100 bp, to the level of 0.0%-0.25%. The general weakening of the dollar and falling stock indices supported the euro throughout the day.

Major US stock indices fell at the close trading by 11% -12%. The index of business activity in New York came out significantly below the forecast, trading in the negative zone. Markets remain in disarray due to the easing of monetary policies by central banks, as well as the rapid spread of the new coronavirus outside of China.

Today’s news (GMT +3):

  • 12:30 UK: ILO Unemployment Rate (3M) (Jan), Average Earnings Including Bonus (3Mo/Yr) (Jan).
  • 13:00 Germany: aZEW Survey – Economic Sentiment (Mar).
  • 15:30 Canada: Canadian Portfolio Investment in Foreign Securities (Jan), Manufacturing Sales (MoM) (Jan).
  • 15:30 USA: G7 Call on Coronavirus.
  • 16:15 USA: Industrial Production (MoM) (Feb).
  • 17:00 USA: NAHB Housing Market Index (Mar).

1703Current situation:

According to the wave structure expected movement in prices were justified. Since there were more negative factors against the US currency, the price path turned out to be higher than laid out in the forecast scenario.

The price is currently trading near the balance line (Lb). Given that futures for US indices are trading in positive territory at 3.7%, it can be assumed that European indices will also grow after the market opens. This means that the euro will be under pressure at the beginning of the session, and in the American session, we can consider a recovery to 1.1225 along the upper-line of the channel.

Naturally, the focus is on coronavirus and its effects on the global economy. From the news, it is worth highlighting the forthcoming report covering the US labour market.

By Alpari.com

Crunching Some Numbers – Our Researchers Share Their Data – Part II

By TheTechnicalTradersContinuing our earlier multi-part research post related to our extensive number crunching and predictive modeling systems expectations going forward many years, (Part I) this second part will highlight some existing data points and start to discuss the concepts of what the Covid-19 virus event may do to the immediate global economy.  Remember, in the first part of this article, we shared research related to the US Fed Funds Rate (FFR) and how the Covid-19 virus event may create an environment of economic malaise over the next 12 to 24+ months as well as potentially disrupt the population and deficits over a 5+ year span.

This type of event is very similar to war (think WWII) in the sense that consumer spending changes, population growth, and levels change, GDP changes and deficits change for all involved.  Our researchers modeled the GDP levels from 2017 will now with the intent of attempting to identify probable outcomes of GDP output throughout the world over the next 5+ years.  Throughout these types of events, a massive capital shift takes place where consumers within areas impacted by war shift their spending and purchasing habits to address the immediate real needs of their attempted survival.  Speculation vanishes.  People only spend on things they are confident they can afford to risk their money on.  Anyone who is able to take advantage of the displaced or disparaged has a real opportunity to create some real gains if they don’t become the next displaced or disparaged individual.

Here is some data we used to model what we believe will happen over the next 2 to 5+ years as a result of the Covid-19 virus event.  We are using this global data as a basis for our modeling going forward and attempting to align 2018 and 2019 data with that reported by the St. Louis Federal Reserve data.  Our objective is to attempt to identify the scope and extend of any potential change in economic cycles going forward and to prepare our friends and followers of what to expect.

This data illustrates the scale and scope of the total global GDP output of all the nations on the planet for 2017.  It is important to understand that China and the United States are the two biggest GDP producers of all nations.  Between the US and China, both nations produce roughly 40% of the world’s total GDP annually.  When you consider all nations producing more than $1.5T in annual GDP on this graphic, these 12+ nations (including OTHERS) produce nearly 78% of the world’s total GDP annually.

The nations that make up this list of top GDP producing nations are:

These nations (and the group of nations listed as OTHERS) total almost 80% of total annual GDP across the entire planet.  Keeping in mind that we are attempting to model the Covid-19 virus event, which nations are likely to be the hardest hit on this list?  Obviously China, Japan, Germany, Italy, South Korea, and the United States are all prime targets of the Covid-19 virus event.  Brazil, Canada, France, India, and Others are secondary targets for GDP disruption.  Yet, their proximity to the price candidates makes them fairly easy targets for future GDP disruption related to the Covid-19 virus.

The point we are trying to make by illustrating this is that 80% of the world’s total GDP is at risk over the next 24+ months related to shifting consumer spending, central bank activities, asset valuation levels and much more.  We’re not talking about 4% or 5% of the world – we’re clearly showing you that 80% of the world’s total economic output is within the cross-hairs of this virus event.

Be sure to opt-in to our free market trend signals before closing this page, so you don’t miss our next special report!

Our modeling suggests the 2017 GDP levels presented by the image (above) and the subsequent yearly REAL GDP levels presented by the St. Louis Federal Reserve deliver this data as a basis for our modeling system.

Our attempted modeling of the Covid-19 virus event across global economies is based, in part, on what happened in the 2008-09 Credit Crisis event.  Throughout that span of time (2008 to 2009), US GDP fell -3.36% over 12 to 16 months.  The difference between this Credit Crisis event and the Covid-19 event is that the Covid-19 event appears to be disrupting a broader segment of economic sectors across dozens of nations/cities all at once.  Whereas the Credit Crisis event resulted in somewhat isolated asset and economic contractions related to banking, insurance, credit, and assets – the Covid-19 virus event appears to be much broader in scope and consequences.  Our researchers believe the Covid-19 virus event will reach nearly every segment of the global economy in some way or form – causing some type of economic disruption either in supply, demand or overall consumer activity related to the sector/economic component.  Therefore, we believe the scope of the contagion event related to Covid-19 will be, at a minimum, 2x to 3x the scale and scope of the Credit Crisis.

We’ve come to the conclusion that the disruption to earnings, revenues, expenses and other economic factors across a broad spectrum of global economic outputs may look something like this.

We believe Q1 and Q2 of this year will be a disaster for almost all nations.  We believe there is a chance Q3 and Q4 2020 may see a moderately strong recovery (or the start of a recovery).  We believe winter 2020 and into 2021 may bring further influenza type illness and may begin the process anew.  Or, we believe the recovery process may be somewhat stalled in 2021 as we believe the fallout from the previous year may still be taking place across multiple asset classes and corporate level and banking/insurance level industries.  We believe that by mid-2022 and early 2023, the global economy will begin to find a solid foundation for future economic growth and that global GDP may begin to move higher overall.

We are basing our modeling process on the information we have gained from our experience in the markets and from living through the 2008-09 Credit Crisis event.  Far too many people fail to understand the contagion event process that takes place when consumers abandon traditional spending patterns as income levels become more “at-risk”.  As we’ve suggested many times in previous articles, consumer spending and the “flock mentality” is not something to underestimate.  Current GDP levels are calculated mostly by consumer spending activity.  Think about what that means going forward.

Here are some St. Louis Federal Reserve data charts that we used in attempting to model these results.

A potential further decrease in M2 (velocity of money) throughout this Covid-19 virus event is very likely.  This is one of the primary reasons we believe this event may last more than 24 months in total span.  We believe the continued decline of the M2 velocity level is a very strong indication that historical levels of economic activity (1965 through 1995) simply are not present in today’s global economic world.  This complicates how money is used within the global market – it is being engaged as active money transactions by a -30% ration than 1995 levels. If M2 continues to decline, we believe the consequence of this move will relate to an even slower recovery from the Covid-19 virus event.

In the next part of this article, we’ll explore the real data points and outlier expectations of the 2020 Covid-19 virus event.

As a technical analysis and trader since 1997, I have been through a few bull/bear market cycles. I believe I have a good pulse on the market and timing key turning points for short-term swing traders.

Visit my ETF Wealth Building Newsletter and if you like what I offer, and ride my coattails as I navigate these financial markets and build wealth while others lose nearly everything they own during the next financial crisis.

Chris Vermeulen

TheTechnicalTraders.com


A Cryptocurrency that goes up in value along with Coronavirus

By ForexNewsNow

It’s now been over 2 months since Coronavirus was officially announced to the global public, and since then it has been absolute chaos all around the world. Over 92,000 cases have been confirmed worldwide as of this writing, with at least 3,200 deaths. The bulk of the infected is in China, where the virus originated from, with Iran being the second.

Panic and fear have overtaken everyone’s minds, resulting in irrationality and division among people. Some of the countries have completely shut down government services like schools, universities, and kindergartens. In China, where the virus originated from, a greater part of the economy is effectively put on a halt.

Needless to say, this all will have – and already has – major effects on the global economy. Experts estimate that global economic growth will suffer by at least 0.3%; possibly way more.  China’s economy accounts for around 17% of the global GDP today, so this is to be expected. At the end of February, Dow Jones dropped by almost 1200 points, the largest single drop in history.

Companies are also feeling very apprehensive due to the virus. On their earnings calls the previous month, Coronavirus was mentioned dozens of times, pointing at the level of seriousness that these companies attribute to the matter. Giant global companies like Under Armour, Tesla and Starbucks have all reported significant drops in projected earnings, and are estimating continued drops for the foreseeable future.

Similar cases have been mentioned in the crypto industry as well. Due to everybody expecting COVID-19 to cause a serious rise in Bitcoin’s valuation due to the distrust of the traditional stock market, thousands of traders started to hodl all of their assets. However, there were some very weird cases of traders starting to sell off their portfolio in anticipation of a big drop due to the virus which was considered quite foreign. However, according to Bitcoin Revolution, an AI trading robot company, their customer base for some reason started to immediately deactivate their accounts in order to prevent anymore scalping. Needless to say, those traders were right as BTC plummeted all the way down to $3,400. However, now that the coin is down, it’s like the crypto industry is reviving itself once again, thousands of traders have contacted Bitcoin Revolution in order to get started now as information was spread about the decision beforehand.

This “revival” has also shown us some strange anomalies with crypto as well.

Economic Anomalies from Coronavirus

With such a hectic turn of events all around the world, it didn’t take too long for some extraordinary and bizarre economic events to take place. One such example is Coronacoin – a cryptocurrency that was recently developed by programmers from the 4Chan community. It tracks and monitors all the cases and deaths from COVID-19 over the globe and adjusts its value accordingly. According to the coin’s website, the currency’s supply is based on the total population of the world, and a token is burned once every 48 hours, based on the infections + fatalities.

As the fatalities increase from the virus, the coin’s amount decreases, thus increasing in value. The situation is quite extraordinary, to the point of seeming like a satire. Some members of the community have made some bizarre posts titled “bet on the coronavirus pandemic by investing in this coin. The further it spreads, the more valuable it becomes”.

The company behind the coin proudly boasts that it’s the first crypto that is backed by proof of death. The developers of the currency claim that it offers an interesting and unique way to track and monitor the spread of the virus.

The endeavor was met with a mixed bag of reactions. Naturally, some of the people have opposed it vehemently, stating that the team should be ashamed for “playing on people’s lives”, while others are thankful for any opportunity to bring awareness to the virus. The virus is spreading fast, and some argue that the media is not doing enough to bring as much awareness to it as needed, and this can be of help.

Whatever the people may be thinking, according to Sunny Kemp, one of the developers behind this, the project is, at least to some extent, altruistic; as the parts of the earnings will be going towards charity. To be exact, 20 percent of the total amount of the coin will be donated towards the Red Cross. According to Kemp, their goal is to increase awareness of the virus and help fight it. Kemp added, that they’re in talks with a biochemist who’s currently working on a cure of the virus.

By ForexNewsNow