The US Federal Reserve, in another emergency move, cut interest rates by a full 100 basis points on Sunday, 15th March.
The central bank also announced a restart of its quantitative easing program.
According to the new QE, the Fed pledged to buy up to $700 billion in asset purchases which include Treasuries and mortgage-backed securities ($500bn of Treasuries and $200bn of mortgage-backed securities).
The central bank also cut the emergency lending rate at the discount window for financial institutions by 125 basis points to 0.25%. Additionally, it increased the length of the loans to a period of 90 days.
The move comes ahead of the Fed meeting due this week, though investors had been hoping that the rate cut would come during the FOMC meeting.
This is the second “emergency move” from the central bank in 2 weeks. The decision came as the Fed said that the financial markets were facing a heavy disruption.
The bank has also been under pressure from President Trump who has long been calling for lower interest rates.
Any More Surprises to Expect from the FOMC?
With most of the big decisions already made, the scheduled FOMC meeting is only likely to see the Fed trying to calm the markets. The meeting will be accompanied by the dot plot, as well as the quarterly rate projections.
Fed Chair Powell’s press conference is also likely to be used to explain the Fed’s stance to the markets.
The way things stand, it looks like that the Fed has already opened the taps for liquidity. However, it is a bit too early to tell.
Following the announcement on Sunday, equity futures initially reacted by selling. Dow futures fell sharply, triggering the limit down rules in the markets to halt trading temporarily.
At one point, the Fed’s balance sheet rose to $4.5 trillion by early 2015 which was projected to be about a quarter of the US GDP. However, since then, the Fed’s unwinding program brought the balance sheet down to $3.8 trillion. This is about 18% of the US GDP.
Thus, while the initial announcement of the Fed’s QE purchases seems a bit small, there is a lot of room for the Fed to ramp up its asset purchases.
One of the main reasons behind the Fed’s move is the increase in the number of people affected by COVID-19 in recent weeks.
Fresh data from China at the start of this week painted a grim picture.
Industrial production fell to the lowest levels ever, and expectations are for about 5 million people to lose their jobs.
Meanwhile, the United States can expect to see the extent of the disruption caused by the pandemic in a few weeks’ time.
What to Look for at the FOMC Meeting
Given that the Fed has already signaled its policy decisions, investors will be focusing on the economic projections. As of December 2019, the Fed had been looking at a GDP growth rate of 1% – 2%.
Thus, the prospects of a recession look dire at this point. Forecasts were for inflation to be around 1.8% – 1.9% for this year. Given how the situation evolves, it wouldn’t be surprising to see inflation overshooting the Fed’s target levels.
For the moment, the main focus will be on cushioning the blow from the pandemic.
While it is still early days, expect the Fed to continue to remain on the forefront of battling the crisis.
By Dan Steinbock – Despite China’s success in containment, the novel coronavirus is exploding outside China, due to complacency and inadequate preparedness. The impending contraction will compound human risks and economic damage.
Although the epicenter of the outbreak is now Europe, only a few major economies have launched effective battles against the virus. Hence, the rising levels of imported cases in the borders of China and the rest of Asia.
Since complacency and inadequate preparedness prevailed outside China until recently, the consequent global pandemic casts a dark shadow over the global economy. It, too, shall pass, but only with effective global cooperation.
Extended economic impact outside China
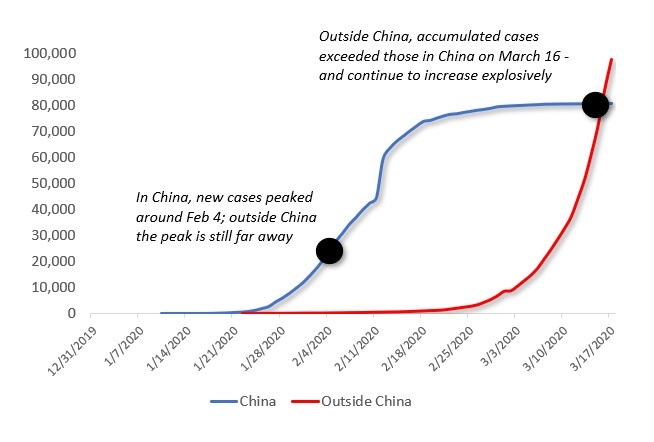
With the novel coronavirus (Covid-19), the number of accumulated confirmed cases worldwide is exceeding 200,000 people. But in the absence of adequate testing, even these official figures are just the tip of the iceberg.
In China, the turnaround came a month after the first novel coronavirus cases were diagnosed, thanks to strong containment measures. But outside China, the first cases were reported after mid-January and they continue to accelerate and now exceed those in China (Figure).
Figure Accumulated confirmed cases in and outside China (until March 16)
Source: WHO, China National Health Commission, Difference Group
In China, the impact of the coronavirus could ease in April. But outside China, epidemiologists currently anticipate a peak around June. If that’s the case, economic damage in China would be largely limited to the first quarter, but international economic damage would endure well into the second quarter.
Assuming the rise in new imported cases in China and elsewhere can be kept down, even this relatively benign scenario would mean adverse repercussions on the world economy.
After mid-January, I projected three probable virus impact scenarios, which can now be reassessed. In the “SARS-like impact” scenario, a sharp quarterly effect, accounting for much of the damage, would be followed by a rebound. The broader impact would be relatively low and regional. That is no longer in the cards, however.
In the “extended impact” scenario, the adverse impact would last two quarters. The broader impact would be more severe and have an effect on global prospects. That’s where the world economy is now heading to.
In the “accelerated impact” scenario, adverse damage would be steeper and even broader with serious consequences on the global economy. If the containment measures continue to fail outside China, this scenario would ensue.
In early March, the International Monetary Fund (IMF) projected global growth to fall 0.1 percentage points from the expected 3.3%. The estimate was too optimistic. Global growth could drop to 2.4 percent in 2020 – or worse, if infection rates continue to rise.
Contraction, stagnation, debt in advanced economies
Before the virus, quarterly growth in the Eurozone was 0.1 percent; the weakest in seven years. Now things will get worse. German GDP will continue to stall, France and Italy will remain in contraction. In the UK, annualized growth is likely to fall from 1 percent by another 0.2 percent and more. In Spain, soaring coronavirus cases will reverse the growth pickup. With debt at 135 percent of its GDP, Italy will be particularly vulnerable in 2020.
If the virus cases continue to increase in the Eurozone, regional growth could halve to 0.5 percent or worse.
In North America, local transmissions are on rapid rise, yet local testing is badly lagging. Despite greater awareness of the coronavirus and weeks of time to prepare, politization replaced mobilization, coupled with a series of missteps, including faulty and belated local testing, failures in evacuations and quarantines, lax enforcement and monitoring of self-quarantines.
Recently, the IMF projected US growth to suffer a slowdown from 2.0 to 1.6 percent. But the estimate is too optimistic. After the White House’s delays of outbreak management, the Fed cut interest rates close to zero, coupled with a new round of $700 billion for quantitative easing.
In the short-term, the move is understandable. But in the long-term, it compounds new risks. As the US national debt now exceeds $23.5 trillion (107.3% of GDP), Washington’s debt burden is at par with Italy just before its 2010 European Union (EU) sovereign debt crisis.
Moreover, the Fed’s rate cut is likely to be coupled with fiscal stimulus, which may still not suffice. Yet central banks in Europe, the UK and Japan will follow the US footprints into more monetary and fiscal accommodation. But that is likely to fail to quell virus fears, if infection rates continue to soar.
Prior to the coronavirus, Japanese growth contracted 0.7 percent in the 4th quarter of 2019. After last fall’s consumption tax and the consequent economic turmoil, contraction prevailed in January, while great uncertainty overshadows the 2020 Olympics. And Japan’s sovereign debt is already 2.4 times bigger than its economy.
In addition to Japan and South Korea, the rest of Asia’s advanced economies are in or almost in recession, including Australia and the regional financial hubs Singapore and Hong Kong. Since these countries are significant investors in Southeast Asia, their challenges will reverberate across emerging Asia.
Early damage limited in emerging economies, risks rising
In Southeast Asia, the expected 5 percent growth is now history. Even countries that have strong structural growth potential, including Indonesia, Vietnam and the Philippines, are not immune to indirect short-term hits as their trade, investment, migration and remittance flows depend on international environment.
The same goes for South Asia, particularly India, Pakistan and Bangladesh. In India, the growth rate in the past two years has decelerated from 7.7 percent to 4.7 percent in January. The impact of the global pandemic will compound such threats.
Before the crisis, Chinese economy was still benefiting from a mild recovery. Recently, the IMF anticipated China’s growth below 5.6 percent. US analysts anticipate baseline growth of less than 5%, with significant downside risk. However, if China can limit the adverse impact mainly to the first quarter of this year, a variation of the rebound story is still possible.
The real risk in China and other large emerging economies is the potential negative feedback effect from the world economy in the second quarter. While virus cases have so far been low in Russia, it will be penalized by oil prices, just as Brazil’s growth has been harmed by the fall of commodities.
In the Middle East, too, virus cases are climbing, from the Gulf to Egypt and Northern Africa’s Maghreb economies. In Iran, US withdrawal from the nuclear deal and incessant efforts at destabilization have been accompanied by a severe outbreak of the novel coronavirus, which will cause further economic erosion.
Sub-Saharan Africa is already struggling with a lingering Ebola crisis in the West and locust plagues in the East. Official virus cases are still low (South Africa, Nigeria, Senegal), but tests have only begun. In simulations, the highest importation risk involves countries (South Africa) that have moderate to high capacity to respond to outbreaks, whereas countries at moderate risk (Nigeria, Ethiopia, Sudan, Angola, Tanzania, Ghana, and Kenya) have variable capacity and high vulnerability.
Seizing opportunities and avoiding risks
If the current downside scenarios were to materialize, the net effect could mean a $2 trillion shortfall in global income. That would penalize developing economies (excl. China) by some $220 billion or more.
In such scenarios, oil exporters would be hit the worst. In the past two months, crude oil prices have halved to less than $30; $10 below the 2008 crisis plunge. While commodity exporters could lose over 1 percentage point of growth, along with those with trade exposure to the most affected economies. The misguided and badly timed oil price war will further compound the erosion.
In developing economies with weaker health systems, endemic poverty and social instability could result in a secondary epidemic with potential global impact. In this crisis, the world economy is only as strong as its most fragile links.
What is really needed is multipolar cooperation among major economies and across political differences. In this quest, China, where containment measures have been successful, can show the way, along with major advanced and large emerging powers.
About the Author:
Dr. Dan Steinbock is an internationally recognized strategist of the multipolar world and the founder of Difference Group. He has served at the India, China and America Institute (USA), Shanghai Institutes for International Studies (China) and the EU Center (Singapore). For more, see https://www.differencegroup.net
A version of the commentary was released by China Daily on March 18, 2020
The UK government’s economic strategy to combat the impact of Covid-19 might need a rethink, warns the CEO of one of the world’s largest independent financial advisory organizations.
The warning from Nigel Green, the chief executive and founder of deVere Group, comes as government bonds appear in crisis mode and as the British pound dropped below $1.20 to hit multi-decade lows in a rush into cash.
Mr Green says: “The UK government’s response of a £330bn ‘war chest’ package sounds impressive and has generated positive headlines.
“However, the economic strategy to combat the impact of Covid-19 might need a rethink for two main reasons.
“First, there are concerns that the fiscal stimulus they have offered might not be enough. This is evidenced by spooked stock markets sinking as investors fear the measures are not adequate.
“There are serious questions. Can they get it into the hands of individuals and companies quick enough? Is the system too political to get these measures to the people that matter most and fast enough?
“Second, the government is raising this enormous headline-hitting injection through issuing bonds. But the bond market has responded with fear: the 10-year gilt yield is up from 0.5 per cent yesterday morning to 0.75 per cent.
“An oversupply risk is also exacerbating a wider and deeper lack of confidence, as we have seen on stock markets. The UK’s leading stock index, the FTSE100, was down 4.8 per cent this morning.”
He continues: There are some concerns about the mechanics of markets. The Volcker Rule post-2008 prevents banks warehousing risk, so if everyone sells and there is no-one to buy, then what happens? Previously, banks’ proprietary trading desks would take risks, but they are not allowed to now, meaning central banks will have to step in.
“If the markets don’t function as they should, this could hit the credit markets – a major issue as corporate America has borrowed more than ever before.”
Mr Green concludes: “I’m confident that ultimately the current volatility will highlight that we live in a time of great capabilities, opportunities and great promise.
“But with this volatility, people should revise and perhaps rebalance their financial strategies and portfolios to create, build and protect their wealth as the economic landscape evolves.”
About:
deVere Group is one of the world’s largest independent advisors of specialist global financial solutions to international, local mass affluent, and high-net-worth clients. It has a network of more than 70 offices across the world, over 80,000 clients and $12bn under advisement.
Be prepared for some really ugly earnings data in Q2 and Q3 of this year, then we’ll figure out if our expectations were accurate or not and what we should be doing to plan going forward.
The type of market condition I think we have entered could be here for a long time, and it’s going to be a traders’ market, which means you must have a trading strategy, plan your trades, and trade your plan. It’s amazing how simple a few trading rules that are written down on paper can save you thousands of dollars a week or month from locking in gains or cutting losses.
I have this mini trading strategy mastery course if you want to take control of your trades and override your emotional issues. And also if you want to start making money from home which is the only option going forward the next 3-6 months from the looks of it my trading as a business program is something to think about doing.
– If you hold winners until they turn into losers
– Taking too large of a position and get stuck with a drawdown so large that if you close the position you will lose 10-50% of your trading account
– have masted the art of buying high and selling low repeatedly?
All these things happen to most traders, and they can easily be overcome with a logical game plan I cover in the crash courses, pun intended ?
In short, if you have lost money with your trading account this year giving back years of gains, I think it’s worth joining my trading newsletter so you can stay on top of the markets and if you really want to excel take my mini-courses. I take the loud, emotional, and complex markets and deliver simple common sense commentary and a couple of winning trades each month for you to follow.
My trading is nothing extreme or crazy exciting because I’m not an adrenaline trading junky. I only want to grow my entire portfolio 2-4% a month with a couple of conservative ETF trades. Earning 22% – 48% return on my capital every year without the stress of being caught up in this type of market, and knowing I have a proven bear market trading strategy incase this market continues to fall is a comforting thought.
As a technical analysis and trader since 1997, I have been through a few bull/bear market cycles. I believe I have a good pulse on the market and timing key turning points for short-term swing traders.
Visit my ETF Wealth Building Newsletter and if you like what I offer, and ride my coattails as I navigate these financial markets and build wealth while others lose nearly everything they own during the next financial crisis.
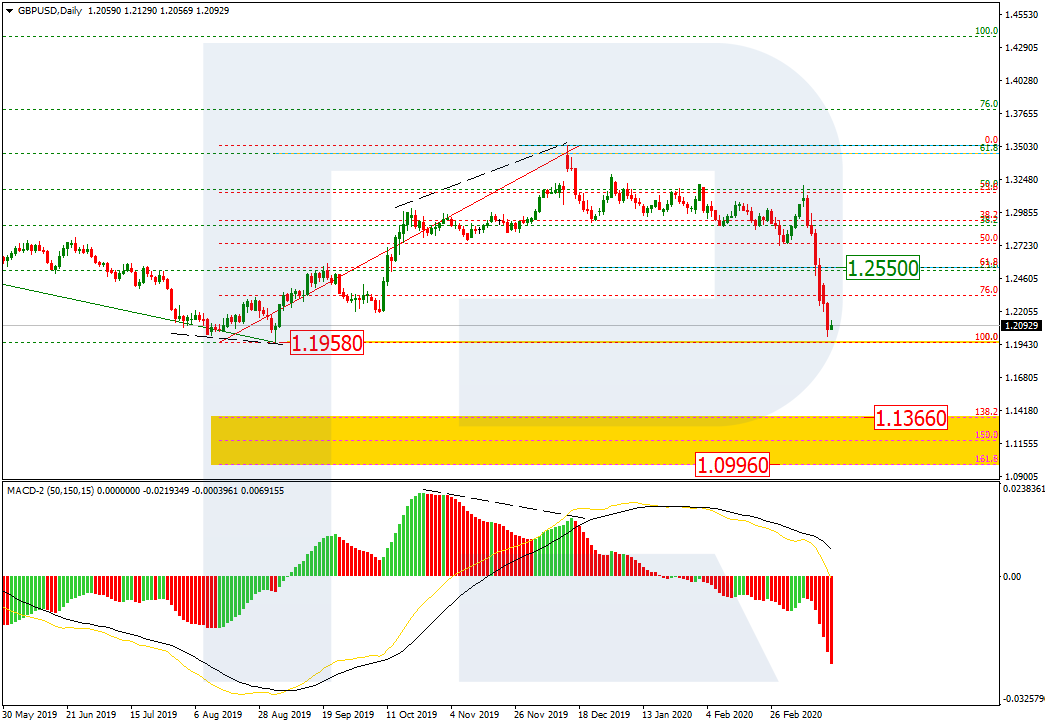
As we can see in the daily chart, a quick descending wave in GBPUSD, which started when the Bank of England decided to cut the benchmark rate, is heading to break the key low at 1.1958. If it happens, the pair may continue falling towards the post-correctional extension area between 138.2% and 161.8% fibo at 1.1366 and 1.0996 respectively. the resistance is 61.8% fibo at 1.2552.
In the H1 chart, the pair is getting closer towards the low at 1.1958. At the same time, there is a convergence on MACD, which may indicate a possible pullback towards the resistance in the nearest future.
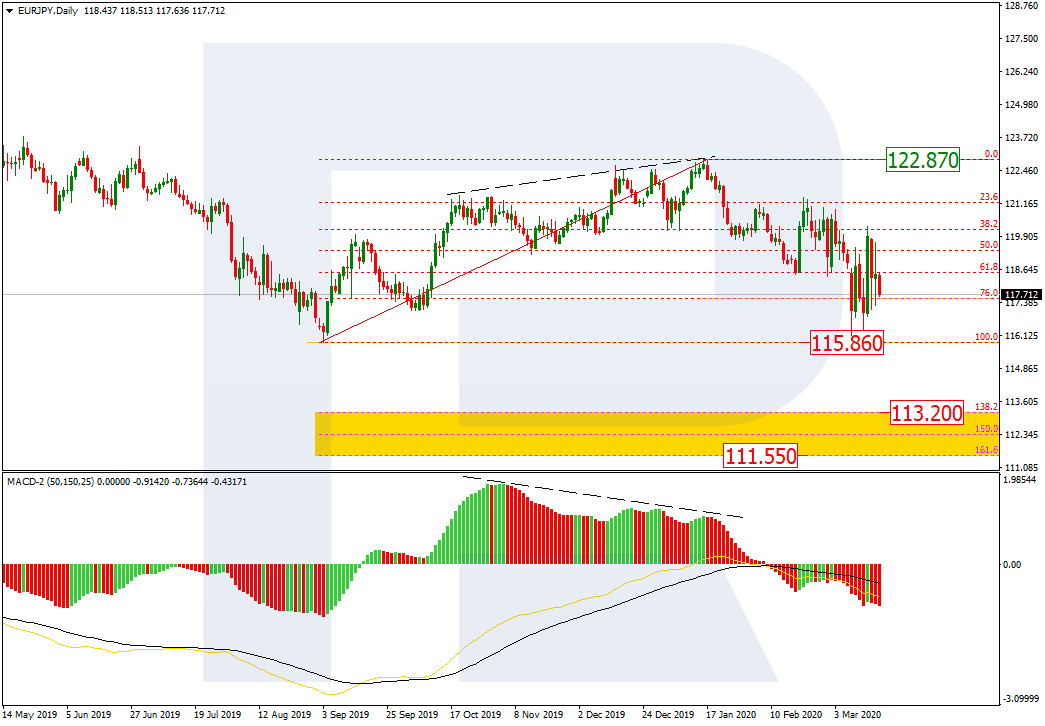
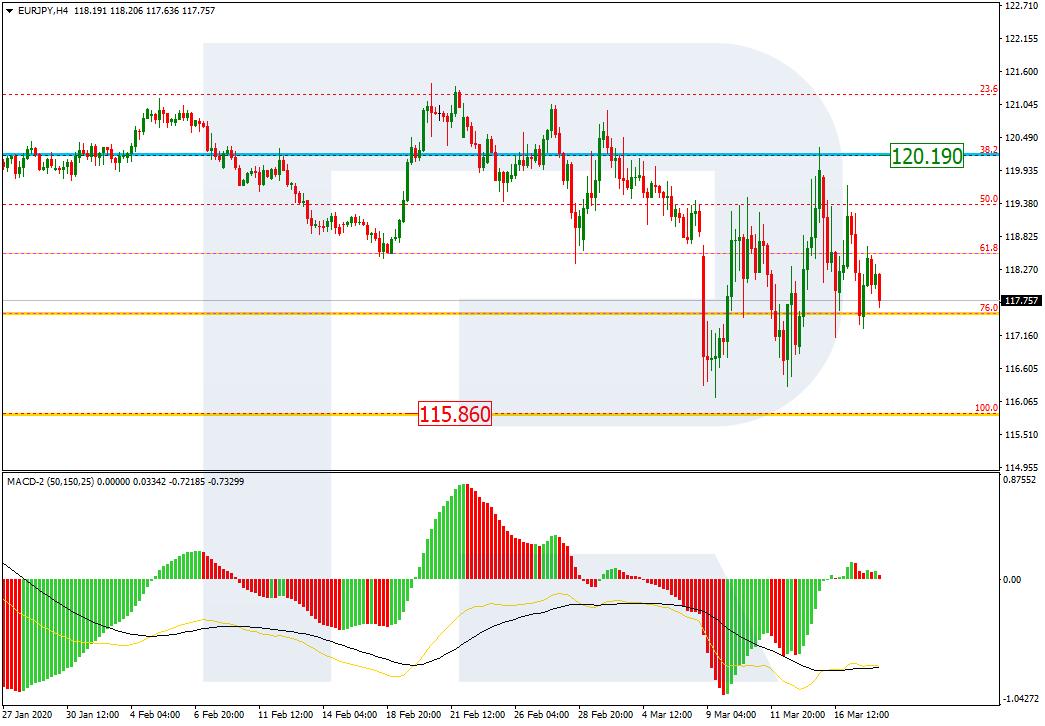
EURJPY, “Euro vs. Japanese Yen”
As we can see in the daily chart, the descending wave attempted to reach and test the long-term low at 115.86. However, after reaching the low, the pair rebounded from it, thus indicating a long correction. If the price breaks the low, the instrument may continue falling towards the post-correctional extension area between 138.2% and 161.8% fibo at 113.20 and 111.55 respectively.
In the H4 chart, the correction is taking the form of a volatile Zigzag. At the moment, EURJPY is moving between the long-term low and 38.2% fibo at 115.86 and 120.19 respectively.
Attention! Forecasts presented in this section only reflect the author’s private opinion and should not be considered as guidance for trading. RoboForex LP bears no responsibility for trading results based on trading recommendations described in these analytical reviews.
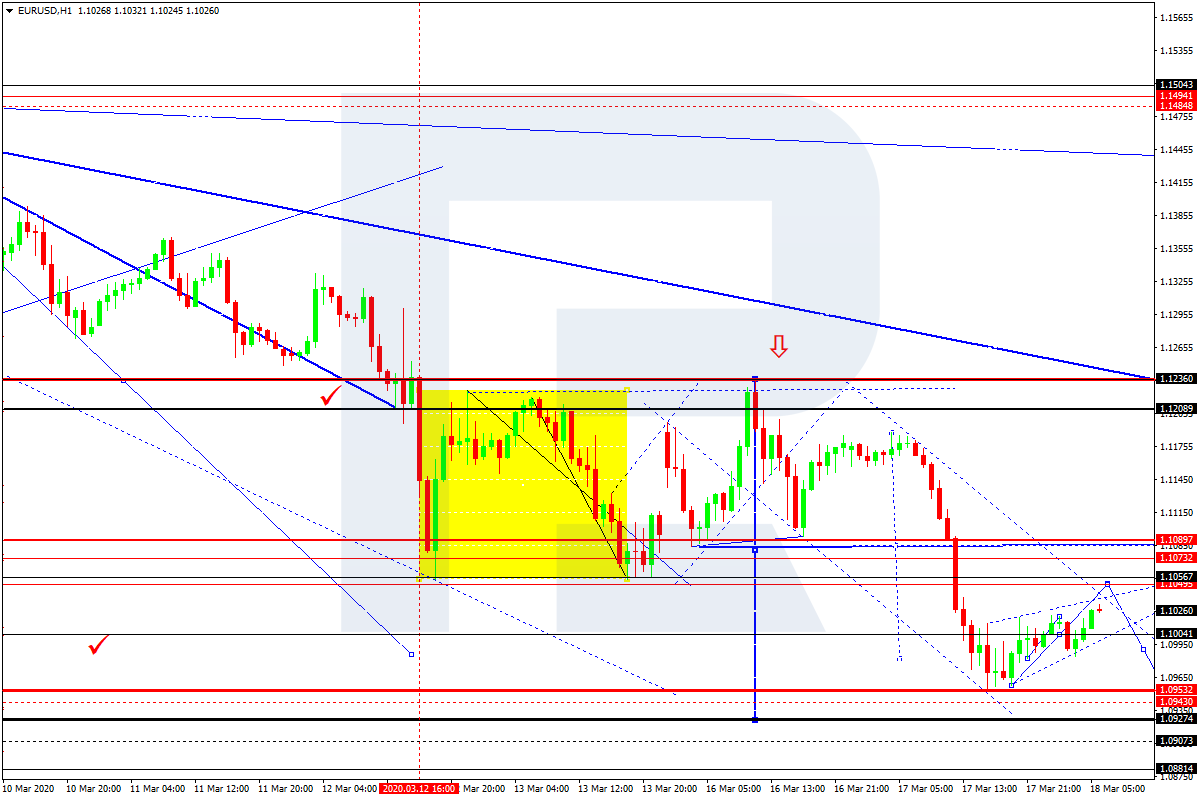
After forming the second descending impulse at 1.0954, EURUSD is correcting to reach 1.1044. After that, the instrument may resume falling to break 1.1005 and then continue trading downwards with the target at 1.0930.
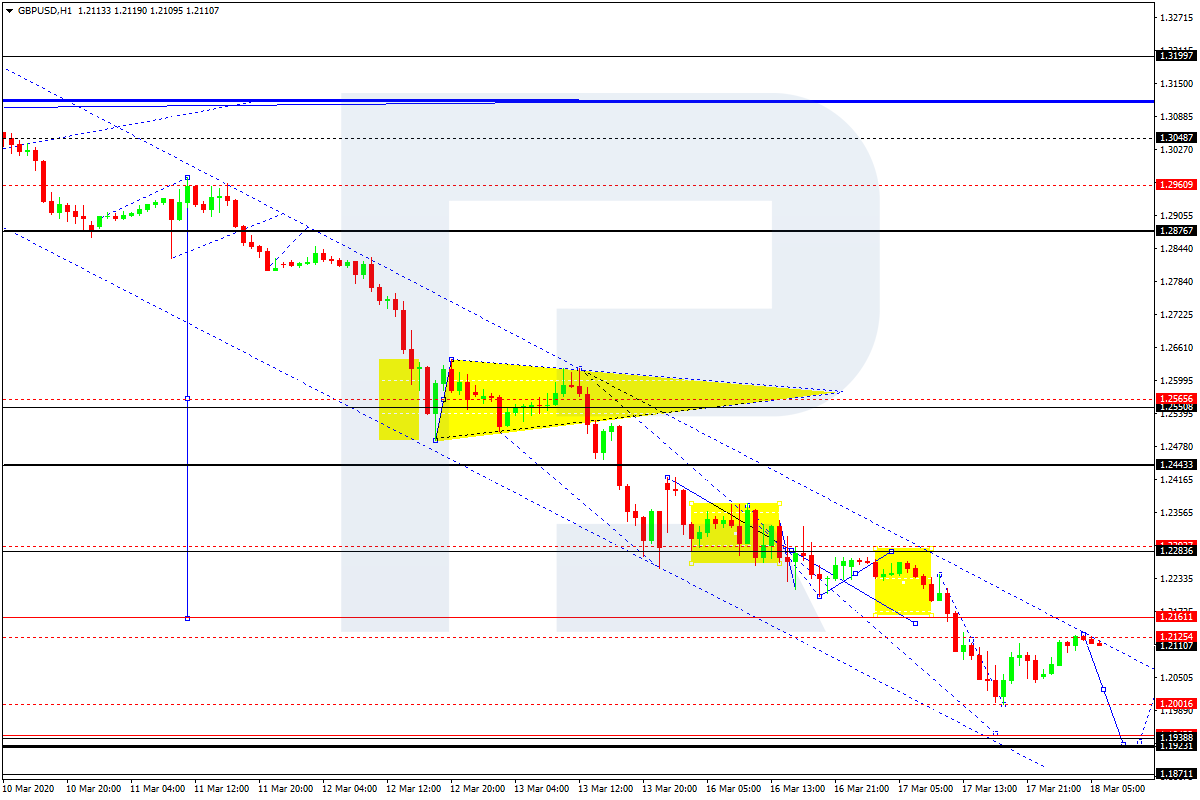
GBPUSD, “Great Britain Pound vs US Dollar”
GBPUSD continues falling towards 1.1940. Possibly, the pair may reach this level and then start consolidating near the lows. If later the price breaks this range to the downside, the market may resume trading downwards with the target at 1.1810; if to the upside – start a new correction towards 1.2444.
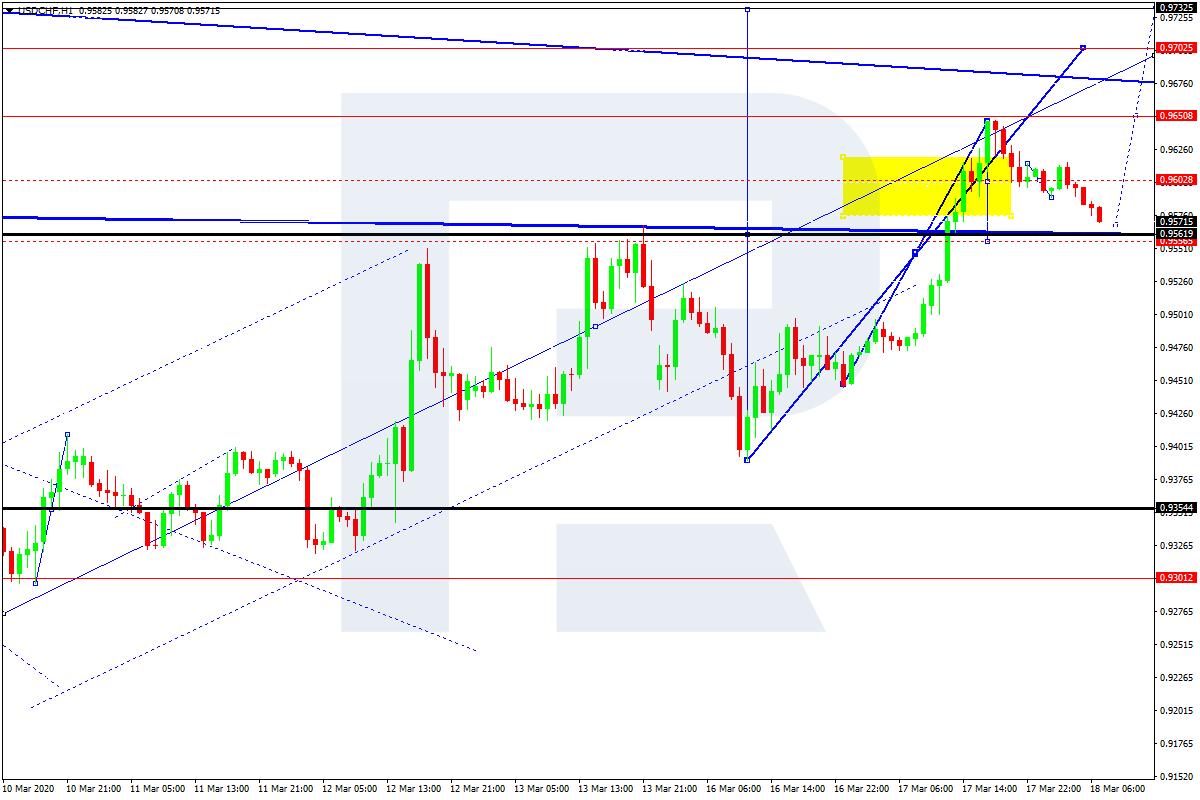
USDCHF, “US Dollar vs Swiss Franc”
USDCHF has completed the ascending structure at 0.9650; right now, it is correcting towards 0.9555. Later, the market may start a new growth with the target at 0.9700.
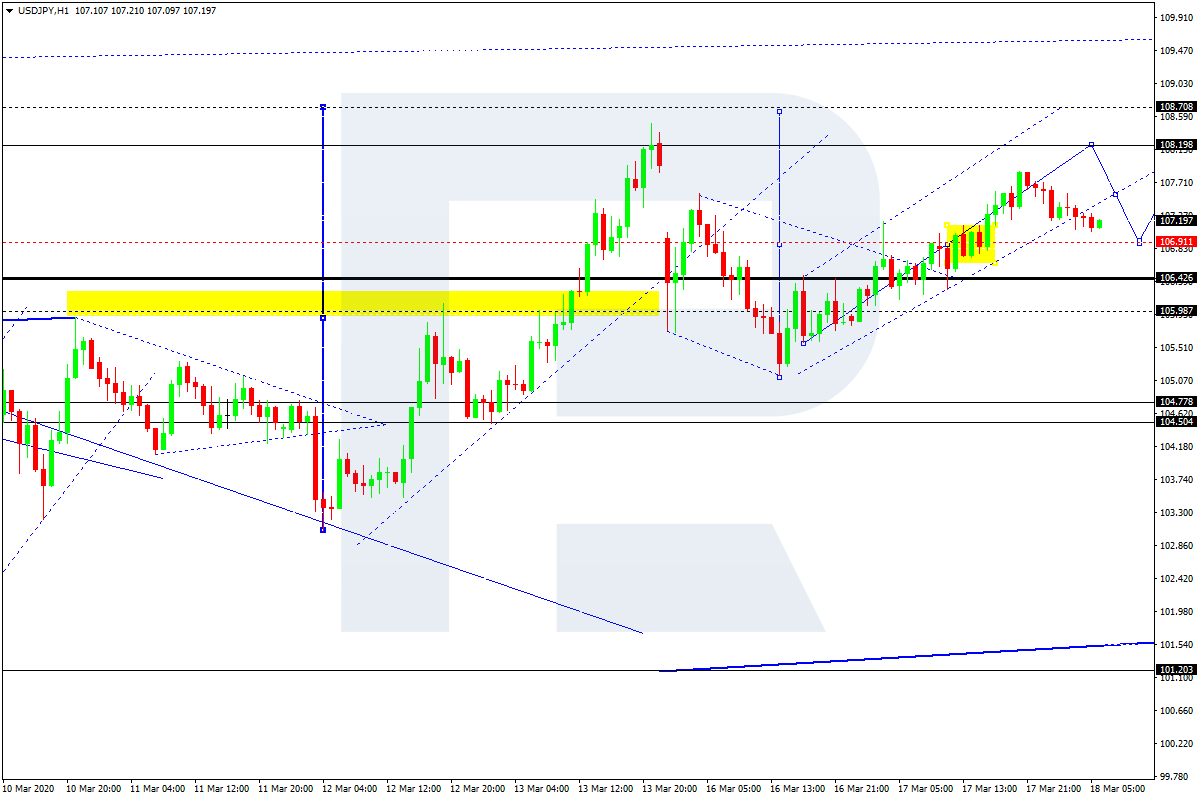
USDJPY, “US Dollar vs Japanese Yen”
After finishing the ascending structure to 107.77, USDJPY is correcting towards 106.44. After that, the instrument may resume trading upwards with the short-term target at 108.20.
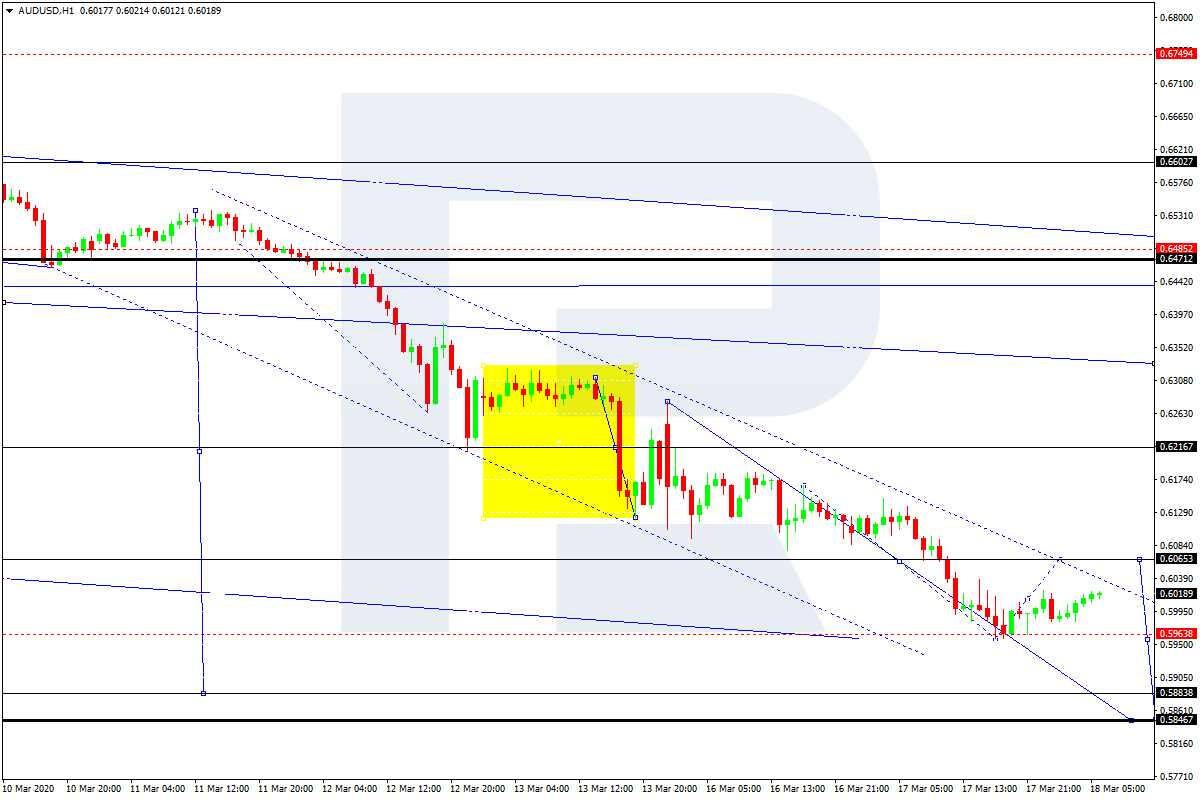
AUDUSD, “Australian Dollar vs US Dollar”
AUDUSD has finished the descending structure at 0.5964; right now. it is correcting to reach 0.6065. After that, the instrument may start a new decline with the target at 0.5888.
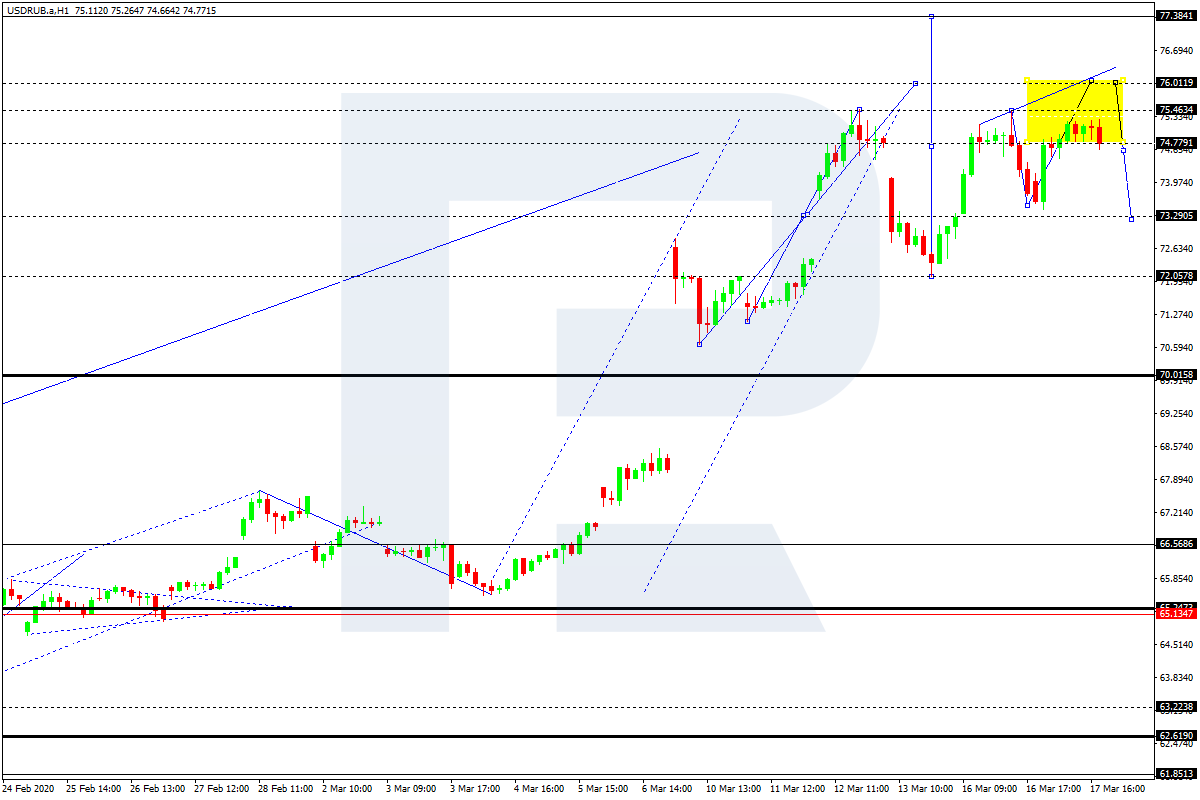
USDRUB, “US Dollar vs Russian Ruble”
USDRUB is consolidating around 74.47. Possibly, today the pair may expand the range up to 76.00. Later, the market may resume trading downwards to reach 73.30 and then start another growth with the target at 77.38.
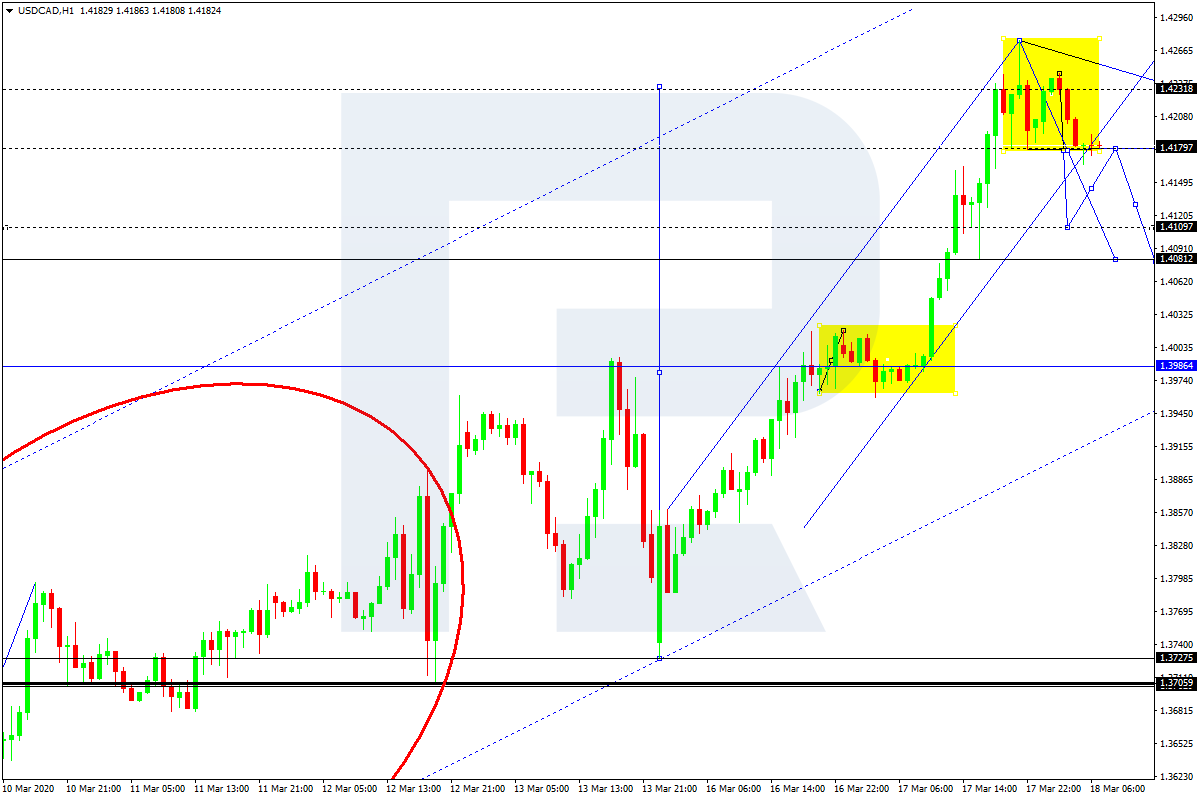
USDCAD, “US Dollar vs Canadian Dollar”
After completing the ascending wave at 1.4275, USDCAD is consolidating above 1.4180. Today, the pair may break this level to the downside and start a new correction with the target at 1.4082.
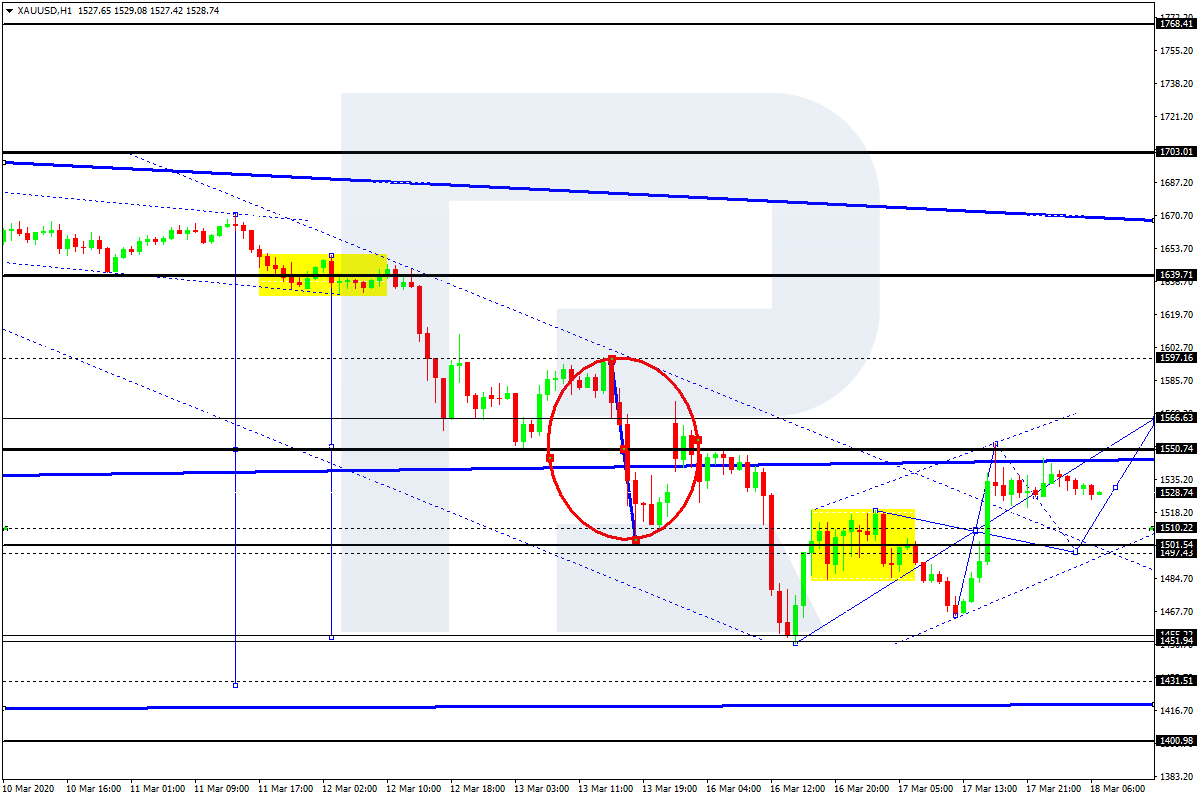
XAUUSD, “Gold vs US Dollar”
Gold has completed the second ascending impulse at 1550.70. Possibly, today the pair may fall to reach 1501.55 and then resume trading upwards with the target at 1566.60. Later, the market may form a new descending structure towards 1440.00.
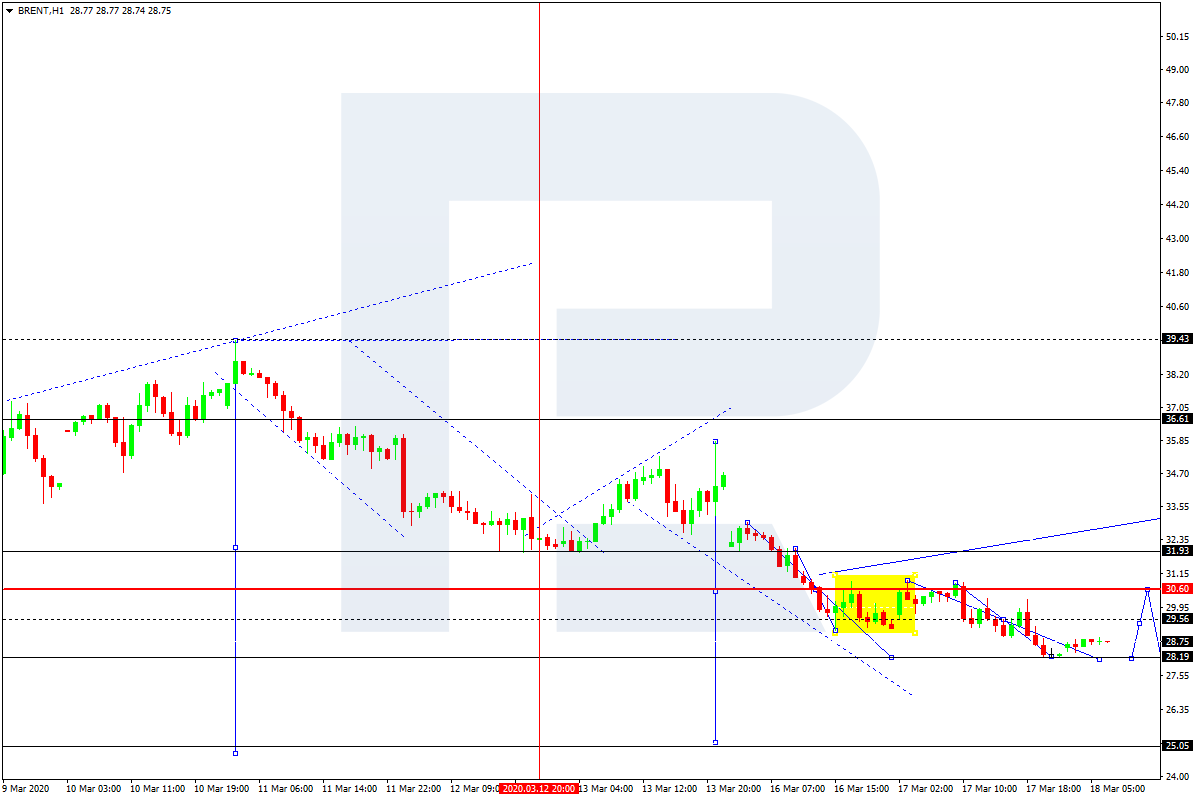
BRENT
Brent continues falling with the target at 27.90. According to the main scenario, the price may reach this level and then start another correction to test 32.00 from below. Later, the market may resume trading downwards with the target at 25.05.
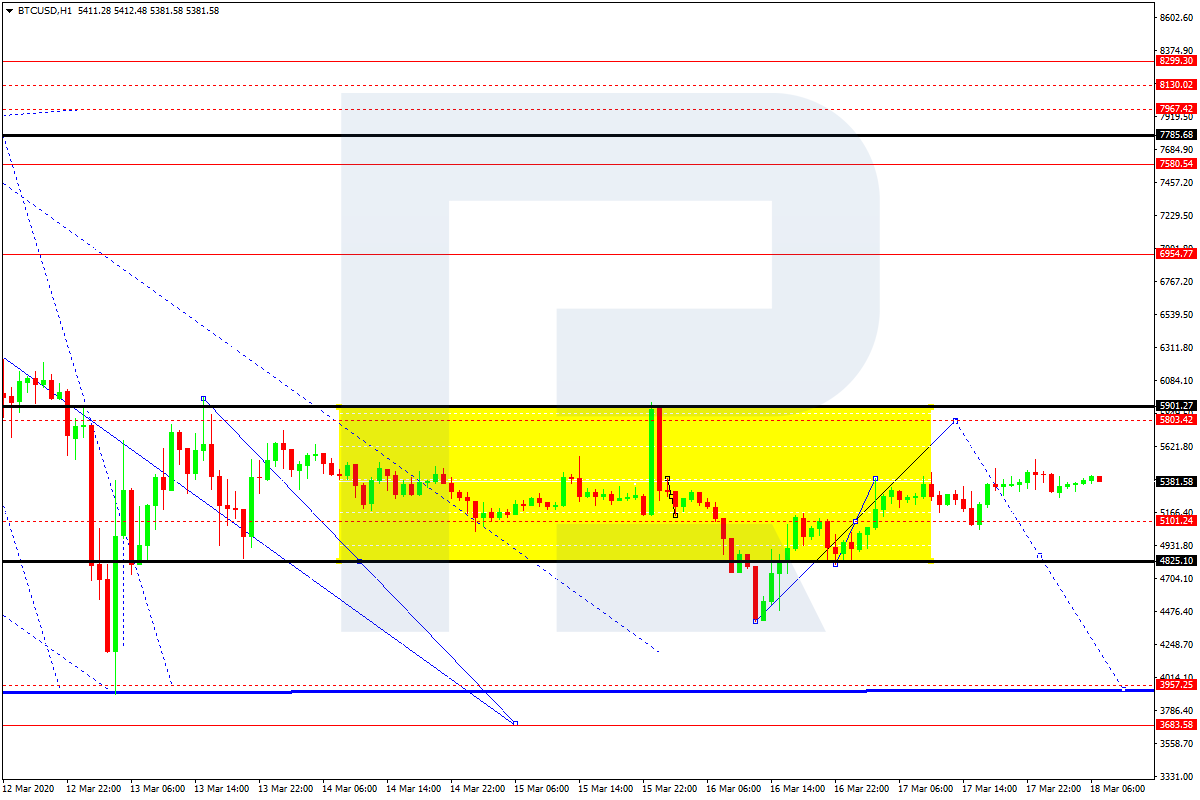
BTCUSD, “Bitcoin vs US Dollar”
BTCUSD is consolidating around 5100.00. Possibly, today the pair may expand the range up to 5800.00 and then form a new descending structure to break 4800.00. After that, the instrument may continue falling with the target at 3900.00.
Attention! Forecasts presented in this section only reflect the author’s private opinion and should not be considered as guidance for trading. RoboForex LP bears no responsibility for trading results based on trading recommendations described in these analytical reviews.
The EUR/USD currency pair has moved down. Yesterday the drop in quotes exceeded 170 points. The trading instrument has set new local lows. The demand for USD grew after Donald Trump’s statements. The US president promised to provide emergency financial aid to the population, to postpone tax payments and to provide new credit incentives. Currently, EUR/USD quotes are consolidating in the range 1.09550-1.10600. The can decline further. Open positions from key levels.
The Economic News Feed for 18.03.2020:
– Inflation Report (EU) – 12:00 (GMT+2:00);
– Real Estate Market Report (USA) – 14:30 (GMT+2:00);
The indicators signal the sellers’ power: the price has fixed below 50 MA and 100 MA.
The MACD histogram is in the negative zone, indicating a bearish sentiment.
The Stochastic Oscillator is in the neutral zone, the %K line is below the %D line, which gives a sell signal for EUR/USD.
Trading recommendations
Support levels: 1.09550, 1.09000
Resistance levels: 1.10600, 1.11600, 1.12300
If the price fixes below 1.09550, expect further decline of EUR/USD to the round level 1.09000.
Alternatively, the quotes could recover toward 1.09000.
The GBP/USD currency pair
Technical indicators of the currency pair:
Prev Open: 1.22688
Open: 1.20594
% chg. over the last day: -1.23
Day’s range: 1.20200 – 1.21295
52 wk range: 1.1959 – 1.3516
Aggressive sales are still observed on GBP/USD currency pair. Over the past two weeks, the pound lost over 1000 points. GBP reached the level of $1.20. At the moment, the trading instrument is consolidating. Investors continue to monitor the current information about the spread of the virus COVID-19. Technical correction of GBP/USD quotes is not ruled out in the near future. Positions should be opened from key levels.
The Economic News Feed for 18.03.2020 is calm.
The indicators signal the sellers’ power: the price has fixed below 50 MA and 100 MA.
The MACD histogram is in the negative zone, which indicates a bearish sentiment.
The Stochastic Oscillator has reached the oversold zone, the %K line has started to cross the %D line. There are no signals at the moment.
Trading recommendations
Support levels: 1.20000, 1.19000
Resistance levels: 1.21350, 1.22750, 1.24250
If the price fixes below the round level of 1.20000, GBP/USD quotes are expected to fall further toward 1.19500-1.19000.
Alternatively, the quotes could correct toward 1.22500-1.22300.
The USD/CAD currency pair
Technical indicators of the currency pair:
Prev Open: 1.40007
Open: 1.42021
% chg. over the last day: +1.61
Day’s range: 1.41663 – 1.42601
52 wk range: 1.2949 – 1.3566
USD/CAD currency pair continues to show a stable upward trend. The quotes have updated the multi-year highs. The CAD is under pressure from a significant drop in “black gold” prices. At the moment the local support and resistance levels are at 1.41500 and 1.42750, respectively. Nevertheless, technical correction of the trading instrument is not ruled out in the nearest future. We expect important statistics on Canadian economy. Open positions from key levels.
The basic consumer price index in Canada will be published at 14:30 (GMT+2:00).
The indicators signal the power of buyers: the price has fixed above 50 MA and 100 MA.
The MACD histogram is in the positive zone, which indicates a bullish sentiment.
The Stochastic Oscillator is in the neutral zone, the %K line is above the %D line, which also gives a signal to buy USD/CAD.
Trading recommendations
Support levels: 1.41500, 1.40150, 1.39500
Resistance levels: 1.42750, 1.43500
If the price fixes above 1.42750, consider buying USD/CAD as the price moves toward 1.40500-1.39500.
Alternatively, the quotes could correct toward 1.40500-1.39500.
The USD/JPY currency pair
Technical indicators of the currency pair:
Prev Open: 105.887
Open: 107.604
% chg. over the last day: +1.44
Day’s range: 106.752 – 107.637
52 wk range: 101.19 – 112.41
The technical picture on USD/JPY currency pair is still ambiguous. The trading instrument is in sideways movement. Participants of financial markets are waiting for additional drivers. Demand for safe haven currencies remains at a high enough level. At the moment local support and resistance levels are at 106.500 and 107.850, respectively. It is recommended to open positions from key levels.
The Economic News Feed for 18.03.2020 is calm.
The indicators signal the power of buyers: the price has fixed above 50 MA and 100 MA.
The MACD histogram is in the positive zone, but below the signal line, which gives a weak signal to buy USD/JPY.
The Stochastic Oscillator is in the neutral zone, the %K line is above the %D line, which indicates a bullish sentiment.
Trading recommendations
Support levels: 106.500, 105.250, 104.500.
Resistance levels: 107.850, 108.500
If the price fixes above 107.850, expect the quotes to rise toward 107.850.
Alternatively, they could descend toward 105.700-105.000.