On Monday morning, EUR/USD is slowly growing and trading close to 1.1130.
The US Federal Reserve cuts the benchmark rate for the second time this month, down to 0%-0.25%. The meeting where the regulator made the rate decision was unscheduled again, as the scheduled meeting is set for this week. For market players, the rate decision may act as a signal that possible consequences of the coronavirus world-wide transmission might be much more serious than meets the eye.
In the comments that followed the regulator said that the coronavirus pandemic had already done appreciable damage to global economies, including the USA. The virus consequences may have an influence on economic outlook and activity, that’s’ why the rate was cut.
The regulator is planning to keep the rate low up until the moment it is completely sure that the worst aspects of the outbreak are behind.
US President Donald Trump was very enthusiastic about the news and said that it was good for the country’s economy.
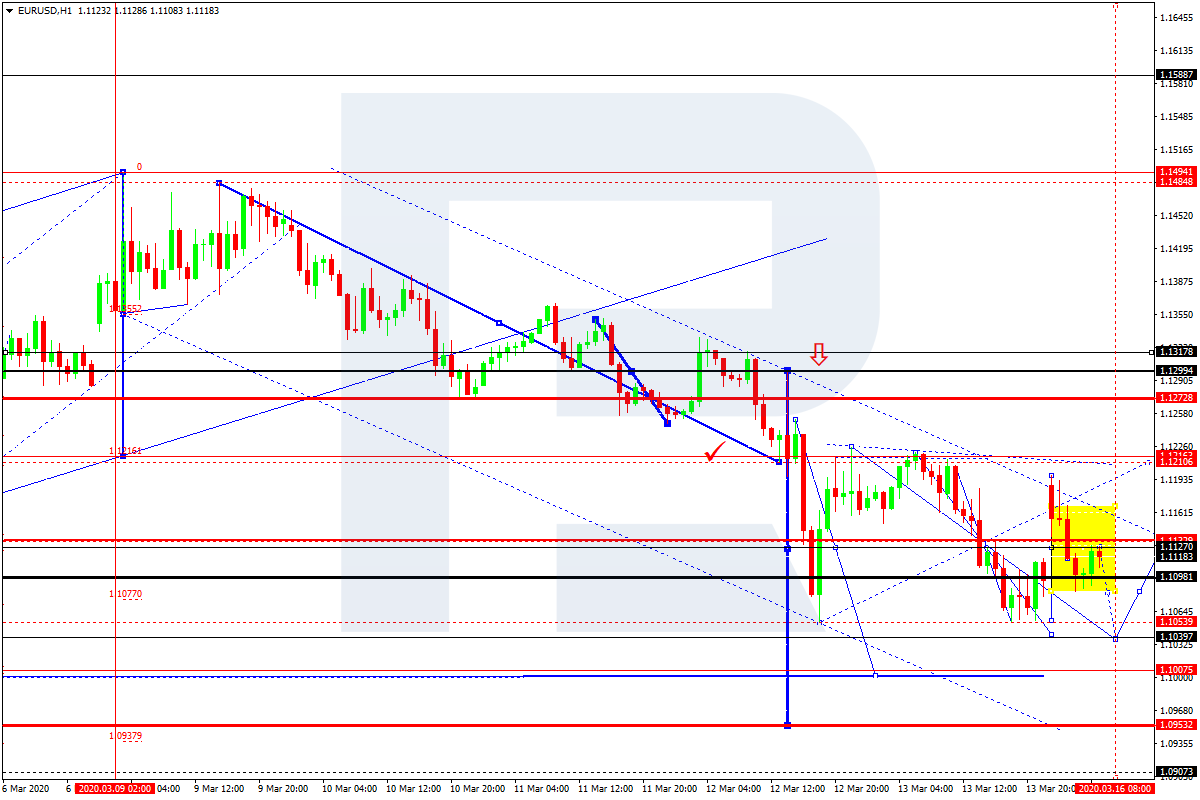
As we can see in the H4 chart, after breaking the rising channel and reaching 1.1106, EUR/USD is still moving downwards. If the price resumes growing and rebounds from 1.1212, the downtrend may continue towards 1.0950. However, if the price grows and breaks 1.1212 to the upside once again, it may continue trading upwards to reach 1.1300. From the technical point of view, the “decline” scenario is confirmed by MACD Oscillator: its signal line is moving below 0 inside the histogram area soon, thus indicating a further downtrend.
In the H1 chart, EUR/USD is growing to reach 1.1212 and may later fall towards 1.1127, thus forming a wide consolidation range around 1.1127 with equal chances of continuing either the correction or the downtrend. If the price rebounds from 1.1127 and breaks 1.1212, the correction will continue to reach 1.3000. However, if the price breaks 1.1127 to the downside, the instrument may fall to break 1.1050 as well and then continue moving downwards with the target at 1.0950. From the technical point of view, this scenario is confirmed by Stochastic Oscillator: its signal line is moving above 80 and may soon reverse towards 50. Later, this level may also be broken, thus resulting in further decline.
Disclaimer
Any predictions contained herein are based on the authors’ particular opinion. This analysis shall not be treated as trading advice. RoboForex shall not be held liable for the results of the trades arising from relying upon trading recommendations and reviews contained herein.
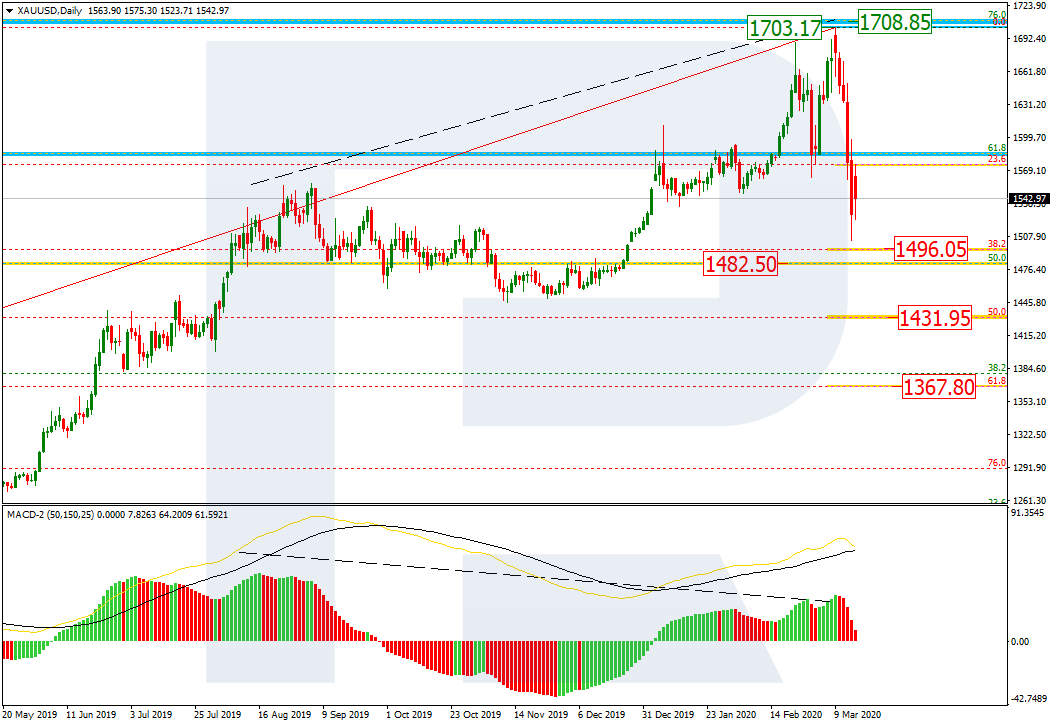
As we can see in the daily chart, the divergence made the pair reverse to the downside after reaching 76.0% fibo at 1708.10. Right now, XAUUSD is getting closer to 38.2% fibo at 1496.50, which is a long-term support level not far from 50.0% fibo at 1482.50. After reaching and breaking this area, the price may continue falling towards 50.0% and 61.8% fibo at 1431.95 and 1367.80 respectively. The resistance is the high at 1703.17.
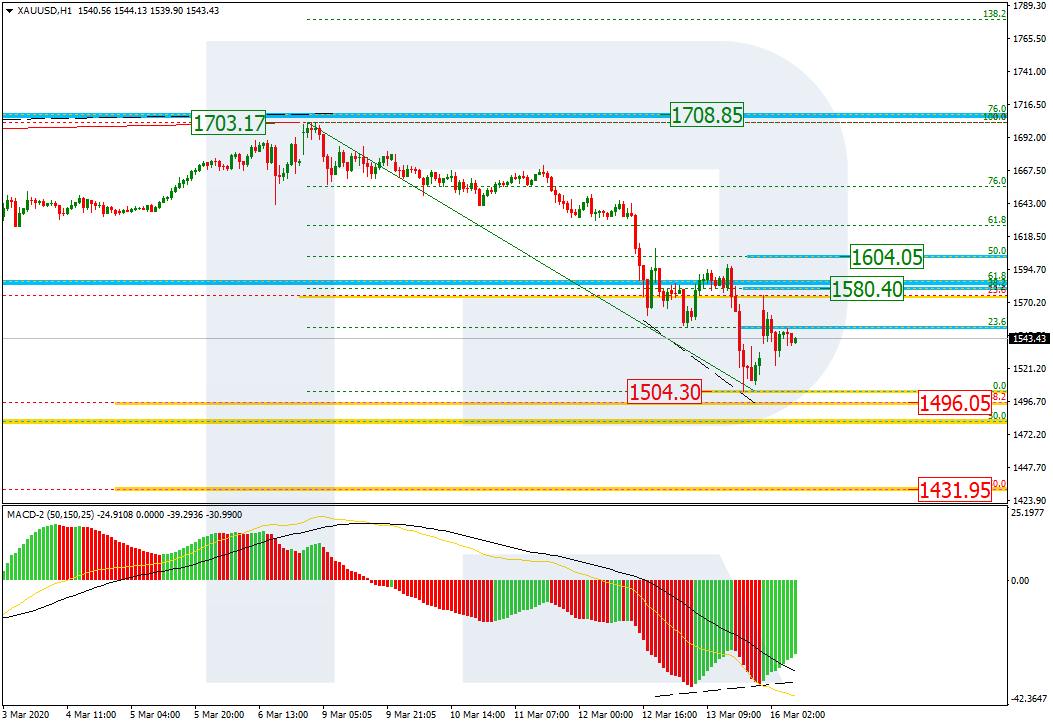
In the H1 chart, there was a local convergence that made the pair start a rising pullback, which has almost reached 38.2% fibo at 1580.40 and may later continue towards 50.05% fibo at 1604.05. If the price breaks the low at 1504.30, the mid-term decline may continue.
USDCHF, “US Dollar vs Swiss Franc”
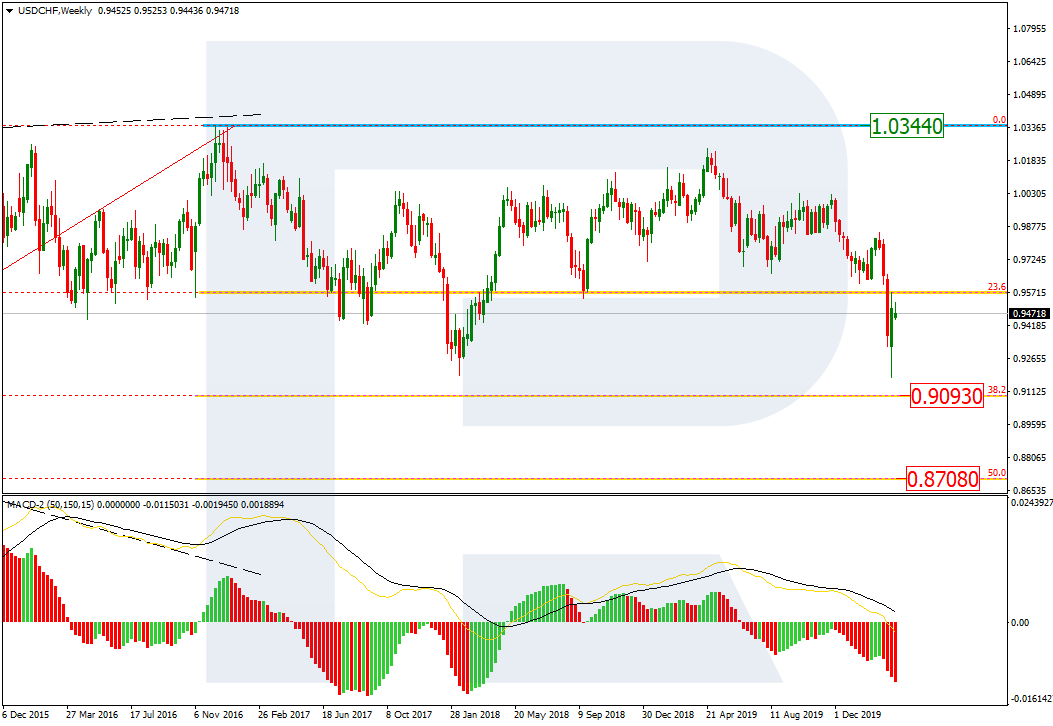
As we can see in the weekly chart, the divergence made the pair start a long-term bearish trend, which is heading towards 38.2% and 50.0% fibo at 0.9093 and 0.8708 respectively. The resistance is the high at 1.0344.
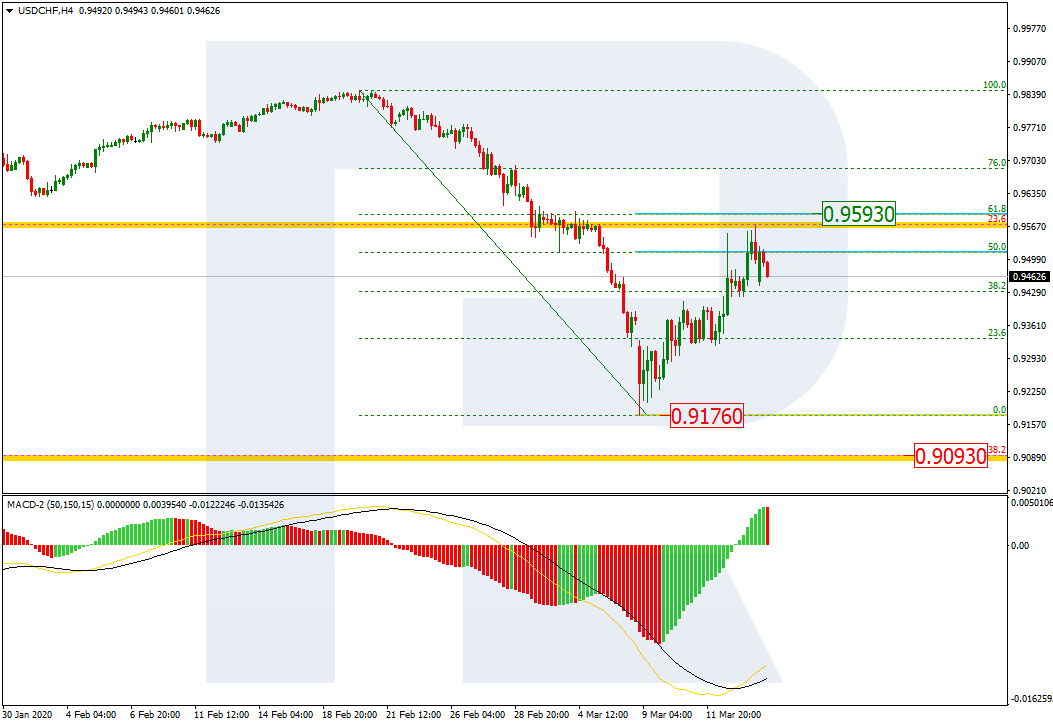
In the H4 chart, after forming a quick descending wave and trying to reach 38.2% fibo at 0.9093, the pair is correcting and has already reached 50.0% fibo. Later, the pair may grow towards 61.8% at 0.9593. After completing the pullback, the instrument is expected to resume falling towards the low at 0.9176 or even deeper.
Attention! Forecasts presented in this section only reflect the author’s private opinion and should not be considered as guidance for trading. RoboForex LP bears no responsibility for trading results based on trading recommendations described in these analytical reviews.
The recovery from a coronavirus-triggered recession will usher in a new era in which how we live, do business and invest will fundamentally change, affirms the CEO of one of the world’s largest independent financial advisory organisations.
The comments from Nigel Green, the chief executive and founder of deVere Group, come as consensus grows that a temporary world recession is imminent and as governments and central banks scramble to try and limit the impact.
On Sunday, the U.S. Federal Reserve announced another interest rate cut on Sunday – its second emergency measure this month.
Mr Green says: “Any way you look at it, it’s now almost certain that there will be a coronavirus-triggered recession as both global supply and demand are impacted.
“We can expect this recession to be deep but short. The slowdown will be temporary because it’s not caused by deep-rooted problems and imbalances in the economy, rather by a wholly unexpected shock that’s gripped the world.”
He continues: “Every recession produces a new world. This one will too.
“A Covid-19 recession is likely to fundamentally shift how we live, do business and invest.
“We’re moving towards an era of negative interest rates. The second cut of rates, now at zero, by the Federal Reserve – the world’s de facto central bank – suggests that the U.S. could soon join peers in Europe and Japan by adopting negative interest rates.
“Zero or negative rates will help boost financial asset prices and savvy investors will be seeking to top-up their portfolios by drip-feeding new money into the market at this time. They will give more investors more reason to increase their exposure to equities as the money won’t be working for them as cash deposits.”
Mr Green goes on to say: “The coronavirus outbreak can be expected to speed up the so-called Fourth Revolution, which is fuelled by new technologies, such as Artificial Intelligence and mobile supercomputing.
“New industries will emerge and, of course, there will be winners and losers. This will mean job losses in some sectors and huge, possibly unprecedented, job and investment opportunities in others.
“Enforced social distancing will highlight how families, friends and colleagues can interact, remain connected and work, how businesses can still efficiently operate, and how investors can manage assets via advancing digital infrastructures.”
The deVere CEO concludes: “The disruption and shifts will underscore that we live in a time of great capabilities and great promise.
“But to build and protect their wealth as the world adapts to a new era, investors should be revising their portfolios to mitigate risk and take advantage of the opportunities.”
About:
deVere Group is one of the world’s largest independent advisors of specialist global financial solutions to international, local mass affluent, and high-net-worth clients. It has a network of more than 70 offices across the world, over 80,000 clients and $12bn under advisement.
EURUSD is consolidating around 1.1127. Today, the pair may continue falling towards 1.1040 and then form one more ascending structure to return to 1.1127. After that, the instrument may resume trading downwards with the target at 1.0955.
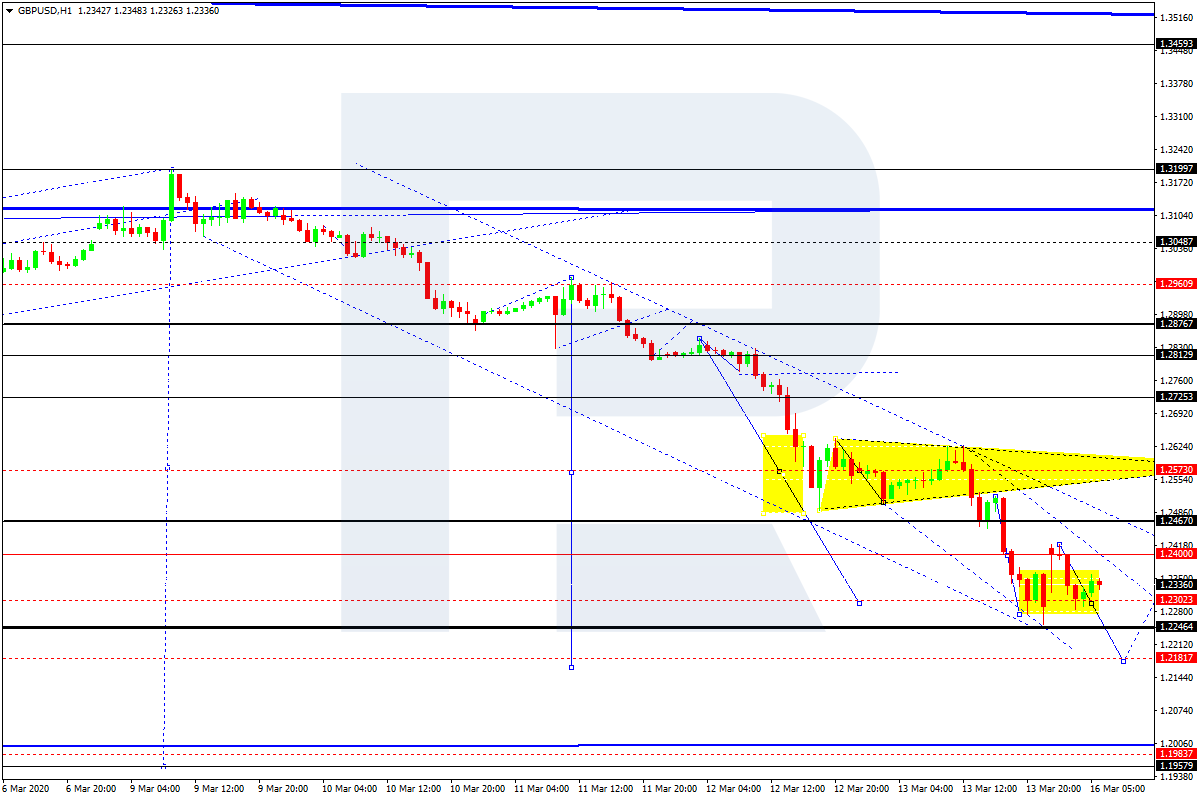
GBPUSD, “Great Britain Pound vs US Dollar”
GBPUSD continues falling with the target at 1.2282. Today, the pair may consolidate around 1.2302. Possibly, the price may form one more ascending structure towards 1.2460 and then start a new decline to reach 1.2182. Later, the market may return to 1.2460 and then resume trading downwards with the target at 1.1960.
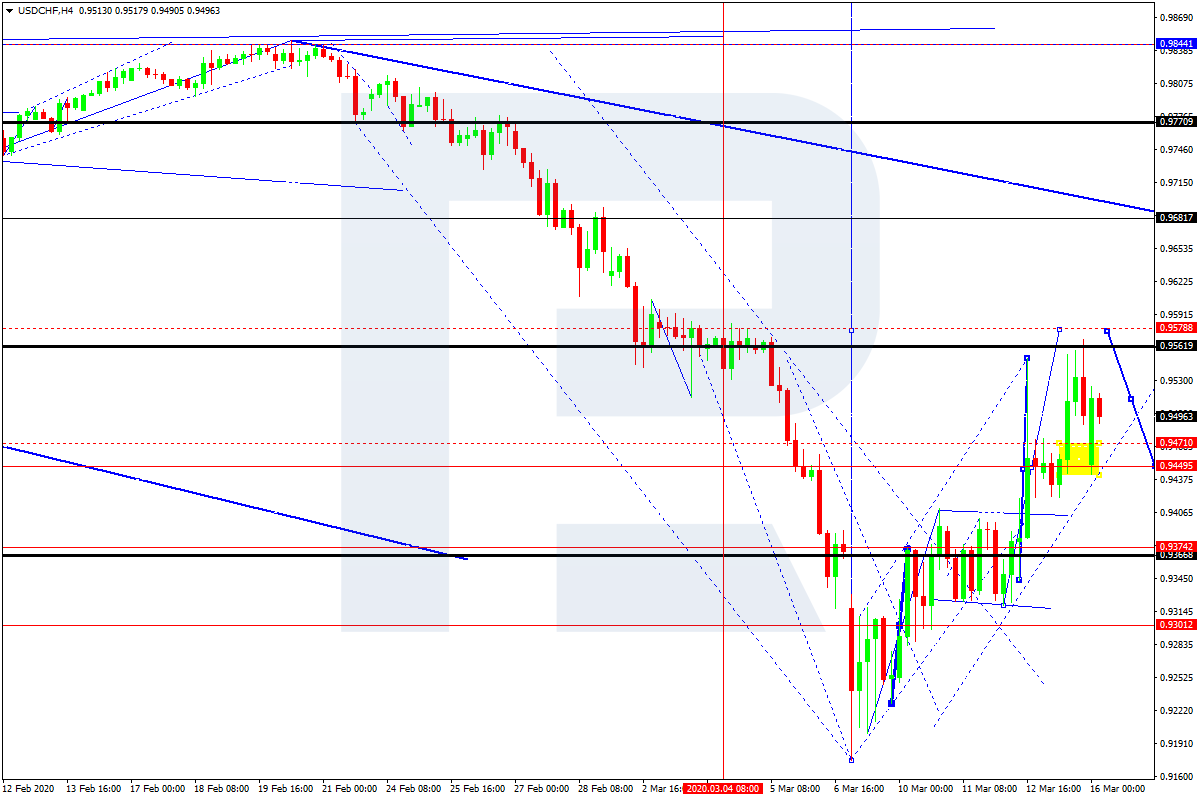
USDCHF, “US Dollar vs Swiss Franc”
USDCHF is forming the ascending wave towards 0.9578. Later, the market may form a new descending structure to reach 0.9445 and then start another growth with the target at 0.9680.
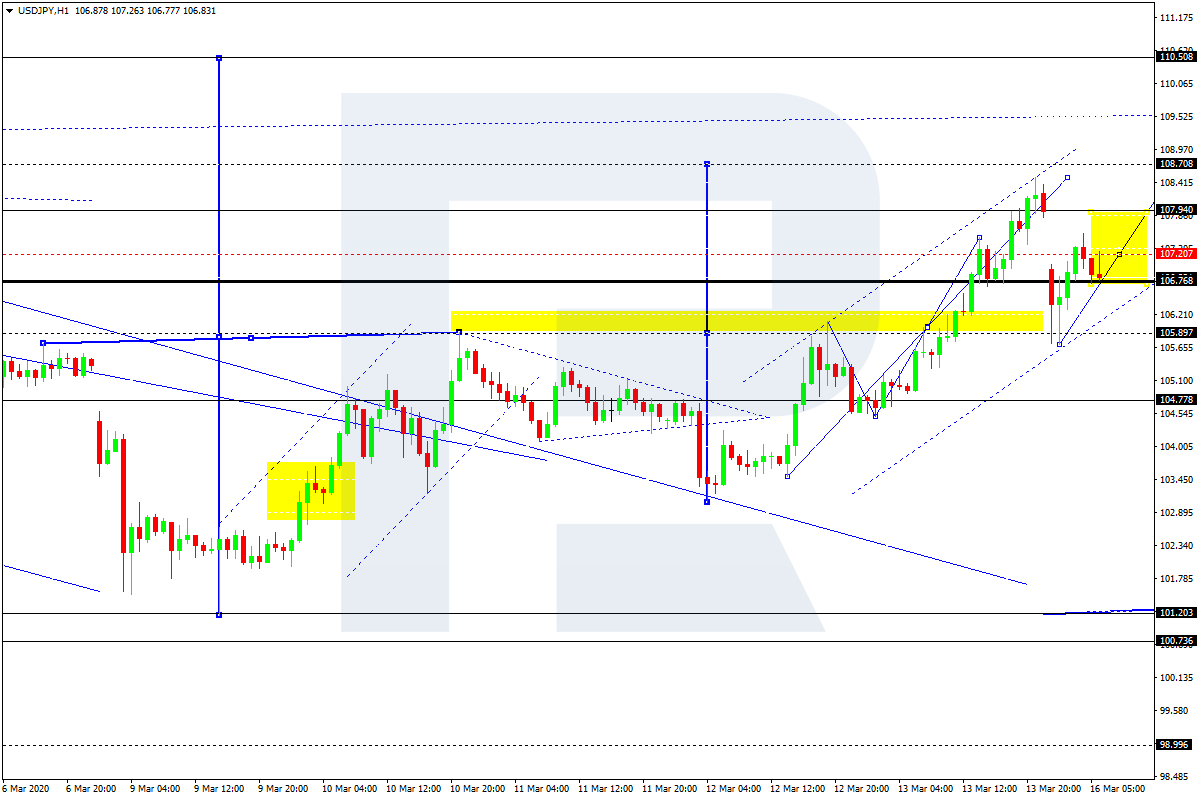
USDJPY, “US Dollar vs Japanese Yen”
After completing the ascending wave at 108.49, USDJPY has finished the correction towards 105.89. Today, the pair may continue growing to reach 108.70. After that, the instrument may start a new correction to return to 105.89 and then resume trading upwards with the target at 110.50.
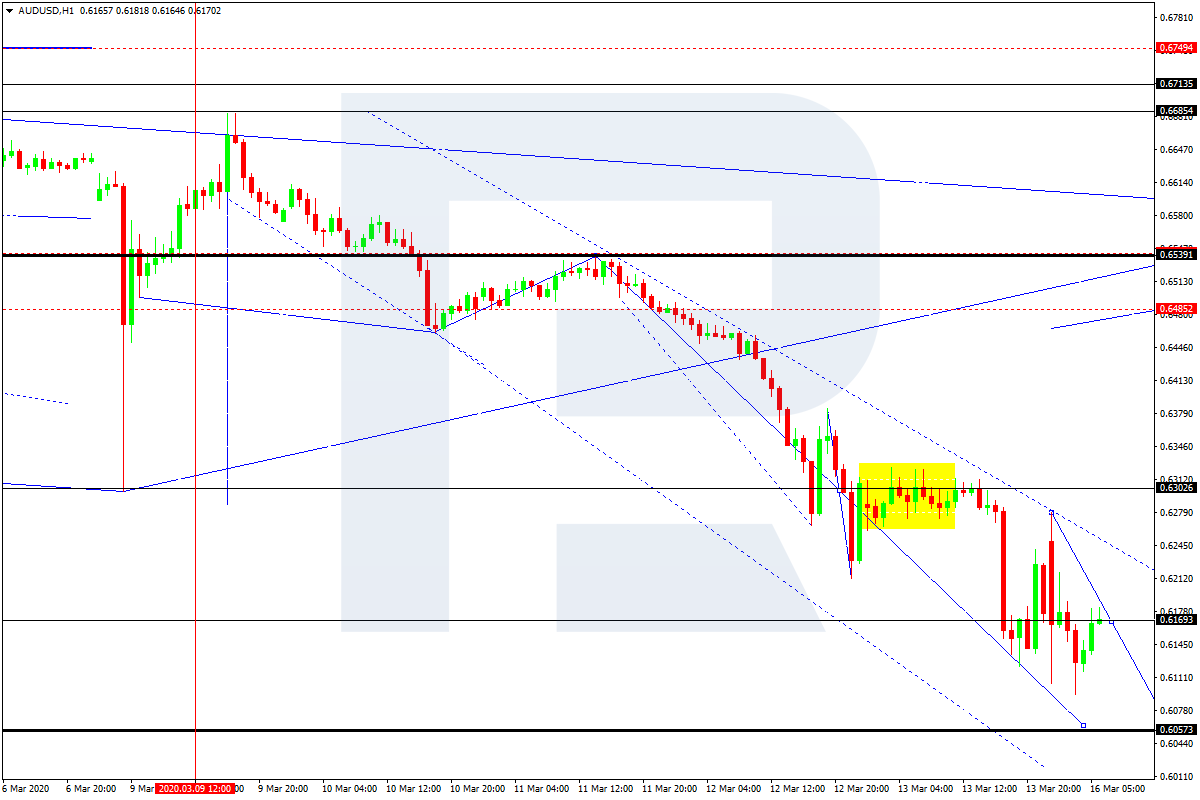
AUDUSD, “Australian Dollar vs US Dollar”
AUDUSD continues falling with the target at 0.6057. After that, the instrument may start a new correction towards 0.6303.
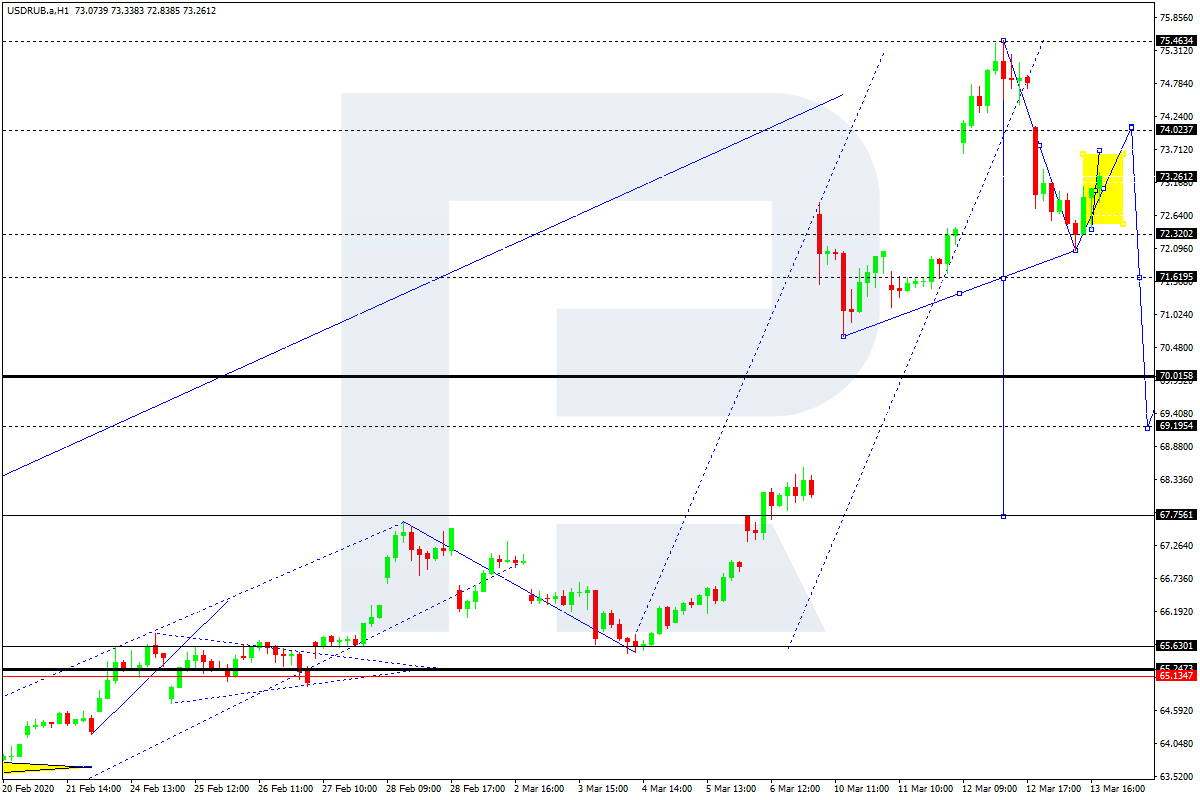
USDRUB, “US Dollar vs Russian Ruble”
USDRUB has finished the descending structure to reach 72.08. Possibly, today the pair may correct towards 74.02 and even return to 75.45. Later, the market may start another decline to break 72.10 and then continue trading downwards with the short-term target at 69.20.
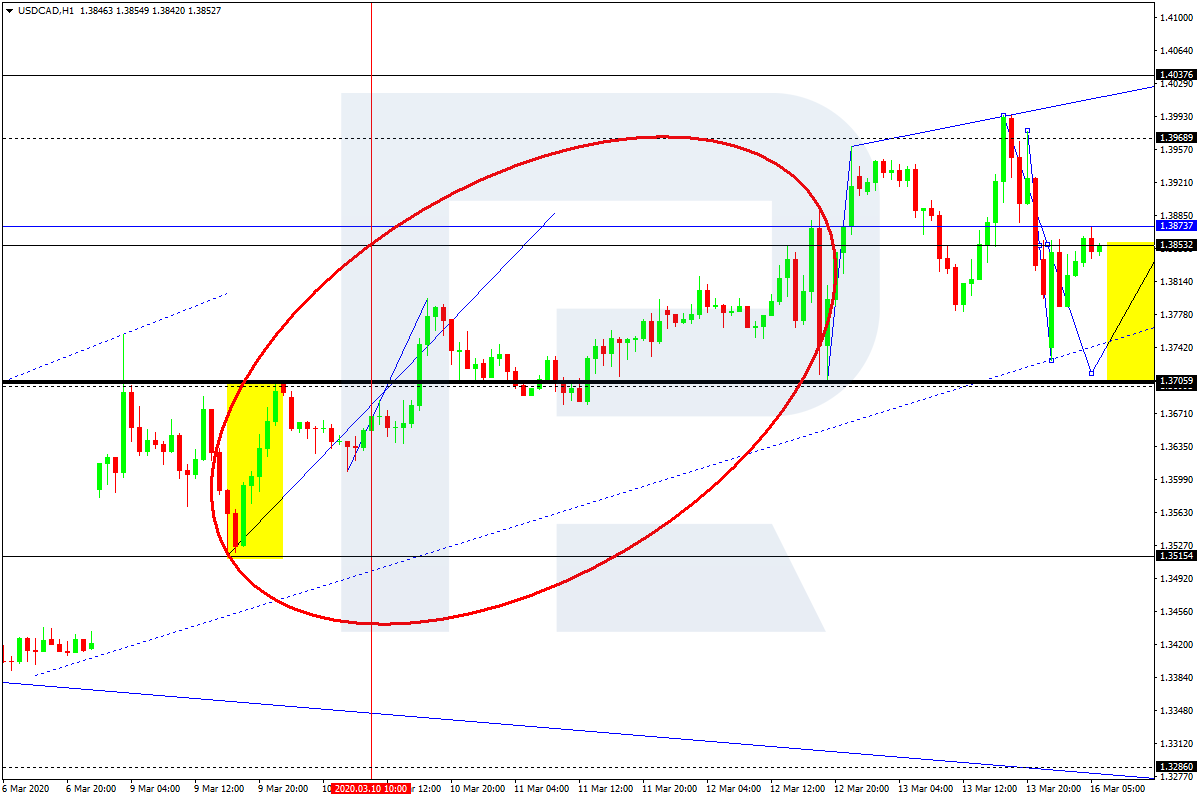
USDCAD, “US Dollar vs Canadian Dollar”
USDCAD is forming a wide consolidation range around 1.3853. Today, the pair may grow towards 1.4037 and then start a new decline to reach 1.3855. After that, the instrument may resume trading upwards with the short-term target at 1.4100.
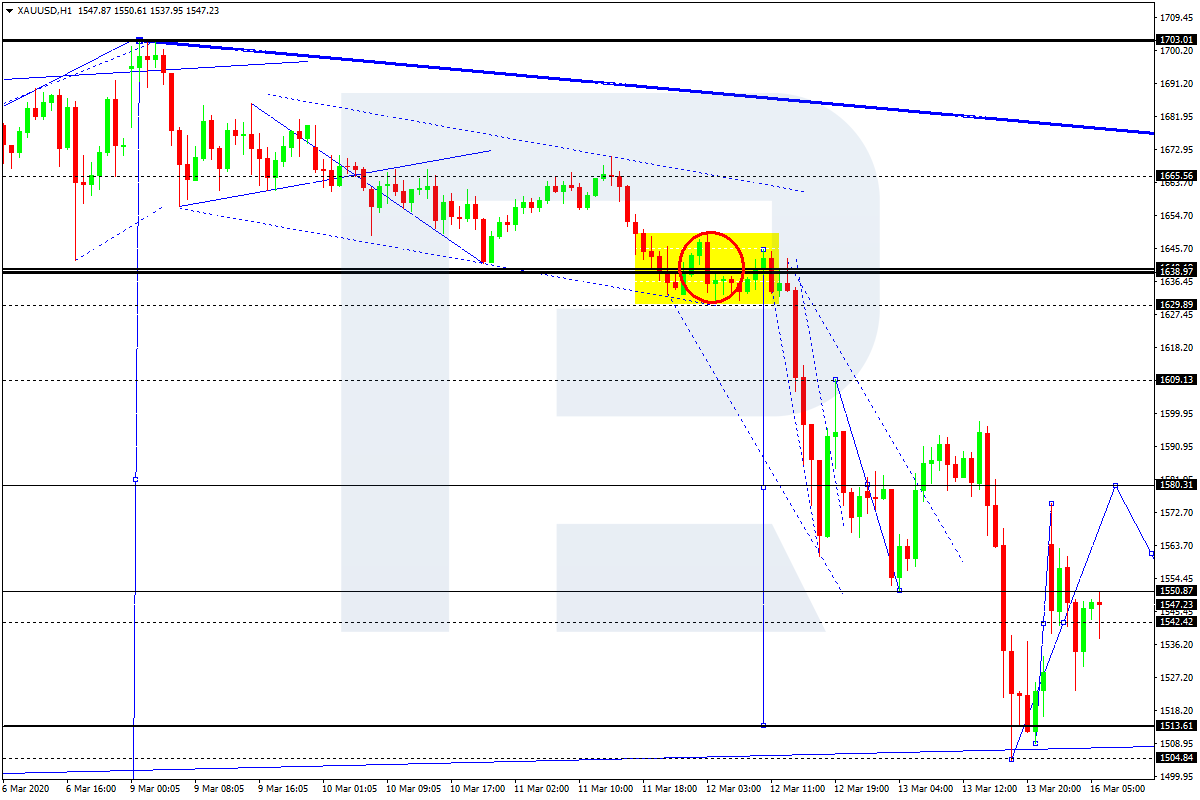
XAUUSD, “Gold vs US Dollar”
Gold continues falling; it has almost broken the ascending channel and reached 1504.25. Possibly, today the pair may correct towards 1580.30 and then form a new descending structure to reach 1461.40. After that, the instrument may start a new growth with the target at 1580.30.
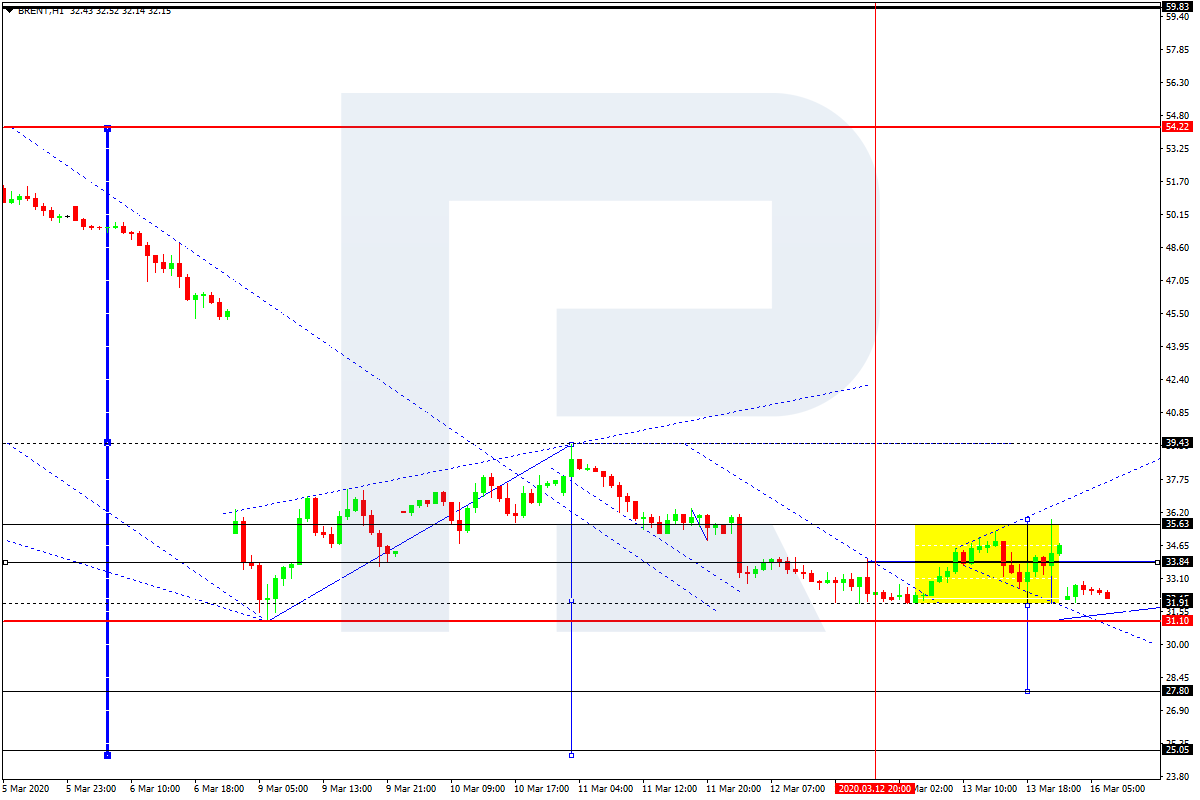
BRENT
Brent continues falling; right now, it is consolidating above 32.00. According to the main scenario, the price is expected to break the range to the downside and fall to reach 27.80. Later, the market may grow to test 31.90 from below and then resume trading downwards with the first target at 25.05.
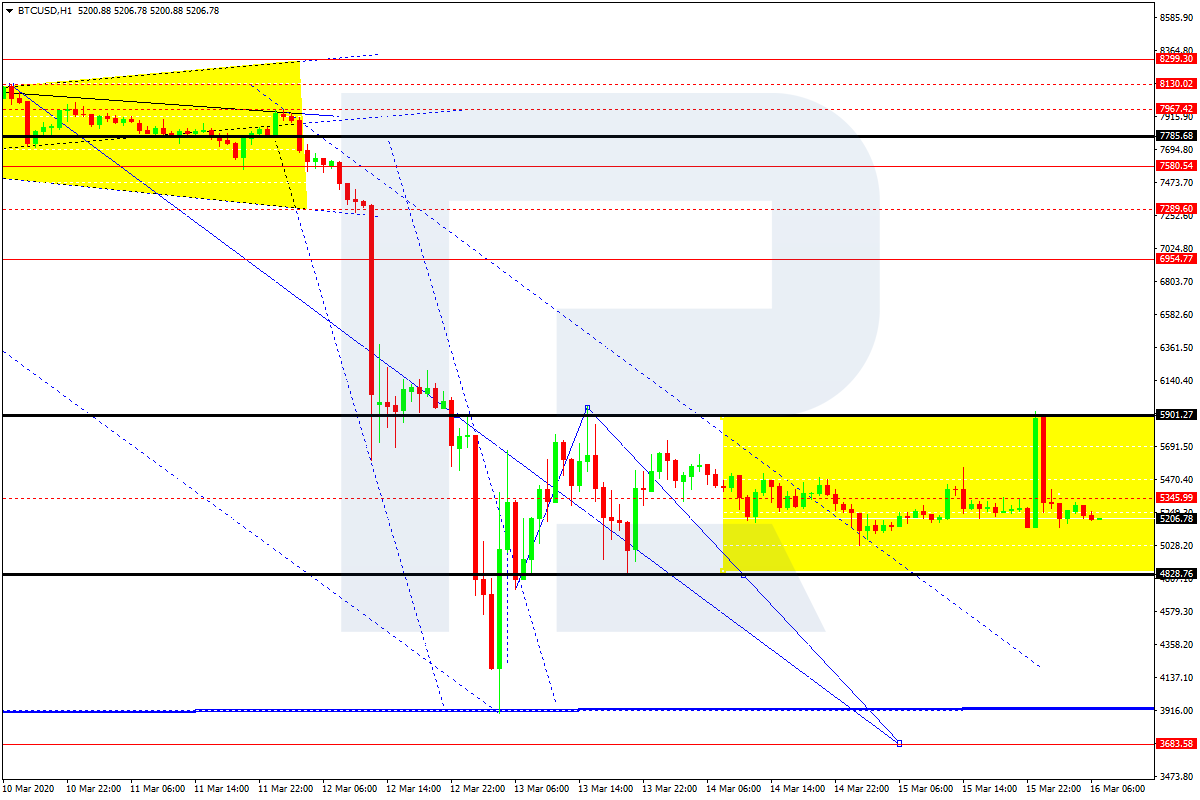
BTCUSD, “Bitcoin vs US Dollar”
After failing to break 5900.00 and rebounding from this level to the downside, BTCUSD is consolidating around 5400.00 and trying to start a new decline towards 4800.00. If later the price breaks this level, the pair may form a new descending structure with the target at 3700.00.
Attention! Forecasts presented in this section only reflect the author’s private opinion and should not be considered as guidance for trading. RoboForex LP bears no responsibility for trading results based on trading recommendations described in these analytical reviews.
The technical picture on the EUR/USD currency pair is ambiguous. The trading instrument is in sideways movement. Unidirectional trend is not observed. The U.S. Federal Reserve has sharply reduced the key interest rate range to 0-0.25%. Such measures were taken in order to combat the risks due to the coronavirus COVID-19 spread. A number of countries around the world have announced a stricter regime as a means of combating the epidemic. At the moment EUR/USD quotes are consolidating in the range of 1.10700-1.11600. Open positions from these markers.
Today the news background is quite calm. No important economic releases are planned for publication.
Indicators do not give accurate signals: the price is consolidating near 50 MA.
The MACD histogram is in the negative zone, but above the signal line, which gives a weak signal to sell EUR/USD.
The Stochastic Oscillator is in the neutral zone, the %K line is above the %D line, which indicates a bullish mood.
Trading recommendations
Support levels: 1.10700, 1.10000
Resistance levels: 1.11600, 1.12200, 1.12800
If the price fixes above 1.11600, EUR/USD quotes are expected to rise. Movement is tending to 1.12200-1.12800.
Alternatively, the EUR/USD currency pair may decline to the round level of 1.10000.
The GBP/USD currency pair
Technical indicators of the currency pair:
Prev Open: 1.25656
Open: 1.24085
% chg. over the last day: -1.02
Day’s range: 1.22849 – 1.24212
52 wk range: 1.1959 – 1.3516
GBP/USD quotes continue to show negative dynamics. Sterling reached its six-month low. At the moment the trading instrument is consolidating. The local support and resistance levels are 1.22600 and 1.24250, respectively. The technical correction of GBP/USD currency pair is not excluded in the nearest future. We recommend you to monitor the current information about the COVID-19 virus spread. Open positions from key levels.
The news background on the UK economy is calm.
The indicators signal the sellers’ strength: the price has fixed below 50 MA and 100 MA.
The MACD histogram is in the negative zone, which indicates a bearish sentiment.
The Stochastic Oscillator is in the neutral zone, the %K line is above the %D line, which indicates that the GBP/USD currency pair might correct.
Trading recommendations
Support levels: 1.22600, 1.22000
Resistance levels: 1.24250, 1.25100, 1.26400
If the price fixes above 1.24250, expect the quotes to correct toward 1.25500-1.26000.
Alternatively, the quotes could descend toward 1.22000.
The USD/CAD currency pair
Technical indicators of the currency pair:
Prev Open: 1.39172
Open: 1.37394
% chg. over the last day: -0.89
Day’s range: 1.37294 – 1.39098
52 wk range: 1.2949 – 1.3566
The USD/CAD currency pair is in sideways movement. There is no defined trend. At the moment local support and resistance levels are at 1.38400 and 1.39500, respectively. The CAD remains under pressure amid aggressive sales in the black gold market. Nevertheless, technical correction of the trading instrument after prolonged growth is not excluded in the nearest future. Open positions from key levels.
The Economic News Feed for 16.03.2020 is calm.
Indicators do not give accurate signals: the price tests 50 MA and 100 MA.
MACD histogram is near the 0 mark.
The Stochastic Oscillator is located in the overbought zone, the %K line is above the %D line, which gives a weak signal to buy USD/CAD.
Trading recommendations
Support levels: 1.38400, 1.37300, 1.36200
Resistance levels: 1.39500, 1.40000
If the price fixes above 1.39500, consider buying USD/CAD. The price will move toward 1.40500-1.41000.
Alternatively, the quotes could correct toward 1.37500-1.37000.
The USD/JPY currency pair
Technical indicators of the currency pair:
Prev Open: 104.733
Open: 107.304
% chg. over the last day: +3.13
Day’s range: 105.742 – 107.567
52 wk range: 101.19 – 112.41
The USD/JPY currency pair has moved up. The trading instrument reached key extremums. The Bank of Japan kept the interest rate on commercial banks’ deposits at the same level -0.1% per annum. The regulator announced an increase in stimulus measures in response to the spread of the epidemic. At the moment, the Safe Haven currency is consolidating in the range of 106,000-107,400. USD/JPY quotes have potential for further growth. Open positions from key levels.
The Economic News Feed for 16.03.2020 is calm.
The indicators signal the power of buyers: the price has fixed above 50 MA and 100 MA.
The MACD histogram is in the positive zone, but below the signal line, which gives a weak signal to buy USD/JPY.
The Stochastic Oscillator is in the neutral zone, the %K line is below the %D line, which indicates a bearish mood.
Trading recommendations
Support levels: 106.000, 104.500, 103.200
Resistance levels: 107.400, 108.400
If the price fixes above 107.400, expect further growth of USD/JPY quotes to 108.400-109.000.
Alternatively, the quotes could decline toward 105.000-104.000.
The US dollar strengthened against a basket of major currencies on Friday. The dollar index (#DX) closed in the green zone (+1.33%). However, today the US currency is declining sharply. Yesterday, the US Federal Reserve urgently reduced the base interest rate to zero and announced the launch of a large-scale program of quantitative easing. The regulator lowered the rate to 0-0.25%, announced plans to purchase additional government bonds $500 billion worth and guaranteed mortgage-backed securities of $200 billion. The Fed also called on banks to increase lending from existing reserves. These measures were taken in order to stabilize financial markets and support the US economy.
All are concerned about a flash of coronavirus. A number of countries around the world have announced a stricter regime as methods of combating a pandemic. In many countries, external borders are closed, and a ban on movement between different cities is introduced, except for special needs. Educational institutions, cinemas, theaters, museums, sports facilities, discos, pubs are closing.
China’s economy has shown the worst figures over the past 30 years. Industrial production fell by 13.5% in February, while experts forecasted growth by 1.5%. Fixed investments collapsed by 24.5%. And the unemployment rate rose by 6.2% in China.
The “black gold” prices continued to fall. Currently, futures for the WTI crude oil are testing the $30.45 mark per barrel.
Market indicators
On Friday, shares in the US stock market started to recover: #SPY (+8.55%), #DIA (+9.43%), #QQQ (+8.47%).
The 10-year US government bonds yield fell again. At the moment, the indicator is at the level of 0.77-0.78%.
The news feed on 2020.03.16:
Today, the publication of important news is not expected.
On Friday, March 13, the euro was down at the close of trading. The price remained within Thursday’s range. The price fall began during the European session and intensified during trading in New York after US President Donald Trump’s speech. He declared a state of emergency in the country in connection with the coronavirus pandemic. Trump promised to allocate a significant amount of funds to help alleviate the strain on affected states.
Investors responded positively to his statements, as they believe that emergency measures will be effective at dealing with the virus. Stock indices rose significantly. At the end of the day, the S&P500 and DJAI index grew by 9.36% and 9.28%, respectively. The yield on 10-year US government bonds rose to 1.019%, up from a record low of 0.36%,
Today’s news (GMT +3):
10:30 Switzerland: Producer and Import Prices (MoM) (Feb).
14:00 Germany: German Buba Monthly Report.
15:30 USA: NY Empire State Manufacturing Index (Mar).
23:00 USA: Net Long-Term TIC Flows (Jan).
Current situation:
The expectations laid out on Friday were fully justified. The EURUSD pair fell to the target of 1.1110.
On Monday, March 16, trading opened with a sharp increase to 1.1199. On March 3, the US Federal Reserve lowered its key interest rate from 1.5-1.75% per annum to 1-1.25% against the backdrop of the developing risks caused by the situation with the coronavirus (COVID-19). On Sunday, March 15, the agency lowered its key rate by 100 bp, to 0-0.25%. The committee plans to maintain the current range until it is sure that the economy has weathered the storm caused by recent events and is on its way to achieving its targets in the fields of employment and price stability. These targets are aimed at maintaining economic activity, developing favourable labour-market conditions and keeping inflation in-check. Once the situation has stabilised, the Fed plans on returning to its 2% target.
For almost four hours, bulls lost almost all of their profit made since the opening. This can be attributed to the fall of Asian stocks amidst the pandemic. Outside of China, the virus is spreading very quickly. In Spain, the armed forces have stepped in to help deal with the coronavirus. They are already patrolling the streets of Valencia, Seville, Zaragoza, Leon, Las Palmas and Santa Cruz de Tenerife. Sanctions for violation of the quarantine regime are very strict.
Disobedience or resistance towards officials, in cases where this does not constitute another crime, in particular, such as refusing to cooperate in identifying or providing false or inaccurate data in the process of identification carries a fine from 600 to 30,000 euros. Malicious disobedience or resistance towards the relevant authorities is punishable by imprisonment of three months to one year.
At the time of writing, the euro is worth 1.1142. On the hourly chart, a reversal formation appeared which points to growth, but its formation may drag on until mid-Tuesday. Since the price is trading below the balance line (Lb) and given the volatility of the situation surrounding the virus, it is assumed that bears will look to defend the 1.1230 level. A compromise for Monday would be the continuation of lateral movement under the Lb in the range of 1.1060 -1.1205. A breakdown of the resistance around the 1.1225-mark will open up the way for bulls to reach 1.1305, however, there is no guarantee this will come to fruition amidst the current situation with the coronavirus.
Last trading week saw massive volatility, starting with “Black Monday” due to both Coronavirus fears and oil prices collapsing due to Russia resisting Saudi Arabia’s push for deeper production cuts at the OPEC meeting in Vienna.
Thursday became a “Black Thursday” of sorts after the monetary stimulus from the ECB went nowhere, and market participants being concerned about US president Trump’s (surprising) travel ban from Europe to the US, resulting in the sharpest equity drop since the ‘real’ Black Monday on October 19, 1987.
As the week approached the close, signs point to a massive monetary stimulus in anticipation of a global economic downturn and recession, governments are also trying to fight Coronavirus induced recession fears.
The German government delivered a bomb by announcing billions of Euro to cushion the economy, with plans to set up a safety net for companies and no limit on credit programs.
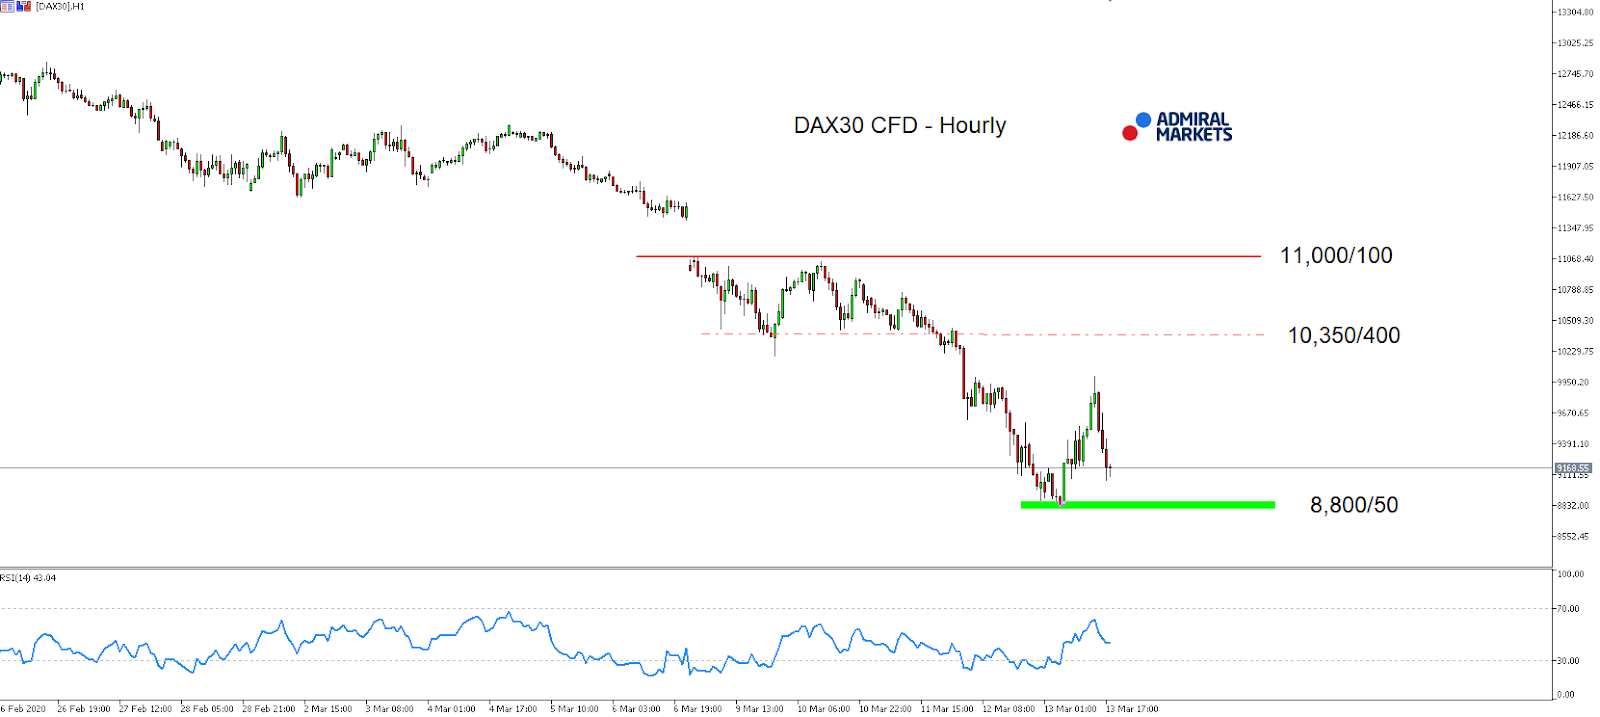
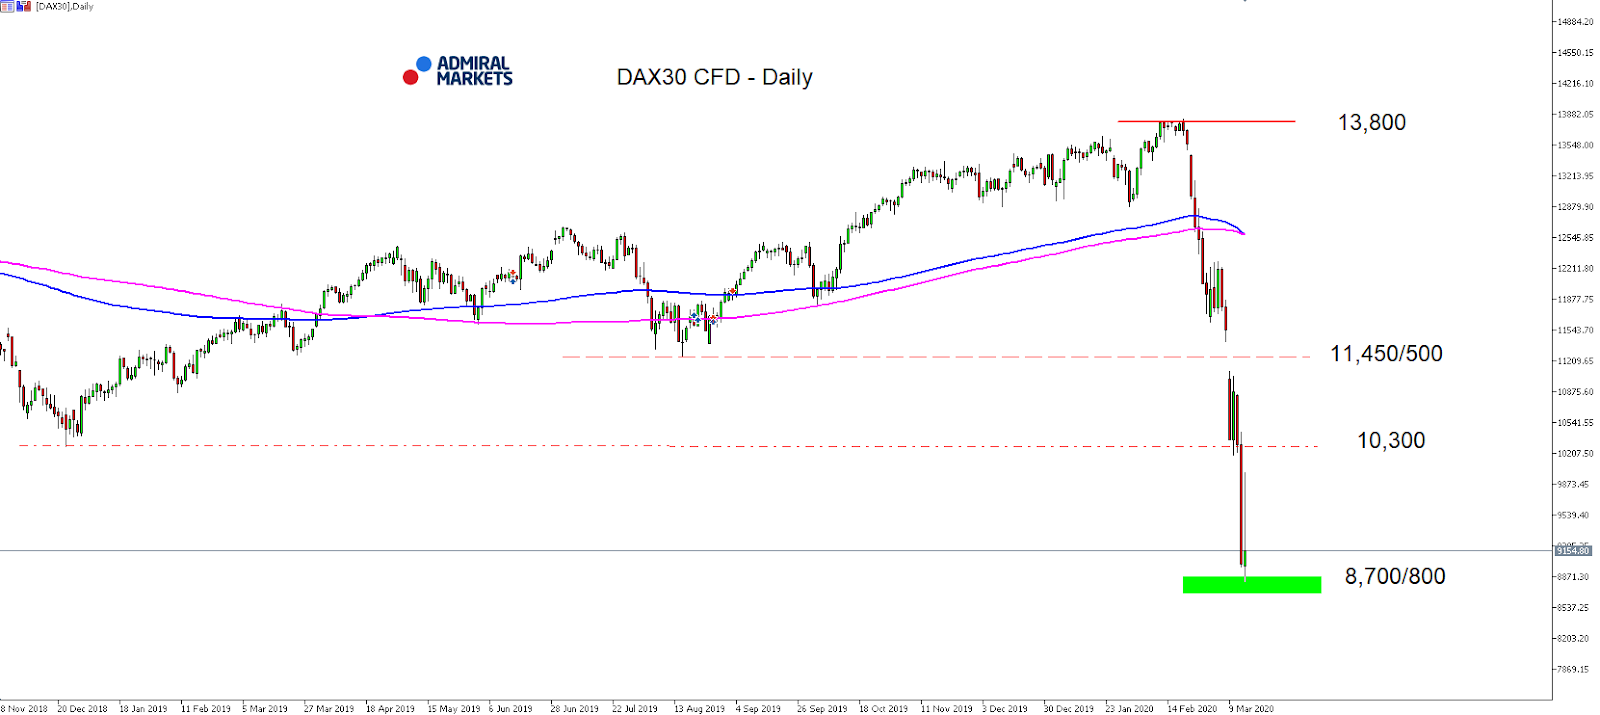
As a result, the DAX30 CFD rallied sharply, gaining as much as 9% on the day, but gave back all of its gains in the hours later that day – a very weak sign.
Similar measures from other governments, especially European ones, should probably be expected. Short positions should be taken very cautiously, even though the overall advantage stays on the Short-side.
Technically, the Short sequence stays given as long as the DAX30 CFD trades below 11.000 points, drop below 9,000 points is clearly on the table with a potential target being found around 8,700 points, while a potential Short-trigger is technically found around 10,200 points:
Source: Admiral Markets MT5 with MT5-SE Add-on DAX30 CFD Hourly chart (between February 26, 2020, to March 13, 2020). Accessed: March 13, 2020, at 10:00pm GMT
Source: Admiral Markets MT5 with MT5-SE Add-on DAX30 CFD Daily chart (between November 28, 2018, to March 13, 2020). Accessed: March 13, 2020, at 10:00pm GMT – Please note: Past performance is not a reliable indicator of future results, or future performance.
In 2015, the value of the DAX30 CFD increased by 9.56%, in 2016, it increased by 6.87%, in 2017, it increased by 12.51%, in 2018, it fell by 18.26%, in 2019, it increased by 26.44% meaning that after five years, it was up by 34.2%.
Discover the world’s #1 multi-asset platform
Admiral Markets offers professional traders the ability to trade with a custom, upgraded version of MetaTrader 5, allowing you to experience trading at a significantly higher, more rewarding level. Experience benefits such as the addition of the Market Heat Map, so you can compare various currency pairs to see which ones might be lucrative investments, access real-time trading data, and so much more. Click the banner below to start your FREE download of MT5 Supreme Edition!
Disclaimer: The given data provides additional information regarding all analysis, estimates, prognosis, forecasts or other similar assessments or information (hereinafter “Analysis”) published on the website of Admiral Markets. Before making any investment decisions please pay close attention to the following:
This is a marketing communication. The analysis is published for informative purposes only and are in no way to be construed as investment advice or recommendation. It has not been prepared in accordance with legal requirements designed to promote the independence of investment research, and that it is not subject to any prohibition on dealing ahead of the dissemination of investment research.
Any investment decision is made by each client alone whereas Admiral Markets shall not be responsible for any loss or damage arising from any such decision, whether or not based on the Analysis.
Each of the Analysis is prepared by an independent analyst (Jens Klatt, Professional Trader and Analyst, hereinafter “Author”) based on the Author’s personal estimations.
To ensure that the interests of the clients would be protected and objectivity of the Analysis would not be damaged Admiral Markets has established relevant internal procedures for prevention and management of conflicts of interest.
Whilst every reasonable effort is taken to ensure that all sources of the Analysis are reliable and that all information is presented, as much as possible, in an understandable, timely, precise and complete manner, Admiral Markets does not guarantee the accuracy or completeness of any information contained within the Analysis. The presented figures refer that refer to any past performance is not a reliable indicator of future results.
The contents of the Analysis should not be construed as an express or implied promise, guarantee or implication by Admiral Markets that the client shall profit from the strategies therein or that losses in connection therewith may or shall be limited.
Any kind of previous or modeled performance of financial instruments indicated within the Publication should not be construed as an express or implied promise, guarantee or implication by Admiral Markets for any future performance. The value of the financial instrument may both increase and decrease and the preservation of the asset value is not guaranteed.
The projections included in the Analysis may be subject to additional fees, taxes or other charges, depending on the subject of the Publication. The price list applicable to the services provided by Admiral Markets is publicly available from the website of Admiral Markets.
Leveraged products (including contracts for difference) are speculative in nature and may result in losses or profit. Before you start trading, you should make sure that you understand all the risks.
By Dan Steinbock – Despite containment in China, international response against the coronavirus has been lagging. So, what can be learned from the Chinese experience?
As the novel coronavirus is globalizing, the very nature of the outbreak – which the World Health Organization (WHO) has now declared a global pandemic – is changing.
As the early imported cases are now being augmented with local transmissions, the novel coronavirus outbreak has moved into a new, more serious phase. That’s why March will be the critical month worldwide.
International virus escalation
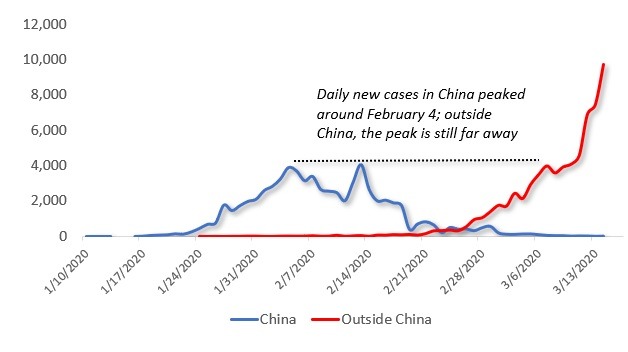
During the first week of February, I projected the turnaround in the outbreak; that is, deceleration of cases in China and acceleration of cases outside China. At the time, the number of the infected in the Chinese mainland was still below 30,000 and outside China less than 300.
Some observers, even “market experts,” thought that was the end of the story, whereas those with greater foresight understood it was just the tip of the iceberg.
Although relative infection rates were already increasing internationally, too many international observers saw the virus as “China’s problem.” In the coming months, that flawed misperception will prove very costly in terms of human lives and economic damage.
As confirmed cases in China now exceed 80,000, those outside China are climbing closer to that level. In China, the turnaround came about 1 month after the first recorded cases. Outside China, the early cases were first reported after mid-January, but there has been no turnaround. Instead, international escalation is rapidly intensifying (Figure).
FigureDaily new cases in and outside China
Source: WHO, China National Health Commission, Difference Group
Chinese containment
Facing a previously unknown virus, China rolled out what the WHO later called “perhaps the most ambitious, agile and aggressive disease containment effort in history.” Here’s how it worked.
Aggressive containment in three phases
The strategy that underpinned the Chinese containment effort started as a national approach, which pushed hard for universal temperature monitoring, masking, and hand washing. When China initiated the quarantine of tens of millions, it was a drastic measure amid a drastic crisis. But at the time, all alternatives were worse.
As the outbreak evolved, deepened and spread, more knowledge was gained. That’s when China took a science and risk-based approach to tailor the implementation.
Finally, specific containment measures were adjusted to the provincial, county and even community context, the capacity of the setting, and the nature of novel coronavirus transmission there.
Leadership and solidarity
It was the deep commitment of the Chinese people to collective action, which was devised and implemented by the Chinese leaders, that made possible broad containment and its enforcement – but not just at the national level.
Critically, remarkable solidarity was achieved in provinces and cities in support of the most vulnerable populations and communities. Effective at national, provincial and municipal levels, it was a lesson about the power of collective solidarity and multi-level governance cooperation, as opposed to disunity and friction.
What impressed many international observers who visited China at the time was the simple fact that, despite ongoing outbreaks in their own areas, Chinese governors and mayors continued to send thousands of health care workers and tons of vital personal protection equipment supplies into Wuhan, the epicenter of the crisis, and its surrounding province Hubei. In the battle against the coronavirus, we are only as strong as our weakest links.
Resolute determination
It wasthis bold approach to contain the rapid spread of the novel respiratory pathogen that changed the course of the rapidly escalating epidemic. What seemed to be a crushing plague-like disaster that would first spread through Hubei across China, then through Asia and the rest of the world was subdued in weeks.
As WHO’s executives like to point out, when their mission first arrived in China, there were almost 2,500 newly confirmed cases daily. Two weeks later, when they left, the number of new cases had shrunk to barely 400 – to less than a fifth.
Here’s why it’s so impressive: Outside China, the number of daily new cases was also about 2,500 by March 3. Today, that figure is not falling but soaring – and almost four times higher.
So, that’s the Chinese approach in a nutshell: Try to contain the crisis aggressively in phases. Foster leadership, bolster solidarity. Act decisively and with determination.
It sounds easy but it’s not. And no approach is devoid of mistakes; but what really matters is how quickly one can learn from those mistakes.
People before GDP
When Italy on March 9 imposed a national quarantine over some 60 million people, it has the potential to delay the spread and reduce the number of the infected in Italy and Europe, and internationally. If that costly decision had not been made, the repercussions would have been disastrous to Italy, Europe and the world.
It was also a lesson from China. When Beijing imposed the cordon sanitaire around Wuhan and neighboring municipalities on January 23, 2020, it was criticized in much of the West as a reflection of “Beijing’s autocratic measures” that would not help but could make the crisis a lot worse.
In reality, the quarantine and all the accompanying measures dramatically delayed and reduced further exportation of the coronavirus to elsewhere in the country, regional proximity and worldwide. That’s why the Chinese blueprint is now adapted elsewhere, when alternatives are few and rare.
Every country can learn from the Chinese experience, but all must also adjust those lessons to local conditions. Not every country is in a comparable situation, but no country can any longer avert a virus impact.
In China, economic development is seen as critical to the country’s future. But ultimately, Chinese leaders are not accountable to cold GDP figures. People come first.
It is thanks to that mindset that China is now busy getting back to business, working to bolster the economy with accommodative monetary and fiscal policies, while reopeningschools and trying to contain the remaining chains of transmission. As the populous country is moving from containment to the mitigation stage, the real challenge will be to contain new imported cases in the borders, while quickly extinguishing any potential new virus cluster at home.
There are no miracle cures against dangerous viruses. But some lessons are better than others. This is neither the first nor the last global pandemic. We can’t afford to learn too slowly.
About the Author:
Dr. Dan Steinbock is an internationally recognized strategist of the multipolar world and the founder of Difference Group. He has served at the India, China and America Institute (USA), Shanghai Institutes for International Studies (China) and the EU Center (Singapore). For more, see https://www.differencegroup.net
By TheTechnicalTraders – This is one of those articles that are packed with resources showing your what to expect for various assets both long-term and short-term and will guide you through these volatile times and this year.
Our friends and followers continue to contact us asking what to expect and what should they be doing with their assets and trades? Our research and analysis have been very clear up to this point; we warned of a Zombie Rally in early November and early December 2019, we warned that Oil would fall below $40 on November 15, 2019, and we warned of a global Black Swan event on January 26, 2020.
All of this research, in addition to our other research, was very clear that we believed the upside price rally that began in September/October 2019 was a “Zombie-like” price advance that didn’t have a supporting fundamental or technical foundation. We were warning clients and followers to use this advance as a means to move away from risk and into more of a cash position – in preparation for a future event that we believed was setting up. One of the clearest examples of our research team attempting to prepare our followers for what we expected in early 2020 was this post.
On Friday I was on TV “live from NASDAQ with TD Ameritrade” talking about the technical breakdown on the charts and what to expect here
S&P 500 Topping Chart Pattern
This article highlighted our belief that a major topping pattern was set up and that this same price pattern happened just before other major peaks in the US stock market. The Stealth, Awareness, and Mania Phases seemed to be in place – the only thing left was the Blow Off Phase.
This article, today, is going to attempt to share some additional research data developed by our team to help you better understand the potential future outcome of this unfolding event. As with anything we share related to making future price predictions or analysis, this is all based on our research team’s understanding of various global economic fundamentals and expectations related to capital functions throughout the global economic environment.
Be sure to opt-in to our free market trend signals before closing this page, so you don’t miss our next special report!
Let’s get started…
FED Fund Rate & Expectations
First, we want to share with you our modeling of the US economy and the Fed Funds Rate Optimal Levels which will assist all of us in understanding the future expectations and actions by the US Fed related to future economic modeling. This chart, created by our research team in early 2018, attempts to model the optimal US Fed Funds Rate (FFR) levels based on a decline in population and GDP while US Deficits also decline moderately after 2020 – in other words, more of the same type of global economic functions.
If the Covid-19 virus pushes the GDP lower while government expenses increase and consumer spending/activity decreases, we believe this model is most likely a proper representation of what to expect by the US Fed going forward. As you can see, this modeling system draws an expected FFR level in BLUE, a high variance level in PINK and a low variance level in GREY/TURQUOISE. After the near-zero rates after the 2008-09 credit crisis, our model expected the Fed to begin raising rates in 2013 and for rates to peak near 2017. We believe the US Fed was behind the curve in their actions to adjust the FFR levels throughout most of the past 8+ years. Although, The US Fed has positioned current rates very near to where our predictive modeling system expects for 2020; between 1.25~1.50%.
The future of this model suggests the US Fed will normalize rates near 1.0% as early as 2022 or 2023 and keep rates near 1.0% until sometime near 2027 or so. This model suggests a substantial advance in the US stock market may take place sometime between 2022 and 2028 – before it appears the US Fed will have to address another type of crisis event in near late 2028, or 2029, or early 2030.
How this chart plays into the current Covid-19 expectations is simple, the US Fed will have to attempt to lower rates while stimulating the US and global economies in conjunction with other Central Banks. This modeling system does not take into consideration a pandemic event or other type of Black Swan event. It does take into consideration modeled optimal levels based on a decrease in population, a decrease in GDP and an increase in US Deficits.
Concluding Thoughts:
The point of this article is to share some of our data and our future expectations with you, our friends and followers. As we continue to post additional sections/parts of this article, we’ll dig deeper into our research and forward expectations. Remember, we’ve just highlighted two charts that show potential global economic expectations well into and past 2030. We’ve also shared some predictive modeling that suggests a period between 2021~22 and 2027 should be relatively calm and trendy (likely Bullish) for the US markets. Keep this in mind as we continue our future article posts.
The type of market condition I think we have entered could be here for a while, a year or three, and it’s going to be a traders market, which means you must have a trading strategy, plan your trades, and trade your plan. It’s amazing how simple a few trading rules are written down on paper can save you thousands of dollars a year from locking in gains, or cutting losses. I have this mini trading strategy mastery course if you want to take control of your trades and override your emotional issues. It’s easy to hold winners until they turn into losers, taking to large of a position, or maybe you have masted the art of buying high and selling low repeatedly? Yikes! It happens to most traders, and it can easily be overcome with a logical game plan I cover in the crash course, pun intended ?
In short, if you have lost money with your trading account this year, holding some big losing trades that were big winners just a couple of weeks ago, I think it’s worth joining my trading newsletter so you can stay on top of the markets. I take the loud, emotional, and complex market and deliver simple common sense commentary and a couple of winning trades each month.
My trading is nothing extreme or crazy exciting because I’m not an adrenaline trading junky. I only want to grow my entire portfolio 2-4% a month with a couple of conservative ETF trades. Making 22%-48% return on my capital every year without the stress of being caught up in this type of market, feeling like I always need to be in a trad, and knowing I have a proven bear market trading strategy incase this market continues to fall is crucial for capital preservation, and my health.
As a technical analysis and trader since 1997, I have been through a few bull/bear market cycles. I believe I have a good pulse on the market and timing key turning points for short-term swing traders.
Visit my ETF Wealth Building Newsletter and if you like what I offer, and ride my coattails as I navigate these financial markets and build wealth while others lose nearly everything they own during the next financial crisis.