Author Archive for InvestMacro – Page 69

The US Reports New Economic Incentives

by JustForex

Yesterday, the US dollar fell again relative to a basket of major currencies. The dollar index (#DX) closed in the negative zone (-0.96%). US authorities have agreed on an incentive package to mitigate the economic impact of the coronavirus outbreak. Reportedly, the total aid volume will amount to about $2 trillion. According to the plan, the text of the agreement will be presented on Wednesday evening. Also, US President Donald Trump wants to end quarantine by mid-April, but the Department of Health is opposed. WHO said on Tuesday that there was a “very large acceleration” in the coronavirus spread in the United States.

On Wednesday, China reported a decrease in the number of newly confirmed cases of coronavirus due to a slowdown in the “importation” of the infection from the outside and the absence of locally transmitted cases. According to the National Health Commission of the PRC, 47 new cases were registered yesterday, all of which are related to people who returned from abroad, while a day earlier 78 new cases were recorded.

The “black gold” prices are growing. Currently, futures for the WTI crude oil are testing the $23.45 mark per barrel. At 16:30 (GMT+2:00), US crude oil inventories will be published.

Market indicators

Yesterday, there were aggressive purchases in the US stock market: #SPY (+9.06%), #DIA (+11.02%), #QQQ (+7.74%).

The 10-year US government bonds yield fell again. At the moment, the indicator is at the level of 0.83-0.84%.

The news feed on 2020.03.25:
  • – German IFO business climate index at 11:00 (GMT+2:00);
  • – Core durable goods orders in the US at 14:30 (GMT+2:00).

by JustForex

The Analytical Overview of the Main Currency Pairs on 2020.03.25

by JustForex

The EUR/USD currency pair

Technical indicators of the currency pair:
  • Prev Open: 1.07280
  • Open: 1.07851
  • % chg. over the last day: +0.62
  • Day’s range: 1.07604 – 1.08404
  • 52 wk range: 1.0777 – 1.1494

The EUR/USD currency pair keeps consolidating. There is no defined trend. Yesterday, Germany and EU published quite weak data on business activity. US senators and White House officials reached an agreement on an incentive package to mitigate the economic impact of the COVID-19 virus pandemic. The total aid volume will amount to about $2 trillion. At the moment, EUR/USD quotes are consolidating in the range of 1.07200-1.08600. The current technical picture signals a possible correction of the trading instrument. Open positions from key levels.

The Economic News Feed for 25.03.2020:

    • – German IFO business climate index – 11:00 (GMT+2:00);
    • – Durable Goods Orders (US) – 14:30 (GMT+3:00);
EUR/USD

Indicators do not give an accurate signal: 50 MA crossed 100 MA.

The MACD histogram has started to rise, indicating that EUR/USD quotes are recovering.

The Stochastic Oscillator is located in the neutral zone, the line %K is below the line %D, which gives a sell signal for EUR/USD.

Trading recommendations
      • Support levels: 1.07200, 1.06350
      • Resistance levels: 1.08600, 1.09550, 1.10600

If the price fixes above 1.08600, the correction of the EUR/USD currency pair is expected toward 1.09400-1.11000.

Alternatively, the quotes could descend toward 1.06500-1.06000.

The GBP/USD currency pair

Technical indicators of the currency pair:
  • Prev Open: 1.15087
  • Open: 1.17432
  • % chg. over the last day: +1.81
  • Day’s range: 1.17403 – 1.19276
  • 52 wk range: 1.1466 – 1.3516

GBP/USD quotes went up after a significant collapse. During yesterday’s and today’s trades sterling added over 400 points. At the moment, the currency pair GBP/USD is testing resistance level 1.19300. The mark 1.17200 is already a mirror support. The trading instrument can correct further. We recommend you to monitor the current information about the coronavirus pandemic and its impact on the global economy. Open positions from key levels.

The Economic News Feed for 25.03.2020 is calm.

GBP/USD

The indicators signal the power of buyers: the price has fixed above 50 MA and 100 MA.

MACD histogram is in the positive zone, which indicates a bullish sentiment.

The Stochastic Oscillator is located in the overbought zone, the %K line crossed the %D line. No signals at the moment.

Trading recommendations
  • Support levels: 1.17200, 1.14500
  • Resistance levels:1.19300, 1.21350, 1.22800

If the price fixes above 1.19300, expect further correction toward 1.21000-1.21500.

Alternatively, the quotes could descend toward 1.16000-1.15000.

The USD/CAD currency pair

Technical indicators of the currency pair:
  • Prev Open: 1.45076
  • Open: 1.44658
  • % chg. over the last day: -0.25
  • Day’s range: 1.42955 – 1.44830
  • 52 wk range: 1.2949 – 1.4668

The USD/CAD currency pair has moved down. The trading instrument has updated the local lows. Currently, the CAD is testing the round level of 1.43000. The mark 1.44500 is the nearest resistance. The technical picture signals a further correction of USD/CAD quotes. We recommend you to pay attention to the “black gold” price dynamics. Open positions from key levels.

The Economic News Feed for 25.03.2020 is calm.

USD/CAD

The indicators signal the sellers’ strength: the price has fixed below 50 MA and 100 MA.

MACD histogram is in the negative zone and continues to decline, which indicates a bearish sentiment.

The Stochastic Oscillator is located in the oversold area, the %K line crossed the %D line. There are no signals at the moment.

Trading recommendations
  • Support levels: 1.43000, 1.41500, 1.40000
  • Resistance levels: 1.44500, 1.45550, 1.46600

If the price fixes below 1.43000, expect further correction to 1.42000-1.41000.

Alternatively, the quotes could grow toward 1.45000-1.46000.

The USD/JPY currency pair

Technical indicators of the currency pair:
  • Prev Open: 111.222
  • Open: 111.328
  • % chg. over the last day: +0.05
  • Day’s range: 110.752 – 111.568
  • 52 wk range: 101.19 – 112.41

USD/JPY currency pair is still in a sideways movement. There is no defined trend. Financial markets participants are waiting for additional drivers. Currently, the following local support and resistance levels can be distinguished: 110.200 and 111.600, respectively. Technical correction of a trading instrument is not ruled out in the nearest future. We recommend you to pay attention to the dynamics of US government bonds yield. Open positions from key levels.

The Economic News Feed for 25.03.2020 is calm.

USD/JPY

Indicators do not give accurate signals: the price is consolidating near 50 MA.

Histogram of MACD is in positive zone, which indicates a bullish sentiment.

The Stochastic Oscillator is located in the neutral zone, the %K line crosses the %D line. No signals at the moment.

Trading recommendations
  • Support levels: 110.200, 109.300, 108.500.
  • Resistance levels: 111.600, 112.000

If the price fixes below 110.200, expect the quotes to correct toward 109.300-108.500.

Alternatively, the quotes will grow toward 112.000-112.500.

by JustForex


Fibonacci Retracements Analysis 25.03.2020 (GBPUSD, EURJPY)

Article By RoboForex.com

GBPUSD, “Great Britain Pound vs US Dollar”

As we can see in the daily chart, GBPUSD is trying to fix below the low at 1.1958. At the same time, the current slight growth may be considered as a test of the broken low from below and a rising correction. After finishing the pullback, the pair may continue falling towards the post-correctional extension area between 138.2% and 161.8% fibo at 1.1366 and 1.0996 respectively. the resistance is 61.8% fibo at 1.2552.

GBPUSD_D1
Risk Warning: the result of previous trading operations do not guarantee the same results in the future

In the H1 chart, the convergence made the pair reverse and correct upwards to reach 23.6% fibo. The next upside targets may be 38.2% and 50.0% fibo at 1.2095 and 1.2305 respectively. the support is the low at 1.1409.

GBPUSD_H1
Risk Warning: the result of previous trading operations do not guarantee the same results in the future

EURJPY, “Euro vs. Japanese Yen”

As we can see in the daily chart, after testing the low at 115.86 and rebounding from it, EURJPY may start a new long-term rising impulse. Right now, the pair is trying to break the resistance at 38.2% fibo (120.19). If the pair succeeds, it may grow to reach the fractal high at 122.87. If this level is broken as well, the instrument may start a new long-term growth with the first target at 38.2% fibo (124.13).

EURJPY_D1
Risk Warning: the result of previous trading operations do not guarantee the same results in the future

In the H4 chart, the pair is re-approaching 38.2% fibo at 120.19. In the future, the instrument is going to break this level. It’s only a matter of time.

EURJPY_4H

Article By RoboForex.com

Attention!
Forecasts presented in this section only reflect the author’s private opinion and should not be considered as guidance for trading. RoboForex LP bears no responsibility for trading results based on trading recommendations described in these analytical reviews.

Forex Technical Analysis & Forecast 25.03.2020

Article By RoboForex.com

EURUSD, “Euro vs US Dollar”

After forming the ascending impulse towards 1.0887 and completing the correction at 1.0744, EURUSD is moving upwards. If later the price breaks 1.0815 to the upside, the market may continue growing towards 1.0943; if 1.0740 to the downside – resume trading downwards with the target at 1.0700.

EURUSD
Risk Warning: the result of previous trading operations do not guarantee the same results in the future

GBPUSD, “Great Britain Pound vs US Dollar”

GBPUSD has finished the ascending impulse towards 1.1800; right now, it is consolidating below this level. Possibly, the pair may break this level to the upside and then trade upwards to reach 1.1910. After that, the instrument may break the latter level as well and then continue growing with the target at 1.2145.

GBPUSD
Risk Warning: the result of previous trading operations do not guarantee the same results in the future

USDCHF, “US Dollar vs Swiss Franc”

After finishing the correction towards 0.9842, USDCHF is falling to break 0.9760. Later, the market may continue trading downwards with the short-term target at 0.9686.

USDCHF
Risk Warning: the result of previous trading operations do not guarantee the same results in the future

USDJPY, “US Dollar vs Japanese Yen”

USDJPY is still consolidating around 110.70; it has expanded the range up to 111.70 and right now it falling to test 110.70 from above. After that, the instrument may start another growth to reach 111.90 and then form a new descending structure with the target at 110.70.

USDJPY
Risk Warning: the result of previous trading operations do not guarantee the same results in the future

AUDUSD, “Australian Dollar vs US Dollar”

AUDUSD is still trading upwards to reach 0.6136. After that, the instrument may correct to the downside with the target at 0.5822.

AUDUSD
Risk Warning: the result of previous trading operations do not guarantee the same results in the future

USDRUB, “US Dollar vs Russian Ruble”

USDRUB is falling towards 78.38. Later, the market may break this level and continue trading downwards with the short-term target at 76.02.

USDRUB
Risk Warning: the result of previous trading operations do not guarantee the same results in the future

USDCAD, “US Dollar vs Canadian Dollar”

USDCAD is falling. Possibly, today the pair may reach 1.4333 and then consolidate below it. After that, the instrument may break 1.4333 to the downside and continue the descending wave with the target at 1.4171.

USDCAD
Risk Warning: the result of previous trading operations do not guarantee the same results in the future

XAUUSD, “Gold vs US Dollar”

After completing the ascending structure at 1577.50 and forming a new consolidation range around it, Gold has broken the range to the upside. Possibly, the pair may continue trading upwards. Today, the price may reach 1650.50 and then start another correction with the target at 1577.50.

GOLD
Risk Warning: the result of previous trading operations do not guarantee the same results in the future

BRENT

Brent is still consolidating around 27.77. Today, the pair may grow to break 28.70 and then continue trading upwards with the target at 30.80.

BRENT
Risk Warning: the result of previous trading operations do not guarantee the same results in the future

BTCUSD, “Bitcoin vs US Dollar”

BTCUSD is consolidating around 6500.00. The main scenario implies that the instrument may resume growing to reach 7500.00 and then correct towards 5700.00. After that, the instrument may start another growth with the target at 7000.00.

BITCOIN

Article By RoboForex.com

Attention!
Forecasts presented in this section only reflect the author’s private opinion and should not be considered as guidance for trading. RoboForex LP bears no responsibility for trading results based on trading recommendations described in these analytical reviews.

Gold holding above 1,440/450, but the risk of a downward break remains

By Admiral Markets

Economic Events March 25

Source: Economic Events March 25, 2020 – Admiral Markets’ Forex Calendar

The situation in Gold remains very tense, even though it is holding above 1,440/450 USD, which is a positive sign from a technical perspective.

While Gold, given the recent developments around the massive monetary stimulus from the Fed on March 15, stays bullish in the mid- to long-term (especially after the March 23 Fed announcement to go for “QE Infinity” making a run above 2,000 USD only a question of time), the short-term picture is bearish and selling pressure on the precious metal is likely to persist.

The reason for that is the US dollar. The Fed emergency statement on March 15 pointed to the re-installation of swap lines with global central banks.

To make long things short: this step clearly aims to make sure that global central banks have enough USD available, overcome the current USD shortage in global financial markets.

That said, we expect the demand for the greenback to stay high. The same should be expected in regards to the pressure on credit markets, forcing further liquidations, also in Gold, in our opinion.

If in addition to that, if the Durable Goods Orders come in better than expected, US yields could see another lift and a deeper corrective move back above 1% in 10-year US Treasuries could be seen.

Out of this, a short-term a drop below 1,440/450 USD would technically darken the picture, activating 1,250/260 USD as a first target.

Gold Daily chart

Source: Admiral Markets MT5 with MT5-SE Add-on Gold Daily chart (between December 21, 2018, to March 24, 2020). Accessed: March 24, 2020, at 22:00pm GMT – Please note: Past performance is not a reliable indicator of future results, or future performance.

In 2015, the value of Gold fell by 10.4%, in 2016, it increased by 8.1%, in 2017, it increased by 13.1%, in 2018, it fell by 1.6%, in 2019, it increased by 18.9%, meaning that after five years, it was up by 28%.

Discover the world’s #1 multi-asset platform

Admiral Markets offers professional traders the ability to trade with a custom, upgraded version of MetaTrader 5, allowing you to experience trading at a significantly higher, more rewarding level. Experience benefits such as the addition of the Market Heat Map, so you can compare various currency pairs to see which ones might be lucrative investments, access real-time trading data, and so much more. Click the banner below to start your FREE download of MT5 Supreme Edition!

Download MetaTrader 5 and begin trading today!

Disclaimer: The given data provides additional information regarding all analysis, estimates, prognosis, forecasts or other similar assessments or information (hereinafter “Analysis”) published on the website of Admiral Markets. Before making any investment decisions please pay close attention to the following:

  1. This is a marketing communication. The analysis is published for informative purposes only and are in no way to be construed as investment advice or recommendation. It has not been prepared in accordance with legal requirements designed to promote the independence of investment research, and that it is not subject to any prohibition on dealing ahead of the dissemination of investment research.
  2. Any investment decision is made by each client alone whereas Admiral Markets shall not be responsible for any loss or damage arising from any such decision, whether or not based on the Analysis.
  3. Each of the Analysis is prepared by an independent analyst (Jens Klatt, Professional Trader and Analyst, hereinafter “Author”) based on the Author’s personal estimations.
  4. To ensure that the interests of the clients would be protected and objectivity of the Analysis would not be damaged Admiral Markets has established relevant internal procedures for prevention and management of conflicts of interest.
  5. Whilst every reasonable effort is taken to ensure that all sources of the Analysis are reliable and that all information is presented, as much as possible, in an understandable, timely, precise and complete manner, Admiral Markets does not guarantee the accuracy or completeness of any information contained within the Analysis. The presented figures refer that refer to any past performance is not a reliable indicator of future results.
  6. The contents of the Analysis should not be construed as an express or implied promise, guarantee or implication by Admiral Markets that the client shall profit from the strategies therein or that losses in connection therewith may or shall be limited.
  7. Any kind of previous or modeled performance of financial instruments indicated within the Publication should not be construed as an express or implied promise, guarantee or implication by Admiral Markets for any future performance. The value of the financial instrument may both increase and decrease and the preservation of the asset value is not guaranteed.
  8. The projections included in the Analysis may be subject to additional fees, taxes or other charges, depending on the subject of the Publication. The price list applicable to the services provided by Admiral Markets is publicly available from the website of Admiral Markets.
  9. Leveraged products (including contracts for difference) are speculative in nature and may result in losses or profit. Before you start trading, you should make sure that you understand all the risks.

By Admiral Markets

The Human Costs of COVID-19 Unpreparedness in US and Europe

By Dan Steinbock

– As President Trump recently discovered, the novel coronavirus cannot be “talked down.” Delays and unpreparedness in the US and Europe are proving costly to the rest of the world in terms of public health and economic damage.

The epicenter of the novel coronavirus outbreak is now in Europe and the United States, where the number of the infected may soon exceed those in Italy and China, respectively. Since complacency and inadequate preparedness prevailed outside China until recently, the human costs of the global pandemic are accelerating.

By calling the virus “Chinese,” even against the reprimand of the WHO, the Trump administration is appealing to the worst racial instincts, thereby contributing to hate speech, stigmatization, as well as anti-Chinese and anti-Asian incidents in America.

The White House hopes to disguise its inadequate preparedness, followed by the failure in containment and local testing (which has barely started).

On March 16, the New York Times released a balanced investigative report about the Trump administration’s mishandled virus response. A day later, the administration shared with the Times its pandemic report. Ostensibly, the White House hoped to show it was in control.

But timelines reveal tell a different story.

Costly complacency

Even though the leading US health executives had been monitoring the crisis since early January and the first COVID-19 case was confirmed in the state of Washington on January 20, followed by the WHO alerts, White House failed to act upon pressing evidence – even against the warnings of the US national intelligence community.

Not so long ago, Trump’s still said publicly that any danger would pass by April 1. When he finally understood the risks, he botched his error-ridden Oval Office virus address and the subsequent mistake-ridden Rose Garden address. Until mid-March, the infection enjoyed a relatively free ride in America.

The pandemic report was clear about the consequences: “A pandemic will last 18 months or longer and could include multiple waves of illness… Increasing COVID -19 suspected or confirmed cases in the U.S. will result in increased hospitalizations among at-risk individuals, straining the health care system.” Shortages would ensue.

In the UK, comparable stumbling has caused a similar debacle, which Prime Minister Boris Johnson has tried hard to express in optimistic terms: “We can turn the tide within the next 12 weeks.” Yet, that cannot be achieved without restrictive measures, which, in turn, could have been launched weeks ago.

In contrast, German Chancellor Angela Merkel has been blunt: “Not since World War II has our country faced a challenge that has required such a high degree of common and united action. We can succeed as long as everyone truly understands what’s needed.”

What could have been a multi-month pandemic has now potential to become a multi-year challenge.

Explosion of new cases in the US and Europe

The cold reality is that the US and Europe are mobilizing with a delay of 4 to 8 weeks. As the number of accumulated confirmed cases worldwide is approaching half a million, new cases are increasing by more than 40,000 daily; that is, nearly four times faster than just one week before.

In the worst phase of the Chinese outbreak, the comparable acceleration was barely 4,000; that is, only a tenth of the acceleration outside China today. This escalation is largely attributable to the virus situation in Europe and the US, where the number of accumulated cases will soon exceed that in China.

Assuming that new cases in China will remain low and imported cases can be quarantined; the volume of accumulated cases could remain less than 85,000 at the end of April. But if cases will continue to soar by 40,000 daily outside China – particularly in the US and Europe – through April, worldwide cases would soar to some 1.8 million (Figure).

Figure    One trendline scenario (through April 2020)

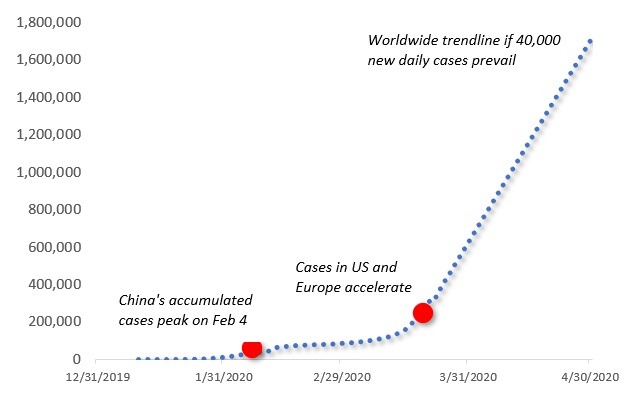
Source: Difference Group; data from WHO

Over time, such a scenario could translate to huge collateral damage in emerging Middle East, Latin America, Asia and Africa – through plunges in world finance, trade, investment, and migration.

However, since such a projection is based on current acceleration and steady increases, it is only one possible scenario. In reality, the final figure will prove lower, if the acceleration slows down – or even higher, if it doesn’t.

Cooperation vital to preempt new virus waves, outbreaks

After the restrictive measures are phased out in major economies, certain countries are likely to record odd spikes in death rates, particularly in the virus risk groups. It is a discrete modern-day version of the old eugenics, which permits certain policymakers in the West to bury their mistakes, literally.

As poorly-enforced quarantines are phased out in these countries, flows of people, many of which may be asymptomatic, will start traveling again. Eventually, they will show up in the borders of countries that have managed the crisis relatively successfully – as evidenced by recent spikes of imported cases in China, Singapore and Hong Kong.

What is desperately needed to avoid further nightmare scenarios is multipolar cooperation among major economies and across political differences. In this quest, China, where containment measures have been successful, can show the way, along with major advanced and emerging powers.

Effective global cooperation is urgently needed to reduce the subsequent collateral damage.

About the Author:

Dr. Dan Steinbock is an internationally recognized strategist of the multipolar world and the founder of Difference Group. He has served at the India, China and America Institute (USA), Shanghai Institutes for International Studies (China) and the EU Center (Singapore). For more, see https://www.differencegroup.net

This commentary is an updated part of Dr Steinbock’s COVID-19 briefing on March 16, released as “The Global Coronavirus Contraction” by the World Financial Review (March/April) on March 23, 2020


Why Global Investors Should Pay Attention to “Non-Confirmations”

By Elliott Wave International

When a trend is strong, related markets tend to move in unison.

However, when a trend is near exhaustion — a bullish or bearish trend, “non-confirmations” often occur. A non-confirmation occurs when one market makes a new high (or low), but a related market does not.

As cases in point, our November Global Market Perspective discussed the details of the non-confirmations in Europe as it showed two charts. Here’s the first:

The Euro Stoxx 50, the DAX and the FTSE 100 (top three graphs) have so far failed to confirm new multi-year highs in the CAC 40 and the Swiss Market Index (bottom two graphs).

Here’s the second chart with continued commentary:

The chart depicts [a] critical loss of juice in Britain’s higher-beta indexes. Notice that while the FTSE 100 is off 6% since its May 2018 high, the Small-Cap index and the AIM 100 are down 9% and 23%, respectively. These non-confirmations are important, because markets almost always splinter when big changes in social mood are afoot. … It’s only a matter of time before the broad indexes abandon the bull-market party.

As we all know, abandon it they did — big-time!

The media blamed the big plunge in global stock market values on the coronavirus.

Yet, it’s notable that our global analysts’ forecast for the end of Europe’s “bull-market party” occurred about two months before the coronavirus flared up in China — and six weeks before the outbreak hit Europe.

So, clearly, our bearish European forecast was not based on the coronavirus.

Elliott Wave International analysts base their financial forecasts on the Elliott wave model plus technical and sentiment indicators, not the news.

As the Wall Street classic Elliott Wave Principle: Key to Market Behavior by Frost & Prechter noted:

Sometimes the market appears to reflect outside conditions and events, but at other times it is entirely detached from what most people assume are causal conditions. The reason is that the market has a law of its own. It is not propelled by the external causality to which one becomes accustomed in the everyday experiences of life. The path of prices is not a product of news. Nor is the market the cyclically rhythmic machine that some declare it to be. Its movement reflects a repetition of forms that is independent both of presumed causal events and of periodicity.

Now is the time to get insights into what really governs the path of stock market prices — the Wave Principle.

You can do so by reading the online version of Elliott Wave Principle: Key to Market Behaviorfree. This free access to the Wall Street classic is available when you join Club EWI. Membership is also 100% free.

You can have this “must read” book on your computer screen in just moments. Get started.


Concerned About The Real Estate Market? Me Too – Part III

By TheTechnicalTradersOur continuing research into the state of the Real Estate market suggests the Covid-19 virus event will likely put extreme pressure on many sectors within the US and global markets.  This, Part III of a multi-part research article, will highlight many of the key economic data points that will soon be released and how these numbers may shock the markets.  Additionally, as consumers and businesses prepare for an extended shutdown, it is important to understand the psychological process that takes place in the minds of people.  PART I, PART II

Initially, people naturally hope for a quick and reasonable solution.  As the process continues where an extended shutdown of the US economy persists, consumers and business managers change their expectations from optimism for a quick resumption of economic activity to “how do we survive this extended closure event”.  This is when traders and investors really need to pay attention to what is happening in their local and national economies.   One of the most important things to consider throughout an event like this is to watch how your local economy is operating and what is happening with local consumers.  This will help you understand what is happening elsewhere.

Demand for certain items will continue almost as normal.  We call this the Personal Consumer Essentials.  These items are typically things like toilet paper, toothpaste, over the counter medications, underwear, food, and water.  These are the types of purchases that must continue for average people to survive this type of event.  Luxury items, vacations, extras, and other purchases may suffer throughout this process.

The first 30 days will likely be a transition period for many consumers.  Remember, this is still the “hope” phase where consumers and business managers believe the entire thing will be over in 15 to 20 days and everything will go back to normal.  We really need to start to watch how China is engaging in trying to restart their economy and how other nations are dealing with the virus contagion.  Maybe the US will regain economic activity faster than other nations – maybe not.  The key to all of this is when consumers and business managers feel confident enough to engage in opportunistic growth investments and purchases – not just survival purchases.

Let’s take a look at some of the key economic data that will be presented over the next 15+ days… But first, be sure to opt-in to our free market trend signals before closing this page, so you don’t miss our next special report!

Consumer Spending

If consumer spending falls below 0.5% for an extended period of time, the largest part of the US GDP calculation will have essentially vanished (consumers).  This will result in decreased economic activity, taxes, income and have far-reaching economic complications across the globe.  It is our belief that the initial phase of the US shutdown sparked a decent wave of consumer spending for survival supplies.  As we move further into this shutdown event, we believe Consumer Spending could easily fall below 0.5% for an extended period of time – possibly many months.

Source: https://www.investing.com/economic-calendar/real-consumer-spending-914

Jobless Claims

We expect Jobless claims to skyrocket.  We are hearing from local sources that the true number of unemployed in the US as a result of this virus event could be well above 4+ million right now.  It will take time for these people to process into the system – so this will be an interesting number to watch.  This number could send a shock-wave throughout the investment community as an extended rise in the jobless claims values would suggest a very deep recession is setting up.  No jobs, no income, no asset appreciation  – it’s simple.

https://www.investing.com/economic-calendar/initial-jobless-claims-294

Personal Income

Personal Income has fallen into severely negative territory only a few times over the past 30+ years.  We believe income levels will play an important role in understanding the true scope of this potential economic event and how to plan for a potential Real Estate collapse in the future.  If you are following our logic in posting these data points, you’ll quickly understand that Consumer Spending is related to a psychological consumer belief (either opportunistic or survival).  This psychological belief is related to having a job and a solid source of income.

In the past, we’ve often referred to the global economy as a “living being” operating in a localized environment – like a plant.  Typically, if the environment is healthy and abundant, the plant adopts a “growth phase” where it attempts to flower and expand into the environment.  If the environment is unhealthy, the plant changes into a “survival phase”  where it attempts to shed unneeded shoots and stems while trying to simply survive the unhealthy environment.  The plant can’t get up and walk to a better environment – it is forced to operate in either of these modes because it has no other choices.

Within a global event like the Covid-19 virus event, we are like these plants that I’m describing.  We can’t pack up and move to a better environment – we just have to deal with the phases and processes that are taking place within our environment – hoping to survive enough to be able to grow when the environment gets more healthy.

If personal income collapses, consumers will shift into a survival mode much quicker.  This is similar to the environment turning completely toxic over just a few days.

https://www.investing.com/economic-calendar/personal-income-234

Non-Farm Payroll

Non-Farm Payroll data will also help us understand how toxic the economic environment has become in the US.  We purposely included the 2008-09 data on this chart to show you how the payroll data turned negative in late 2007 and early 2008 – well before the collapse really started to happen.  With the Covid-19 event taking place, we believe the process will be much quicker and violent.  If the nation-wide shutdown continues for more than 60+ days and/or the spread of the virus is not under some type of containment within the next 60 to 90+ days, the damage to the jobs market could be extensive.  That translates into the Real Estate market as very bearish.

https://www.investing.com/economic-calendar/nonfarm-payrolls-227

Mortgage Rates

Even though the Fed has dropped interest rates, consumers may not be willing to engage in purchasing homes while this Covid-19 virus event continues.  Home prices are extremely high compared to historical values.  The Case-Shiller home index (below) suggests a move down to the 140~150 level would not be unreasonable – even with interest rates near ZERO again.

https://www.nerdwallet.com/blog/mortgages/current-interest-rates/

Case-Shiller National Home Index

If we are correct and an immediate and rather deep price decline takes place in the US housing market, it will set up a “race to real value” in terms of the market attempting to find what we call the “equilibrium” within the supply/demand curve.

A decrease in the Case-Shiller National Home Price Index to levels near 150~160 would represent a nation-wide price collapse of about 25~35% in the housing market.  Certain segments of the housing market may fall by even more extreme levels whereas other segments may fall by smaller amounts.

We believe the economic reaction related to the Covid-19 virus event will result in a “shock wave” type of collapse as the March 2020 (Q1) data is released in April and May 2020.  We believe the revised expectations and continued battle to contain the virus will continue to place extreme pricing pressure on certain asset values.  Commercial and Residential real estate is some of the largest price assets anyone could purchase and they’ve experienced a solid 8+ year price advance.  It does not seem illogical that a 20% to 30% decline could take place as a result of this Covid-19 virus event.

When you consider the real process of combating this virus event and the destruction that will take place across the US and the global economy over the next 6 to 12+ months, it is very likely that both commercial and residential real estate will fall from current lofty levels to price levels that are closer to the equilibrium of the supply/demand curve.

We also believe that foreclosures will continue to stack up – even if the banks are told not to process foreclosures for a 12 month period of time.  This does not stop the flow of consumers unable to continue their mortgage obligations – it just stops the banks from engaging in near foreclosure activity for a period of time.  The hope is that the markets may settle a bit before banks open the flood gates and start processing these faulty mortgages again.

In the next, last, portion of this research article, we’ll try to share some predictive analysis that may help you understand where the US stock market may find support and where the US real estate market may find a bottom.

As a technical analysis and trader since 1997, I have been through a few bull/bear market cycles. I believe I have a good pulse on the market and timing key turning points for short-term swing traders.

Visit my ETF Wealth Building Newsletter and if you like what I offer, and ride my coattails as I navigate these financial markets and build wealth while others lose nearly everything they own during the next financial crisis.

Chris Vermeulen

TheTechnicalTraders.com

Reality Check on Trading Equities & Precious Metals

By TheTechnicalTraders – As you may or may not know, the markets have a way of making it extremely difficult to trade in general almost all of the time if you do not have a trading plan.

One of the ways the market likes to pull money from traders is through morning opening gaps. For example, yesterday, the inflow of emails about gold, silver, and gold miners was insane. I keep trying to keep everyone in check with how to handle high-risk, high uncertainty, and volatile times, which, for our case right now, is a cash position for a few more days.

Unfortunately, big moves in price trigger emotions with some of you. It causes you to start trading just because you think you need to trade, which can be for many different reasons I won’t get into here. You should know my stance by now, which is cash is a position, and retaining our capital is more important than trading some times.

I know for a fact that all successful traders have a detailed trading plan, they can control their emotions, are logical, and they wait for opportunities vs. jumping at anything that moves more than normal.

Below is our portfolio equity curve, which we hit an all-time new high just days after the stock market started its crash. Maybe if you see what your portfolio growth curve would look like if you followed my trades, you will finally see the value in CASH.

I don’t trade a lot, and we are in cash when we don’t have any positions. Other times we will have 2 or 4 positions open, but it all depends on the market and volatility. You want trading to be simple, boring, and profitable, trust me on this.

PORTFOLIO GROWTH CHART

AVERAGE PORTFOLIO RESULTS THIS YEAR

Ok, enough of that rant, BACK TO MORING PRICE GAPS!
The stock market loves to do most of the day’s price range and profit potential in a way the average trader is not able to catch the move. Even more so, it is trying to get traders the worst entry or exit price.

New members over time will see and understand this when I talk about these gaps getting faded in my morning videos, which I will explain in a minute. For now, let’s take a look at the price of gold and the market sentiment from yesterday.

Yesterday gold traders were acting like a school of piranha’s. A big one day pop in price is like a drop of blood in the water, and it created a feeding frenzy. There was so much momentum going into the closing bell that the market makers will take advantage of this and walk the price up in pre-market trading the next day and try to reach the next resistance level before the opening bell.

This is what happened to gold, and miners this morning.  Market makers know there are still a ton of gold and miner stock buyers out there who are going to BUY as soon as the market opens, so what happens?

The general public pays the high price, way up at resistance, and the market makers get to sell any access shares they have for a huge profit. After that, the price generally fades (falls) back down, and the majority of buyers that day just bought at the high because of pure emotions and a lack of understanding. This happens for gaps to the downside as well in a similar manner.

Now, keep in mind, this is a very short term price action. The gap may fade down over the rest of the session or a few days, but it does not mean the uptrend is the price is finished longer term.

My point is, the market has a way to get you a bad fill MOST of the time if you do not understand how and why the price moves the way it does. Even if you know all this, sometimes we have no choice to pay the price depending on the trade setup if we want to get into a position. I just wanted to share this small tidbit on how the market moves with price gaps because almost all price gaps fill, fade back down to the previous days high for the stock indexes. Commodities gaps don’t always fill, because they are a very different asset class than equities.

My current outlook and thinking for gold, silver, and miners?

In short, gold is the only one in a bull market, and it’s been the definite leader time and time again for the past year almost. It remains in a bull market, and all the money printing/QE, and zero interest rate things are very bullish on metals long term. I like gold a lot, have for a while. I think it’s going higher still as I pointed out in yesterday’s afternoon video, $2600 is my primary target long term. If you didn’t watch yesterdays afternoon video be sure to do so here:

Members video: https://www.thetechnicaltraders.com/memberships/wbn/monday-afternoon-video-update/

As for gold miners and silver, well today is the same story as yesterday, everyone wants to own them and thinks they are missing the train. How you should see these charts and how to best trade them I tell you in yesterday’s afternoon video.

Trading now, in my opinion, is pure speculation and emotionally driven. Sure, you could be right, and this could be the bottom, but as technical traders using rules, logic, and a proven strategy, we are not cowboys trying to pick a bottom to be early. A broken clock is right two times a day. You may get lucky, but because bottom picking without any technical confirmation is a sucker’s (gamblers) game in the long run.

As our portfolio graph above speaks for its self, in that we do not need to catch every move, in fact, we just need to catch a couple of low-risk trades and slowly build our capital.  I was told by one of my mentor traders years ago, once trading becomes slow and boring to you, that’s when you finally understand the market and have a proven trading strategy.

I hope you find this helpful, and if you want this type of info every day, plus my videos, and winning trading strategy, become a member right now!

Chris Vermeulen
Chief Market Strategist

TheTechnicalTraders.com


Ichimoku Cloud Analysis 24.03.2020 (EURUSD, XAUUSD, GBPJPY)

Article By RoboForex.com

EURUSD, “Euro vs US Dollar”

EURUSD is trading at 1.0786; the instrument is moving inside Ichimoku Cloud, thus indicating a sideways tendency. The markets could indicate that the price may test the cloud’s downside border at 1.0715 and then resume moving upwards to reach 1.1070. Another signal to confirm further ascending movement is the price’s rebounding from the downside border of a Triangle pattern. However, the scenario that implies further growth may be canceled if the price breaks the cloud’s downside border and fixes below 1.0650. In this case, the pair may continue falling towards 1.0575. After breaking the pattern’s upside border and fixing above 1.0855, the price may resume moving upwards.

EURUSD
Risk Warning: the result of previous trading operations do not guarantee the same results in the future

XAUUSD, “Gold vs US Dollar”

XAUUSD is trading at 1562.00; the instrument is moving above Ichimoku Cloud, thus indicating an ascending tendency. The markets could indicate that the price may test Tenkan-Sen and Kijun-Sen at 1540.00 and then resume moving upwards to reach 1615.00. Another signal to confirm further ascending movement is the price’s rebounding from the rising channel’s downside border. However, the scenario that implies further growth may be canceled if the price breaks the cloud’s downside border and fixes below 1505.00. In this case, the pair may continue falling towards 1475.00.

GOLD
Risk Warning: the result of previous trading operations do not guarantee the same results in the future

GBPJPY, “Great Britain Pound vs Japanese Yen”

GBPJPY is trading at 128.18; the instrument is moving below Ichimoku Cloud, thus indicating a descending tendency. The markets could indicate that the price may test the cloud’s downside border at 128.65 and then resume moving downwards to reach 122.05. Another signal to confirm further descending movement is the price’s rebounding from the descending channel’s upside border. However, the scenario that implies further decline may be canceled if the price breaks the cloud’s upside border and fixes above 130.65. In this case, the pair may continue growing towards 131.95.

GBPJPY

Article By RoboForex.com

Attention!
Forecasts presented in this section only reflect the author’s private opinion and should not be considered as guidance for trading. RoboForex LP bears no responsibility for trading results based on trading recommendations described in these analytical reviews.