– Our research team continues to dig into underlying patterns and set up in the global markets to assist skilled technical traders in understanding the current Covid-19 virus event and other key technical data. Recently, we’ve authored a number of detailed research articles that we believe helped prepare traders for the events of the past 30 to 90+ days. If you missed them, please take a moment to review some of our critical market research posts:
Today, we are writing about a pattern our research team is seeing in the Gold/Silver ratio which is correlated to the price movement of Gold. What does this mean and how can we profit from this setup? Let’s get started trying to explain this chart pattern/setup.
Gold:Silver Ratio Chart From a New Angle
This first chart highlights the pattern we have identified and how we believe a similar pattern is setting up again in the current market. The setup of the pattern is explained in the text below, but quickly scroll down and look at the first chart and the pink shaded areas “A” to get an idea of what we are talking about.
Prior to “A” Pattern Setup
_ After a moderate price decline in Gold (1996 through 2001), a bottom sets up as the price of Gold begins to base near support.
_ The Gold/Silver ratio (BLUE), falls throughout this pattern setup as both Gold and Silver prices decline somewhat in unison.
The Setup “A”
_ Gold prices begin to rally moderately while pushing the Gold/Silver ratio higher over an extended period of time (from 1999 to 2003: about 4 years).
_ The Gold/Silver ratio peaks and begins to decline in mid-2003 as the price of Gold continues to rally at a bit more accelerated rate.
_ Gold prices begin a parabolic upside price advance in early 2006 after the Gold/Silver ratio collapses about 18% to 20% from the peak level near 82.50.
We believe a similar type of pattern is setting up right now in the metals market and we believe both Gold and Silver will engage in a price advance over the next 10+ months that may be similar to the post-A set up in mid-2003. If you are familiar with what happened in the metals market at that time, Silver began to advance at a faster rate than the price of Gold advanced. This is what caused the Gold/Silver ratio to begin to collapse.
Before you continue, be sure to opt-in to our free market trend signals before closing this page, so you don’t miss our next special report!
Silver Monthly chart from 1993 to 2004
This Silver chart from 1993 to 2004 clearly shows how the price of Silver was reacting throughout the setup prior to “A” and after “A” in the chart (above). Silver began a moderate price advance in 1993 from a level near $3.50 and advanced to a level near $7.50 in 1998. Then, it began a downside price move to reach new lows in 2002. At that point, the markets changed. Gold and Silver began to advance almost in unison with Gold still advancing slightly more than Silver until early/mid-2003. Once Silver broke dramatically higher, in late 2003-04, the Gold/Silver ratio started breaking downward instead of upward. This is the pattern we are seeing in the metals market right now.
We believe the recent rotation in the metals market and the dramatic price divergence between Gold and Silver are setting up another similar type of pattern that could prompt both Silver and Gold to rally upward from current levels by at least 200%.
Current Silver Monthly chart
The extremely deep price retracement on this Monthly Silver chart (below) highlights what we believe is a deep washout low price rotation that is setting up the “disconnect” as we have tried to explain in the Gold/Silver ratio chart and historical Silver chart (above). Yes, Gold also moved dramatically lower over the past 2+ weeks illustrating the shock to the markets that took place as the Covid-19 virus event disrupted the US and global markets. But our researchers believe this dramatic washout low in Silver is setting up a much bigger pattern, longer-term than most people understand.
Recently, news that global precious metals suppliers have received a tremendous surge of orders for the physical stock over the past 2+ weeks (source: https://www.msn.com). In fact, many global suppliers and mints are simply “out of stock” at the moment. This surge in demand changes the dynamics of the market and how we look at the washout low in Silver.
If demand continues to surge, which we have no reason to doubt at this stage of the Covid-19 virus event, and Silver begins to rally as it did in 2002~2005, then the Gold/Silver ratio will begin to collapse just as it did in 2003~2007 (see the first chart – Post “A”). This means the demand for metals is skyrocketing and Silver has suddenly become a more “in demand” physical metal than Gold.
You want a reality check on how to trade gold, silver and the stock market in this type of market condition be sure to check this out.
Current Gold Weekly Chart
We believe the next phase of price action in Gold is a move above $1990 as demand for metals continues to surge. This would represent a 100% Fibonacci price expansion of the last price rally from the lows set in September 2018 (near $1168). It would also represent a rally from the current level of at least +22.50% in Gold. Subsequently, if Silver begins to rally at a greater rate than Gold over this same span of time, Silver could rally to levels above $22 representing a +53% price rally according to our Adaptive Fibonacci Price Modeling system (the CYAN target on the chart above).
Pay attention to the Gold/Silver ratio and the price of Silver compared to Gold over the next 30 to 60+ days. If our research is correct, the current low price of Silver will be a distant memory in less than 60 days and a tandem price advance in both Gold and Silver will propel the metals much higher. How much higher? From 2003 to the peak in 2011, Gold rallied 450% (from $350 to over $1900). Over that same span of time, Silver rallied 1024% (from $4.50 to just under $50).
If we are right about this pattern setup and the future opportunities it may present, we could see Silver trading above $160 per ounce within 4 to 7 years. Can you guess where Gold would likely be trading if Silver rallied 1000% from current levels? We already have our positions established and our targets setup. Don’t miss this next big move in the metals.
As a technical analysis and trader since 1997, I have been through a few bull/bear market cycles. I believe I have a good pulse on the market and timing key turning points for short-term swing traders.
Visit my ETF Trading Newsletter and if you like what I offer, and ride my coattails as I navigate these financial markets and build wealth while others lose nearly everything they own during the next financial crisis.
Gasoline demand likely to fall to levels not witnessed since Nixon era
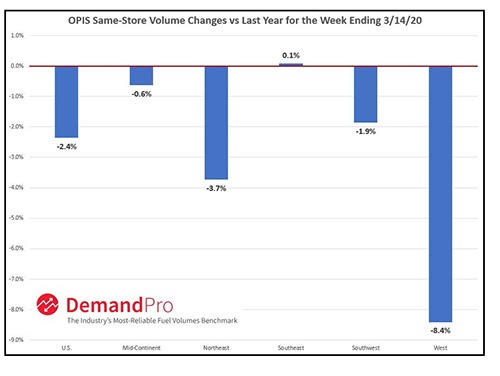
Gaithersburg, Md. (March 27, 2020) – U.S. gas station operators are bracing for the impact of COVID-19 on fuel sales, as same-store gasoline sales were down 2.4% nationwide for the week ending March 14, when compared to the same week last year, according to OPIS Demand Report, a weekly survey of more than 15,000 fuel stations nationwide*.
More troubling for the long-term, says retail experts from Oil Price Information Service (OPIS) by IHS Markit (NYSE: INFO), is the data is finally starting to hint at the potential demand destruction to come. Data collected so far on sales in the week ending March 21, shows demand destruction increasing 10-fold or more across retail chains.
“At a time when rapidly decreasing oil prices would theoretically lead to an increase of consumer demand for gasoline, much of the country is shutting down economic activity due to the COVID-19 outbreak,” said Tom Kloza, global head of energy analysis at OPIS. “We are likely to see weekly gasoline demand numbers drop to levels last witnessed in the Nixon Administration, and we’ll see those lower levels in April.”
The epicenter of the COVID-19 outbreak in the United States began initially on the West Coast, particularly in Washington state and parts of California, and according to the OPIS Demand Report, gasoline demand data seen in the West and Northeast regions early in the outbreak may be the proverbial “canary in the coal mine,” as an indicator for what is to come for the rest of U.S. as the virus spreads.
Compared to figures from the same week in 2019, average weekly gasoline demand volumes were down 8.4% in the Western part of the country alone from the same week prior year, according to the OPIS analysis.
The Northeast region, where New York and other metropolitan areas have seen a large increase in positive tests for COVID-19, saw year-on-year fuel demand decline 3.7%. Again, conversations with retailers in some of these impacted states are suggesting year-on-year volume losses of 20% to 40%, which will be chronicled in the next OPIS Demand Report.
With many states implementing social distancing regulations, and some even moving to shelter-in-place policies, Kloza expects even more significant declines in U.S. gasoline demand in the coming weeks.
“We are likely to see weekly gasoline demand numbers slide below 6 million barrels per day – volumes last witnessed during the Nixon Administration, and we’ll likely see those lower levels in April,” Kloza said.
*The OPIS Demand Report tracks same-store gasoline volumes on a national, regional, and state level (where available). OPIS Demand Report and its affiliated OPIS DemandPro products allow users to track industry trends for overall gasoline sales.
To learn more about the OPIS Demand Report or OPIS DemandPro, please contact Brian Norris, Executive Director – Retail Data and Product Management at OPIS, at [email protected].
Oil Price Information Service (OPIS) by IHS Markit (NYSE: INFO) provides accurate pricing, real-time news and expert analysis across the global fuel supply chain, including the Spot, Wholesale Rack and Retail markets. OPIS and OPIS PetroChem Wire enable customers to buy and sell oil and gas products with confidence via easy access to transparent data, expert-level customer support, educational events and energy data solutions with Axxis Software and OPIS RetailSuite.
IHS Markit (NYSE: INFO) is a world leader in critical information, analytics and solutions for the major industries and markets that drive economies worldwide. The company delivers next-generation information, analytics and solutions to customers in business, finance and government, improving their operational efficiency and providing deep insights that lead to well-informed, confident decisions. IHS Markit has more than 50,000 business and government customers, including 80 percent of the Fortune Global 500 and the world’s leading financial institutions. Headquartered in London, IHS Markit is committed to sustainable, profitable growth.
The US dollar fell again relative to a basket of major currencies. The dollar index (#DX) closed in the negative zone (-1.53%). The US dollar was under pressure due to a record number of jobless claims. Investors expected a value of 1.65 million, but in fact, the number counted to 3.28 million. At the same time, Federal Reserve Chairman Jerome Powell assured investors that the Fed “is not going to run out of ammunition” and the regulator still has methods to maintain the economy. Also, in the United States, a record number of coronavirus cases was reported, which counted to 85,996. Thus, the United States overtook China and Italy in terms of the number of infected.
The British pound rose slightly after the Bank of England meeting. So, the regulator decided not to lower the key interest rate and left it at the level of 0.10% per annum. The £200 billion asset buyback program has also not been adjusted.
The “black gold” prices continue to consolidate. Currently, futures for the WTI crude oil are testing the $22.80 mark per barrel. At 19:00 (GMT+2:00), U.S. Baker Hughes Total Rig Count will be published.
Market indicators
Yesterday, there were aggressive purchases in the US stock market: #SPY (+5.84%), #DIA (+6.14%), #QQQ (+5.27%).
The 10-year US government bonds yield fell again. At the moment, the indicator is at the level of 0.77-0.78%.
The news feed on 2020.03.27:
– Michigan consumer sentiment and expectations at 16:00 (GMT+2:00).
– The 5G revolution, American military defense, and even time itself are dependent on this one critical metal that China monopolizes and that the U.S. is desperate to get more of.
The metal is Cesium, and it’s quite possible you’ve never even heard of it–yet, global dominance, which depends on technological superiority, can’t happen without it.
In May 2018 Cesium was added to the list of critical minerals by the United States Department of the Interior.
In fact, there are 16 metals in total that are absolutely critical to high-tech industries, military applications and telecommunications–and China controls the supply of every single one because it controls 96% of production.
That includes cesium, for which China has a monopoly on stockpiles, mines aren’t really producing anymore, and the United States has none, leaving North America’s only hope in Canada.
Of five cesium occurrences in Canada’s Ontario province, a small-cap Canadian miner called Power Metals owns 100% of three of them (West Joe, Tot Lake and Marko).
Time Is Running Out for This Most Strategic of Metals
Cesium is so secretive and obscure that it’s nearly impossible to track its real market price.
It’s strategic in and of itself, but its rarity makes it even more critical.
The supreme technological war of global dominance can’t be won without these metals, so whoever controls them has the upper hand.
Cesium is described by the German Institute for Strategic Metals (ISE) as “the most electropositive of all stable elements in the periodic table”, and the heaviest of the stable metals. Cesium is “extremely pyrophoric, ignites spontaneously when in contact with air, and explodes violently in water or ice at any temperature above -116 C”.
The strategic metal’s applications in the healthcare industry are expected to soar as laboratories already use cesium compounds in medical imaging, cancer therapy, positron emission tomography (PET) and others.
The latest market analysis by Technavio predicts the cesium market will grow by 1.66 thousand MT between 2020 and 2014, driven by everything from catalyst promoters, glass amplifiers, photoelectric cell components, crystals in scintillation counters, and getters in vacuum tubes.
Much cesium demand also comes from the oil and gas industry, which uses cesium formate brines in drilling fluids to prevent blow-outs in high-temperature, over-pressurized wells.
In terms of world dominance, the “cesium standard” is the key. This is the standard by which the accurate commercially available atomic clocks measure time, and it’s vital for the data transmission infrastructure of mobile networks, GPS and the internet.
That means it has serious defense applications as well, including in infrared detectors, optics, night vision goggles and much, much more. A cesium laser has even been invested for use in missile defense and other technological applications.
So, imagine China being able to starve manufacturers of something like cesium, which would seriously disrupt U.S. industry and hinder the development of critical military equipment.
That’s why, finally, in December 2019, the United States and Canada agreed on a strategy to reduce the need for rare-earth metals mined or controlled by China.
Wide Open Playing Field
The only company in the cesium supply chain right now is Chinese, and one of the only companies on the radar for potential commercial cesium supplies in North America is Canadian junior Power Metals, which is hoping to prove that it’s sitting on the world’s fourth deposit of the critical metal.
The company discovered the pegmatites at West Joe Dyke in August 2018, intersecting high-grade cesium mineralization in six drill holes when it was targeting lithium instead.
So, the focus now is not on what has been lost to China, but the promise of new North American critical cesium.
But Dr. Julie Selway, a key geologist for the Ontario Geological Survey during the tantalum boom of the early 2000s, and now VP of exploration for Power Metals, says the three properties the company is drilling are likely to have similar finds as the strategically important Sinclair mine in Australia.
“They are shipping their resource, which they say is higher than 10% cesium-oxide, and ours have some that are between 12% and 14% of cesium-oxide,” Selway–one of the world’s most renowned experts on pegmatites–told Oilprice.com.
Power Metals has intersected cesium (Cs) mineralization in 6 drill holes on West Joe Dyke, with “exceptionally high-grade” Li and Ta intervals. They also found Cs mineralization in drill core in the first new dyke below Main Dyke, as well as in the drill core in Northeast Dyke.
On February 20th, Power Metals announced its exploration plans, and will begin stripping and channel sampling on West Joe Dyke in the Q2 of this year already. That’s when they’ll expose, sample and assay the cesium mineralization on surface outcrops to find more cesium-bearing pegmatite dykes nearby.
This is one big chance to one-up Beijing, which, according to the Wall Street Journal, has tried to manipulate the market so critical metals such as Cesium are cheaper in China than outside the country. What this did was prompt some major manufacturers and tech industries to set up shop in China, where they could get supplies at a lower cost.
You might not have heard of cesium before, but you will hear about it soon because North America needs its own supply if it’s going to win the war for global technological dominance–and the front line of defense could end up being West Joe Dyke, and a junior explorer that not only thinks strategically, but may be sitting on one of the only deposits that China doesn’t control.
Other companies shaking up China’s rare-earth dominance:
Teck Resources (NYSE:TECK, TSX:TECK)
Teck could be one of the best-diversified miners out there, with a broad portfolio of Copper, Zinc, Energy, Gold, Silver and Molybdenum assets. Its free cash flow and a lower volatility outlook for base metals in combination with a potential trade war breakthrough could send the stock higher in H2 of this year.
Teck’s share price stabilized last year and many investment banks now see the stock as undervalued. Low prices for Canadian crude and disappointing base metals prices weighed on Q4 earnings.
Despite its struggles, however, Teck Resources recently received a favorable investment rating from Fitch and Moody’s, and will likely benefit from its upgraded score. “Having investment grade ratings is very important to us and confirms the strong financial position of the company,” said Don Lindsay, President and CEO. “We are very pleased to receive this second credit rating upgrade.”
Turquoise Hill Resources (NYSE:TRQ ,TSX:TRQ)
Turqouise is a mid-cap Canadian mineral exploration and development company headquartered in Vancouver, British Columbia. Its focus is on the Pacific Rim where it is in the process of developing several large mines.
The company mines a diversified set of metals/minerals including Coal, Gold, Copper, Molybdenum, Silver, Rhenium, Uranium, Lead and Zinc. One of the fortes of Turquoise hill is its good relationship with mining giant Rio Tinto.
Turquoise has seen its share price languish last year, and the successful development of its world-class Oyu Tolgoi project in Mongolia is of utmost important to the future of this miner.
Pretium Resources (NYSE:PVG, TSX:PVG)
This impressive Canadian company is engaged in the acquisition, exploration and development of precious metal resource properties in the Americas. Pretium has an impressive portfolio and if you can catch the stock while the price is right, there could be huge opportunity for upside. Additionally, construction and engineering activities at its top location continue to advance, and commercial production is targeted for this year.
With Pretium’s variety of assets, this mining giant is a key figure in Canada’s resource realm. Investors know a good thing when they see it and have definitely taken note of this company’s ambitious and forward-looking drive.
Magna International (NYSE:MGA, TSX:MG)
Based in Aurora, Ontario, Magna is a global automotive supplier is gutsy and innovative–and definitely tuned to the obvious future–clean transportation. A great catalyst is its development of a combo electric/hydrogen vehicle–a fuel cell range-extended EV (FCREEV). It’s not going to produce them (for now, at least) but plans to use the model to show off its engineering and design prowess and produce elements of the electric drivetrain and contract manufacturing. It’s insightful, forward-thinking and smart value/low cost for shareholders.
Agnico Eagle Mines Ltd (NYSE:AEM, TSX:AEM)
Canadian based gold producer, Agnico Eagle Mines is an especially noteworthy company for investors. Why? Between 1991-2010, the company paid out dividends every year. With operations in Quebec, Mexico, and Finland, the company also is taking place in exploration activities in Europe, Latin America, and the United States.
While Agnico primarily focuses on gold, it made this list because it’s a prime example of sustainability and environmental consciousness, and that means everything in a world rapidly shifting away from traditional mining.
**IMPORTANT! BY READING OUR CONTENT YOU EXPLICITLY AGREE TO THE FOLLOWING. PLEASE READ CAREFULLY**
Forward-Looking Statements
This news release contains forward-looking information which is subject to a variety of risks and uncertainties and other factors that could cause actual events or results to differ from those projected in the forward-looking statements. Forward looking statements in this release include that prices for cesium will retain value in future as currently expected; that PWM can fulfill all its obligations to maintain its properties; that PWM’s property can successfully mine commercial quantities of cesium; that the three properties the company is drilling are hoped to have similar finds as the strategically important Sinclair mine in Australia; that occurrences and indications of a commercially sized deposit become reality; that high grades found in samples are indicative of a high grade deposit; and that PWM will be able to carry out its business plans. These forward-looking statements are subject to a variety of risks and uncertainties and other factors that could cause actual events or results to differ materially from those projected in the forward-looking information. Risks that could change or prevent these statements from coming to fruition include that aspects or all of the properties’ development may not be successful, mining of the cesium may not be cost effective, the price of cesium may not stay high and it may never be profitable to mine cesium; PWM may not raise sufficient funds to carry out its plans, changing costs for mining and processing; increased capital costs; the timing and content of upcoming work programs; geological interpretations and technological results based on current data that may change with more detailed information or testing; potential process methods and mineral recoveries assumptions based on limited test work with further test work may not be viable; competitors may offer cheaper cesium; more production of Cesium could reduce its price; alternatives could be found for cesium; the availability of labour, equipment and markets for the products produced; and despite the current expected viability of its projects, that the minerals cannot be economically mined on its properties, or that the required permits to build and operate the envisaged mines cannot be obtained. The forward-looking information contained herein is given as of the date hereof and the Company assumes no responsibility to update or revise such information to reflect new events or circumstances, except as required by law.
DISCLAIMERS
ADVERTISEMENT. This communication is not a recommendation to buy or sell securities. Oilprice.com, Advanced Media Solutions Ltd, and their owners, managers, employees, and assigns (collectively “the Company”) may in the future be paid by PWM to disseminate future communications if this communication proves effective. In this case the Company has not been paid for this article. But the potential for future compensation is a major conflict with our ability to be unbiased, more specifically:
This communication is for entertainment purposes only. Never invest purely based on our communication. We have not been compensated by PWM but may in the future be compensated to conduct investor awareness advertising and marketing for TSXV: PWM.V; OTC:PWRMF. Therefore, this communication should be viewed as a commercial advertisement only. We have not investigated the background of the company. Frequently companies profiled in our alerts experience a large increase in volume and share price during the course of investor awareness marketing, which often end as soon as the investor awareness marketing ceases. The information in our communications and on our website has not been independently verified and is not guaranteed to be correct.
SHARE OWNERSHIP. The owner of Oilprice.com owns shares of this featured company and therefore has an additional incentive to see the featured company’s stock perform well. The owner of Oilprice.com will not notify the market when it decides to buy more or sell shares of this issuer in the market. The owner of Oilprice.com will be buying and selling shares of this issuer for its own profit. This is why we stress that you conduct extensive due diligence as well as seek the advice of your financial advisor or a registered broker-dealer before investing in any securities.
NOT AN INVESTMENT ADVISOR. The Company is not registered or licensed by any governing body in any jurisdiction to give investing advice or provide investment recommendation. ALWAYS DO YOUR OWN RESEARCH and consult with a licensed investment professional before making an investment. This communication should not be used as a basis for making any investment.
RISK OF INVESTING. Investing is inherently risky. Don’t trade with money you can’t afford to lose. This is neither a solicitation nor an offer to Buy/Sell securities. No representation is being made that any account will or is likely to achieve profits similar to those discussed.
The coronavirus pandemic and its economic fallout will trigger a ‘skyward surge’ in sustainable, responsible and impactful investing over the next 12 months, affirms the CEO of one of the world’s largest independent financial advisory organizations.
The prediction from the boss of deVere Group, which has more than $12bn under advisement, comes as Bloomberg analysis reveals that the average Environmental, Social and Governance (ESG) fund fell by half the decrease registered by the S&P 500 Index over the same period during the Covid-19 crisis.
ESG refers to a class of investing also known as “sustainable investing.” The umbrella term covers three main factors. ‘E’ is for ‘environment’ and includes issues such as climate change policies, carbon footprint, and use of renewable energies. ‘S’ is for ‘social’ and includes workers’ rights and protections. ‘G’ is for ‘governance’ and includes diversity of the board and corporate transparency.
Mr Green comments: “The coronavirus pandemic will trigger a ‘skyward surge’ in sustainable, responsible and impactful investing over the next 12 months for three key reasons.
“First, before the pandemic, research has revealed that investments that score well in terms of ESG credentials often outperform the market and have lower volatility over the long-run.
“Since the Covid-19 public health emergency up-ended the world, the latest broad analysis shows that ESG funds have typically continued to outperform others.”
He continues: “Second, the coronavirus pandemic has underscored the vulnerability and fragility of societies and the planet.
“It has underscored that increasingly companies will only survive and thrive if they operate with a nod from the wider court of public approval.
“It has underscored the complexity and interconnectedness of our world in terms of demand and supply, in trade and commerce – and how these can be under threat if not sustainable.”
Mr Green goes on to add: “Third, demographic shifts will support the trend. Millennials – those who were born in the time period ranging from the early 1980s to the mid-1990s and early 2000s – cite ESG investing as their top priority when considering investment opportunities.
“This is crucial because the biggest-ever generational transfer of wealth – likely to be around $30trn – from baby boomers to millennials will take place in the next few years.”
In January, deVere Group carried out a global survey that revealed 77% of millennials said that Environmental, Social and Governance (ESG) investing was their top priority when considering investment opportunities.
This survey highlighted that whilst traditional factors – such as anticipated returns (10%), past performance (7%), risk tolerance (4%) and tactical allocation (2%) – are important factors in millennial respondents’ investment decision-making, they are no longer enough by themselves.
Nigel Green concludes: “ESG investing was already going to reshape the investment landscape in this new decade – but the coronavirus will quicken the pace of this reshaping.
“Investors are increasingly aware that it is possible – and increasingly necessary – to make a profit while positively and proactively protecting people and the planet.
“As such, they will be making investment decisions after measuring the sustainability and societal impact of a sector or company as these criteria help to better determine their future financial performance, or in other words their risk and return.”
About:
deVere Group is one of the world’s largest independent advisors of specialist global financial solutions to international, local mass affluent, and high-net-worth clients. It has a network of more than 70 offices across the world, over 80,000 clients and $12bn under advisement.
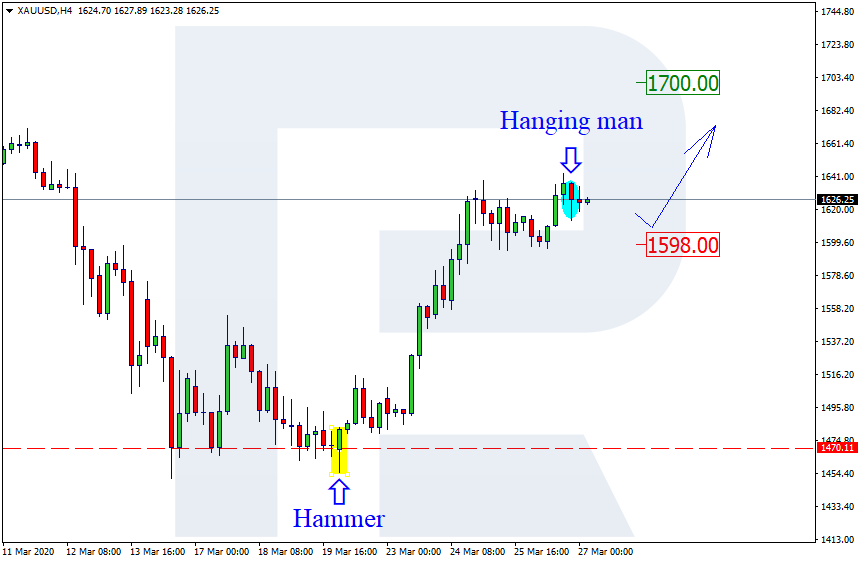
As we can see in the H4 chart, Gold is still growing from the support level. After forming several reversal patterns, such as Hammer, the pair is reversing. At the moment, the price is testing another resistance level not far from a Hanging Man pattern. The current situation implies that the pair may reverse to start a slight correction and then continue forming the rising tendency. The correctional target may be at 1598.00. in the future, the next upside target may be at 1700.00.
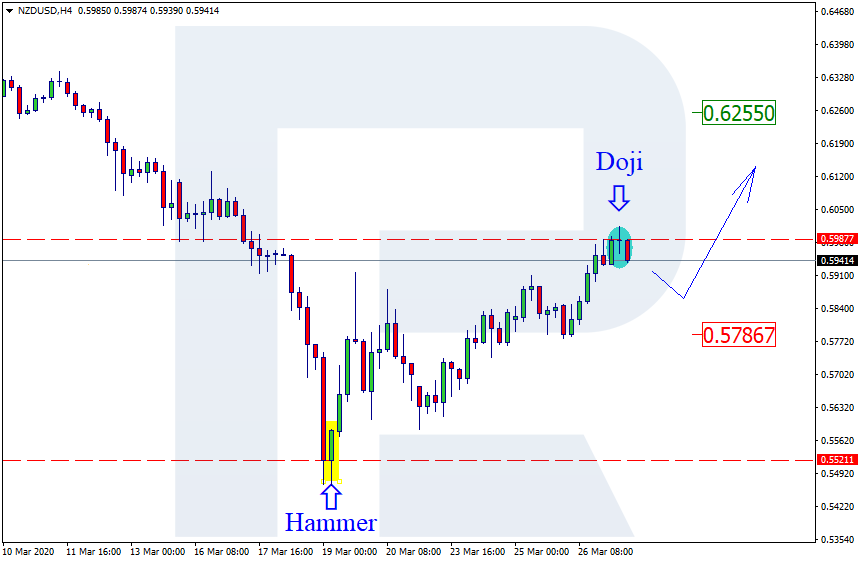
NZDUSD, “New Zealand vs. US Dollar”
As we can see in the H4 chart, after forming a Doji reversal pattern not far from the resistance level, the pair continues growing. At the moment, NZDUSD is reversing. The correctional target may be at 0.5786. After finishing the correction, the price may resume trading upwards. In this case, the upside target will be at 0.6255.
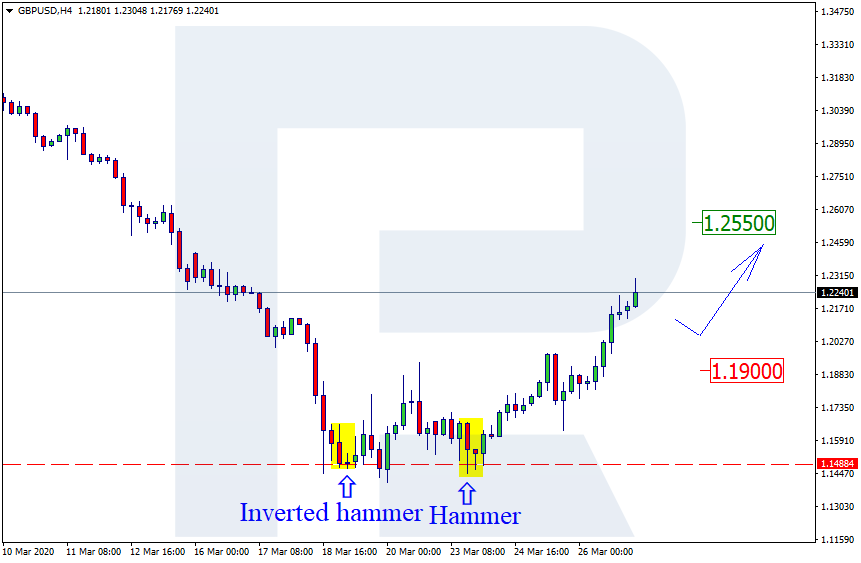
GBPUSD, “Great Britain Pound vs US Dollar”
As we can see in the H4 chart, the rising tendency continues. By now, GBPUSD has formed several reversal patterns, such as Hammer and Inverted Hammer, close to the support level. At the moment, the pair is reversing and testing the resistance level. There are no reversal patterns close to this level but the price may yet start a correction before further growth towards 1.2550. However, there is another scenario, which implies that the instrument may rebound from the resistance level and fall towards 1.1900.
Attention! Forecasts presented in this section only reflect the author’s private opinion and should not be considered as guidance for trading. RoboForex LP bears no responsibility for trading results based on trading recommendations described in these analytical reviews.
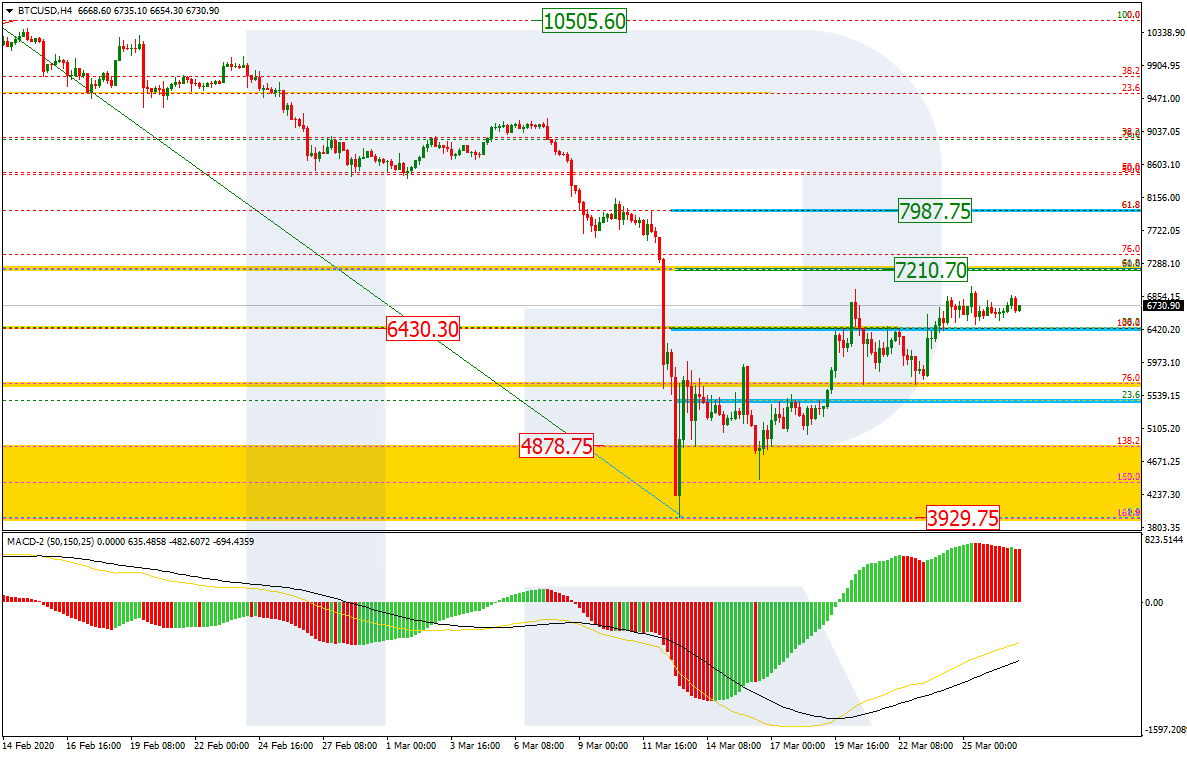
As we can see in the H4 chart, after reaching the post-correctional extension area between 138.2% and 161.8% fibo at 4878.75 and 3929.75 respectively, BTCUSD is still correcting upwards. By now, it has slowed down a bit at 38.2% fibo but after a short pause may continue growing towards 50.0% and 61.8% fibo at 7210.70 and 7987.75 respectively. The support is the low at 3929.75.
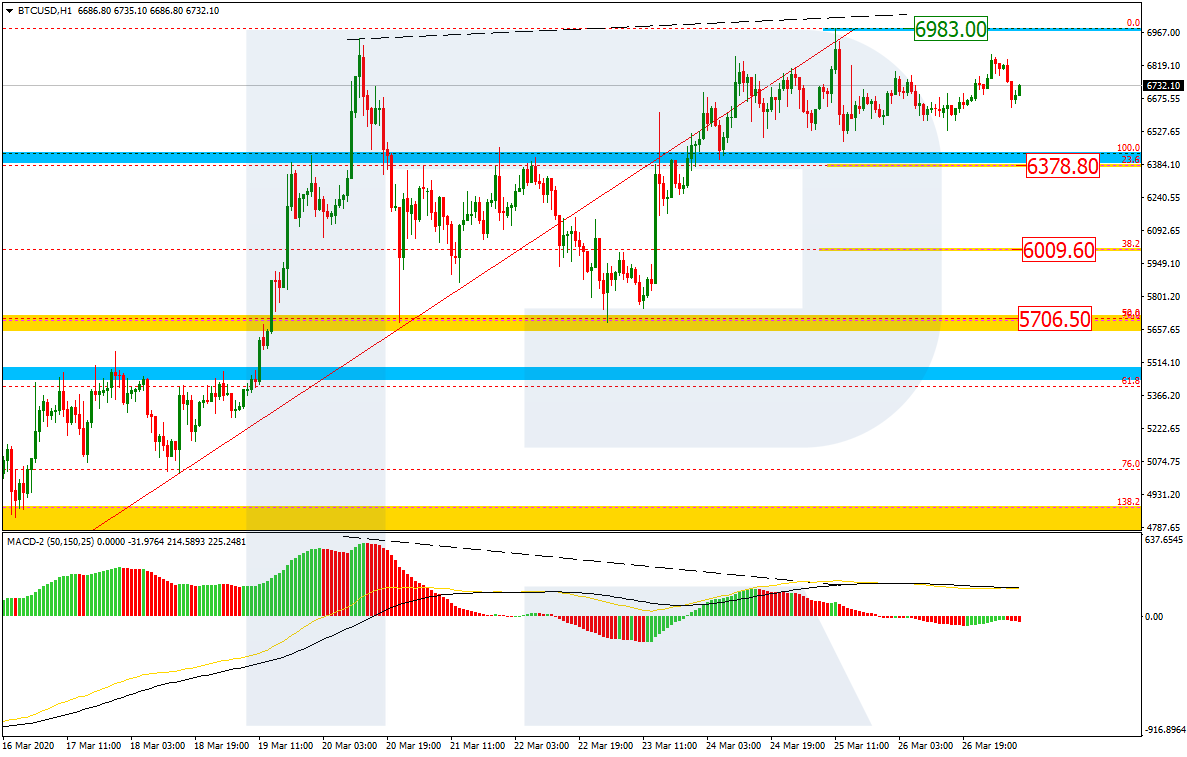
In the H1 chart, there is a divergence on MACD, which may indicate a new pullback. The targets may be 23.6%, 38.2%, and 50.0% at 6378.80, 6009.60, and 5706.50 respectively. The resistance is the high at 6983.00.
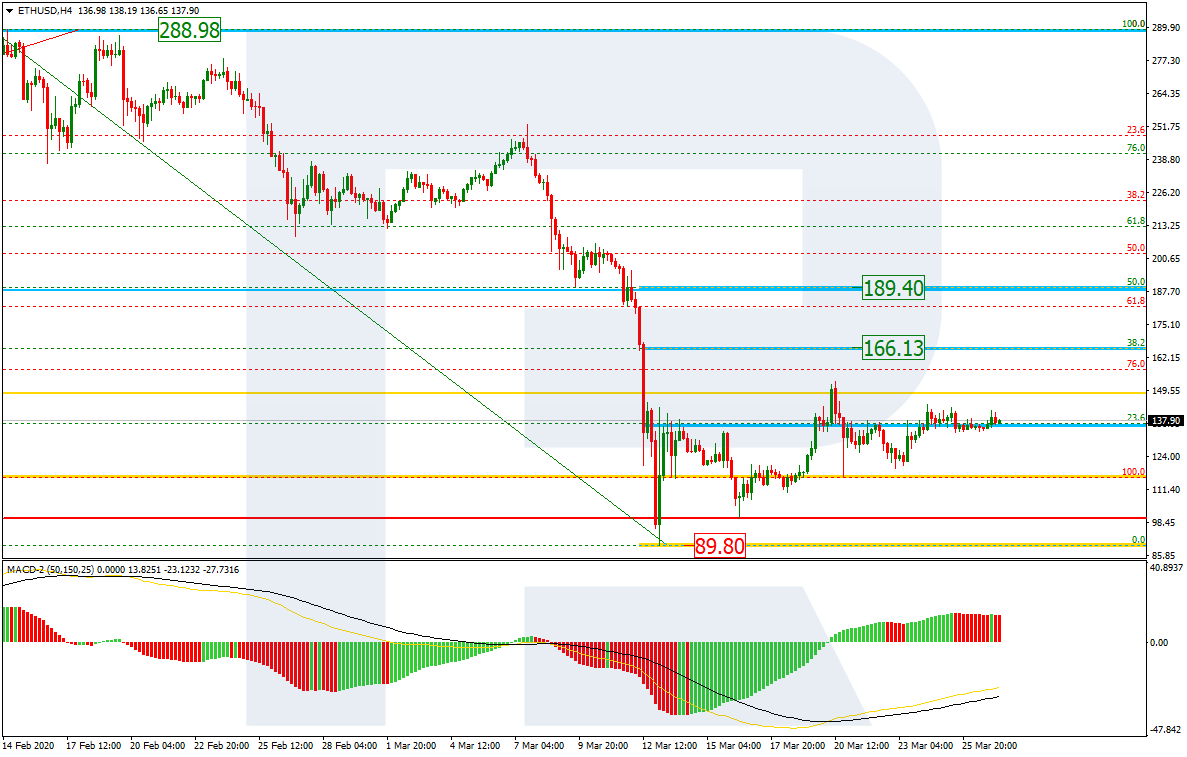
ETHUSD, “Ethereum vs. US Dollar”
As we can see in the H4 chart, after rebounding from the psychologically important level at 100.00, the pair is correcting. The first correctional wave has already reached 23.6% fibo; right now, the instrument is consolidating. The next correctional targets may be at 38.2% and 50.0% fibo at 166.13 and 189.40 respectively. The support is the low at 89.80.
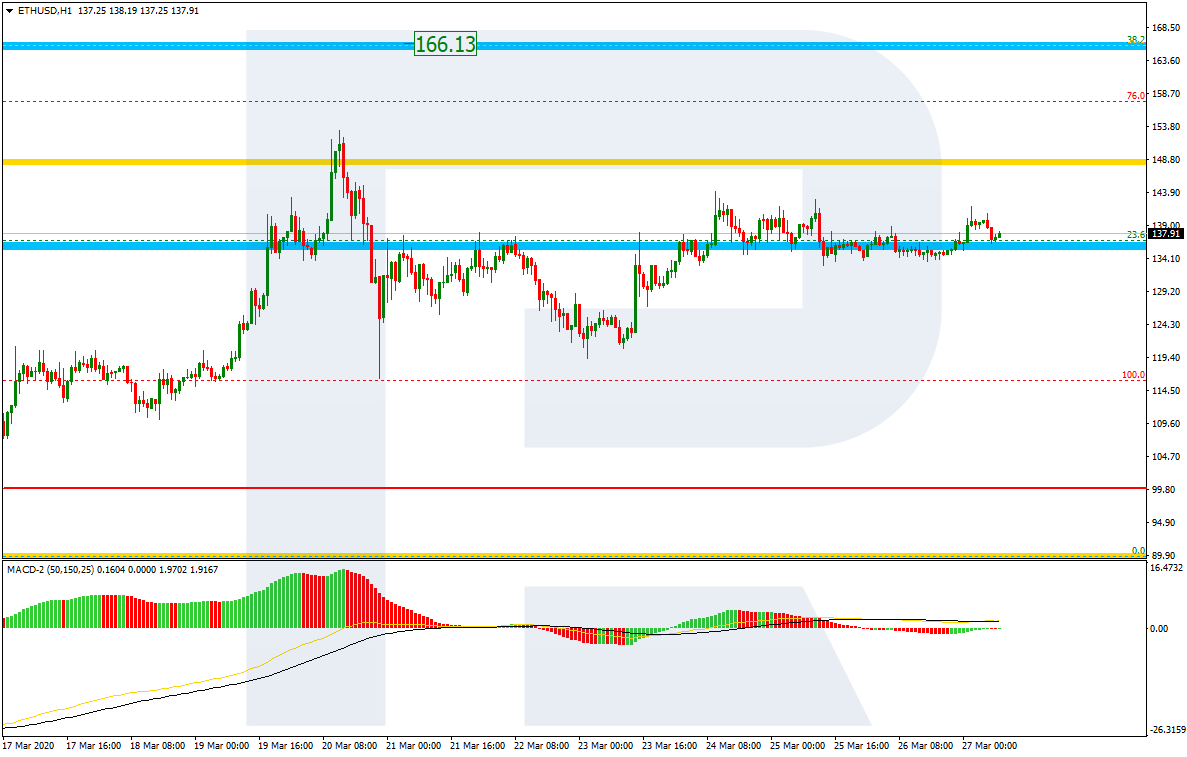
The H1 chart shows more detailed structure of the current consolidation around 23.6% fibo.
Attention! Forecasts presented in this section only reflect the author’s private opinion and should not be considered as guidance for trading. RoboForex LP bears no responsibility for trading results based on trading recommendations described in these analytical reviews.
Greenback significantly weakened relative to its main competitors. During yesterday’s and today’s trading, the growth of EUR/USD quotes exceeded 180 points. The COVID-19 virus epidemic continues to negatively impact the global economy. The US Department of Labor reported that the number of initial applications for unemployment benefits reached a record high and exceeded 3 million. Currently, the EUR/USD currency pair is consolidating in the range of 1.09800-1.10800. The trading instrument can recover further. Open positions from key levels.
The Economic News Feed for 27.03.2020:
— data on personal expenses (US) – 14:30 (GMT+2:00).
Indicators signal the power of buyers: the price has fixed above 50 MA and 100 MA.
The MACD histogram is in the positive zone, indicating bullish sentiment.
The Stochastic Oscillator is in the neutral zone, the %K line is below the %D line, which gives a signal to sell EUR/USD.
Trading recommendations
Support levels: 1.09800, 1.08800, 1.08000
Resistance levels: 1.10800, 1.11800
If the price consolidates above the level of 1.10800, the quotes can grow toward 1.11500-1.12000.
Alternatively, the quotes could descend toward 1.09000-1.08500.
The GBP/USD currency pair
Technical indicators of the currency pair:
Prev Open: 1.18744
Open: 1.21546
% chg. over the last day: +2.66
Day’s range: 1.21313 – 1.23058
52 wk range: 1.1466 – 1.3516
The GBP/USD currency pair shows a pronounced upward trend. Since the beginning of this week, quotes growth exceeded 550 points. Yesterday, the Bank of England, as expected, kept the basic parameters of monetary policy at the same level. The pound is currently consolidating in the range 1.21300-1.23000. Greenback demand has weakened significantly. The trading instrument can grow further. Open positions from key levels.
The Economic News Feed for 27.03.2020 is calm.
Indicators signal the power of buyers: the price has fixed above 50 MA and 100 MA.
The MACD histogram is in the positive zone, indicating bullish sentiment.
The Stochastic Oscillator is in the neutral zone, the% K line is below the% D line, which indicates a bearish sentiment.
Trading recommendations
Support levels: 1.21300, 1.19750, 1.18750
Resistance levels: 1.23000, 1.24200
If the price consolidates above the round level of 1.23000, expect the quotes to grow toward 1.24000-1.24500.
Alternatively, the quotes could descend toward 1.12000-1.19500.
The USD/CAD currency pair
Technical indicators of the currency pair:
Prev Open: 1.41904
Open: 1.40466
% chg. over the last day: -1.23
Day’s range: 1.39887 – 1.40936
52 wk range: 1.2949 – 1.4668
The USD / CAD currency pair is dominated by a bearish sentiment. USD/CAD quotes again updated local lows. The trading tool found support at 1.39900. 1.41500 is already a mirror resistance. Demand for the US dollar has weakened significantly. USD/CAD quotes can descend further. We recommend you to pay attention to the dynamics of prices of “black gold”. Open positions from key levels.
The Economic News Feed for 27.03.2020 is calm.
Indicators signal the power of sellers: the price has fixed below 50 MA and 100 MA.
MACD is in the negative zone, indicating a bearish sentiment.
The Stochastic Oscillator is in the neutral zone, the %K line is above the %D line, which gives a signal to buy USD/CAD.
Trading recommendations
Support levels: 1.39900, 1.38700
Resistance levels: 1.41500, 1.42750, 1.43800
If the price consolidates below 1.39900, expect a descend toward 1.39000-1.38000.
Alternatively, the quotes could grow toward 1.42500-1.43500.
The USD/JPY currency pair
Technical indicators of the currency pair:
Prev Open: 111.155
Open: 109.458
% chg. over the last day: -1.45
Day’s range: 108.237 – 109.471
52 wk range: 101.19 – 112.41
The USD/JPY currency pair shows a negative dynamic. During yesterday’s and today’s trading, the drop in quotations exceeded 250 points. The trading instrument has set new local lows. At the moment, USD/JPY quotes are consolidating in the range of 108.200-109.300. The yen can descend further. We recommend you to pay attention to the dynamics of yield on US government bonds. Open positions from key levels.
The Economic News Feed for 27.03.2020 is calm.
Indicators signal the power of sellers: the price has fixed below 50 MA and 100 MA.
MACD is in the negative zone, indicating a bearish sentiment.
The Stochastic Oscillator is in the neutral zone, the %K line is above the %D line, which gives a signal to buy USD/JPY.
Trading recommendations
Support levels: 108.200, 107.000
Resistance levels: 109.300, 110.000, 110.750
If the price consolidates below 108.200, expect the quotes to correct toward 107.500-107.000.
Alternatively, the quotes could grow toward 110.000-110.700
– We’ve come a long way in a short time since ride-sharing emerged as a mainstream offering. Now, there’s even an app that lets consumers participate in one of the biggest trends of the decade without leaving an environmental footprint.
It’s the app that does what Uber and Lyft don’t, or can’t afford to.
Downloading it and hitching a ride with it means planting trees along the way. It also means, for the first time in our short ride-sharing history, having the option to choose to hail an EV or a hybrid to cut down on CO2.
The app is from Facedrive, and it’s not just another ride-sharing service–it’s the next-generation model, and it’s working to help the environment.
What Riders Want
What the younger generation of riders want is exactly what the environment wants: An environmentally friendly solution to the mega-trend of sharing–and in this case, sharing rides.
In other words, they want the cliche of “sharing is caring” to mean something.
Millennial investors are nearly twice as likely to invest in companies or funds that target specific social or environmental outcomes.
Where Uber missed out, Facedrive steps in. And the biggest problem is pollution.
The ride-sharing segment is experiencing explosive growth, but what generations from Millennials on down can’t countenance is the pollution. Transportation is the America’s largest source of greenhouse gas emissions, overtaking electric power a few years ago.
And the evidence of ride-sharing pollution is mounting just as quickly as Uber and Lyft are expanding.
A recent study by the Union of Concerned Scientists estimates that the average (U.S.) ride-hailing trip results in 69% more pollution than whatever transportation option it displaced.
“It’s not just that millennials, and younger generations in general, are increasingly opting out of the expenses and hassles of owning and parking a car,” Facedrive CEO Sayan Navaratnam told Oilprice.com in a recent interview. “It’s phenomenally bigger than that: Millennials demand more conveniences, and they demand that they be green. We are giving them that before anyone else does.”
Because it offsets any possible CO2 emissions, and for the very first time in ride-sharing history, gives customers the choice to be even more environmentally conscious.
This is innovative, state-of-the-art, technology. FD’s in-app algorithm calculates estimated CO2 emissions for each car journey and allocates a monetary value to Forest Ontario. Toronto Parks and Tree Foundation.
That makes ride-sharing less polluting.
Facedrive allows its riders to choose between EVs, hybrids and traditional cars. It’s a choice no one’s ever given consumers, and it means that it pleases everyone. For all those riders who are fine with the conventional, Facedrive is by no means sidelining them. They’re just partially offsetting the related emissions.
This resonates hugely with celebrities and the younger generations. It also resonates hugely with riders of any stripe because they won’t be paying any premiums for offsetting, nor will drivers lose any of their fare to pay for the green initiative. It’s a win-win for all, and the City of Toronto will also reap the benefits, which means that officialdom is solidly on board.
What the Market Demands
And it’s not just riders demanding a new model for ride-sharing–the market demands it, too.
There is an ethics squeeze going on right now and it’s pressuring major hedge funds to move money into things that are environmentally and socially responsible.
They’re doing it very willingly, too, because they have seen which way the profit winds are blowing.
Look no further than Jeff Bezos, the richest man on the planet, who just committed a whopping $10 billion to a Global Earth Fund. Or, Larry Fink, the CEO of BlackRock–one of the world’s largest hedge funds–who now describes climate change as a “defining factor in companies’ long-term prospects”.
A major capital shift is coming, maybe sooner than we anticipated. Green stocks could be set to eclipse the current technology monopolies, and even the world’s top oil traders are going green.
Facedrive caught on to the mega-trend years ago.
“We’re all about grabbing onto the biggest trends in tech before they’re mega-trends. So that takes us back to 2016, when we first came up with the idea. Whenever a major new trend emerges, it’s the job of the truly innovative to step back and say ‘OK, this is an explosively great idea – so what’s wrong with it?’ When you figure that out, and you’ve got the right network and the right people behind you, you can jump in on one of the biggest trends and disrupt a massive market at exactly the right time,” Navaratnam said.
The problem for Uber was one of timing: This great idea emerged simultaneously with environmentally friendly investing, and both became more than passing fads but they failed to keep step with one another.
And Facedrive’s goal to build a sustainable multi-billion-dollar global organization in the Transportation as a Service (TaaS) industry, isn’t just playing lip service to Millennial demands. It’s “single purpose” is to become the #1 Eco-Friendly, Socially Responsible TaaS platform in any market it enters.
The App That Plans To Take On Uber
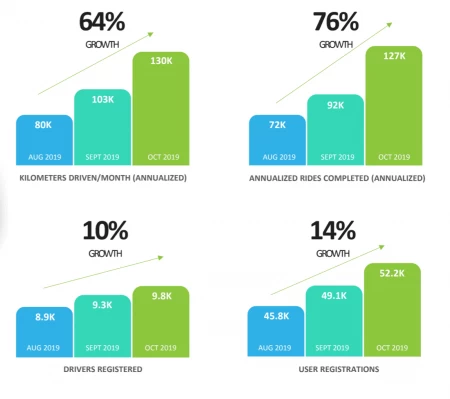
Facedrive has already planted 3,500 trees and expects to have plant ~68,000 trees in 2020, while offsetting around 2.1 million kg of CO2.
And rides are on the steady upswing, with August-October 2019 alone experiencing 76% growth:
The next big push comes in Q3-Q4 of this year, when Facedrive targets expansion into U.S. and European markets.
The app itself is seamless, and not only makes it easy for riders to choose–for the first time–whether they want an EV, a hybrid or a conventional car; but it also lets them watch their carbon footprint being erased and keeps track, live, of Facedrive’s tree-planting operations.
And it’s much more than just an eco-friendly way to ride-share–it’s ethical in more ways than one because the company recognizes that drivers are the key to its success and its guiding principles include one very important aspect that has been left out along the way: Drivers and their families deserve to earn more.
The app isn’t just seamless for riders, it’s seamless for drivers and offers them platform choices that they’ve never had before.
Facedrive’s reputation as an ethical, principle-driven company in a high-growth space has already filled its partnership pipeline with some huge names, including a deal with Canada’s Tier-1 telecoms provider to give free phones and major plan discounts to ‘Facedrivers’, and a deal with a Canadian commercial banking giant.
But the pipeline is already much bigger than that:
Facedrive isn’t just latching onto the explosive ride-sharing segment–it’s changing the model. And all that tree-planting that it’s doing in Canada right now is headed for the U.S. and European markets where a bigger population has more people concerned about their own environmental impact.
Facedrive wanted to take something as simple as hailing a ride and turn it into a collective force for change, and it’s doing just that.
Other companies set to ride the new wave of environmentally friendly alternatives:
Uber Technologies Inc. (NYSE: UBER)
The big story in tech last year was the Uber IPO—the ride-sharing app joined the market with a tepid showing, and it hasn’t done much business since.
It’s the cherry on top of a cake of trouble for the revolutionary tech company, which has suffered from a mountain of bad press. It’s controversial CEO Travis Kalanick was forced out over his behavior and the company’s struggle to generate revenue, but the new management hasn’t been able to do much better.
Lyft (NASDAQ:LYFT)
Lyft may be a bit overvalued, but it’s still sustainable.
Lyft went public in March for $87.24 and hit $88.60 on the first day of trading.
It’s shed over half that and has been treading water ever since. Lyft’s next earnings report is due on October 30th. But $36 makes this a cheap stock for a ride-sharing market that’s killing taxi cabs and cutting in on car sales, too.
Right now, Lyft is valued at 4x its sales, and it’s still losing money—like Uber. But it does have over $3 billion in cash, and it is investing in micro-mobility, too, through bike-sharing startups.
General Motors (NYSE:GM) has created its own brand of electric bikes, called Ariv. The bikes were just launched this year, but have already captured the attention of the European market.
While they err on the side of pricey, coming in at $3,800 per unit, they do boast a high top speed and can travel a modest distance on a single charge.
The kicker for many, however, is that they can fold into an easily carriable pack, making them the perfect choice for a lot of commuters. Especially in big cities like London or Berlin.
Ford (NYSE:F) is taking a different approach. It’s swooped right into the scooter market, buying Spin for a clean $100 million.
Initially deployed in San Francisco back in 2017, Spin is widely considered to be a part of the Big Three of the scooter world, along with Lime and Bird.
While Ford’s buyout of Spin made headlines, it’s certainly not the first urban transportation alternative Ford’s sunk its teeth into.
In recent years, Ford also bought commuter shuttle service Chariot, Autonomic and TransLoc, aiming to ensure that it does not miss the boat as this new movement accelerates.
BAIDU (NYSE:BIDU), for its part, is taking on the automated car market. With more miles under its belt than any of its competitors in Beijing, it’s an easy choice for a number of investors.
Likewise, it has an equally large portfolio of innovative new technology…at a lower entry point than its competitors.
As the ‘Chinese Google,’ Baidu is following a similar path to its American counterpart. It began as a search engine but is quickly expanding into almost all things tech related.
From artificial intelligence to television and finance, Baidu’s ever-expanding reach is a not to be ignored. Especially for investors looking to stay on top of the new tech trends.
By. Joao Piexe
**IMPORTANT! BY READING OUR CONTENT YOU EXPLICITLY AGREE TO THE FOLLOWING. PLEASE READ CAREFULLY**
Forward-Looking Statements
This publication contains forward-looking information which is subject to a variety of risks and uncertainties and other factors that could cause actual events or results to differ from those projected in the forward-looking statements. Forward looking statements in this publication include that the demand for ride sharing services will grow; that the demand for environmentally conscientious ride sharing services companies in particular will grow; that Facedrive will be able to fund its capital requirements in the near term and long term; and that Facedrive will be able to carry out its business plan. These forward-looking statements are subject to a variety of risks and uncertainties and other factors that could cause actual events or results to differ materially from those projected in the forward-looking information. Risks that could change or prevent these statements from coming to fruition include changing governmental laws and policies; the company’s ability to obtain and retain necessary licensing in each geographical area in which it operates; the success of the company’s expansion activities; the ability of the company to attract a sufficient number of drivers to meet the demands of customer riders; the ability of the company to attract drivers who have electric vehicles and hybrid cars; the ability of the company to keep operating costs and customer charges competitive with other ride-hailing companies; and the company’s ability to continue agreements on affordable terms with existing or new tree planting enterprises. The forward-looking information contained herein is given as of the date hereof and we assume no responsibility to update or revise such information to reflect new events or circumstances, except as required by law.
DISCLAIMERS
ADVERTISEMENT. This communication is not a recommendation to buy or sell securities. An affiliated company of Oilprice.com, Advanced Media Solutions Ltd, and their owners, managers, employees, and assigns (collectively “the Company”) has signed an agreement to be paid in shares to provide services to expand ridership and attract drivers in certain jurisdictions outside Canada and the United States. In addition, the owner of Oilprice.com has acquired additional shares of FaceDrive (TSX:FD.V) for personal investment. This compensation and share acquisition resulting in the beneficial owner of the Company having a major share position in FD.V is a major conflict with our ability to be unbiased, more specifically:
This communication is for entertainment purposes only. Never invest purely based on our communication. Therefore, this communication should be viewed as a commercial advertisement only. We have not investigated the background of the featured company. Frequently companies profiled in our alerts experience a large increase in volume and share price during the course of investor awareness marketing, which often end as soon as the investor awareness marketing ceases. The information in our communications and on our website has not been independently verified and is not guaranteed to be correct.
SHARE OWNERSHIP. The owner of Oilprice.com owns shares of this featured company and therefore has a substantial incentive to see the featured company’s stock perform well. The owner of Oilprice.com will not notify the market when it decides to buy more or sell shares of this issuer in the market. The owner of Oilprice.com will be buying and selling shares of this issuer for its own profit. This is why we stress that you conduct extensive due diligence as well as seek the advice of your financial advisor or a registered broker-dealer before investing in any securities.
NOT AN INVESTMENT ADVISOR. The Company is not registered or licensed by any governing body in any jurisdiction to give investing advice or provide investment recommendation. ALWAYS DO YOUR OWN RESEARCH and consult with a licensed investment professional before making an investment. This communication should not be used as a basis for making any investment.
RISK OF INVESTING. Investing is inherently risky. Don’t trade with money you can’t afford to lose. This is neither a solicitation nor an offer to Buy/Sell securities. No representation is being made that any stock acquisition will or is likely to achieve profits.
While volatility in forex markets and US yields remained elevated over the last few days, USD/JPY traders still favoured the upside with the currency pair recapturing, at least for a short while, 111.00.
This is an interesting development, given the next massive monetary stimulus from the Fed coming, and the announcement to buy an unlimited amount of US Treasuries and Mortgage-Backed-Securities (MBS) last Monday, and while 10-year US-Treasury yields dropped back below 1.00%.
In fact, this development does not necessarily indicate that market participants are becoming more and more optimistic, the bias might switch back to “risk-on” again.
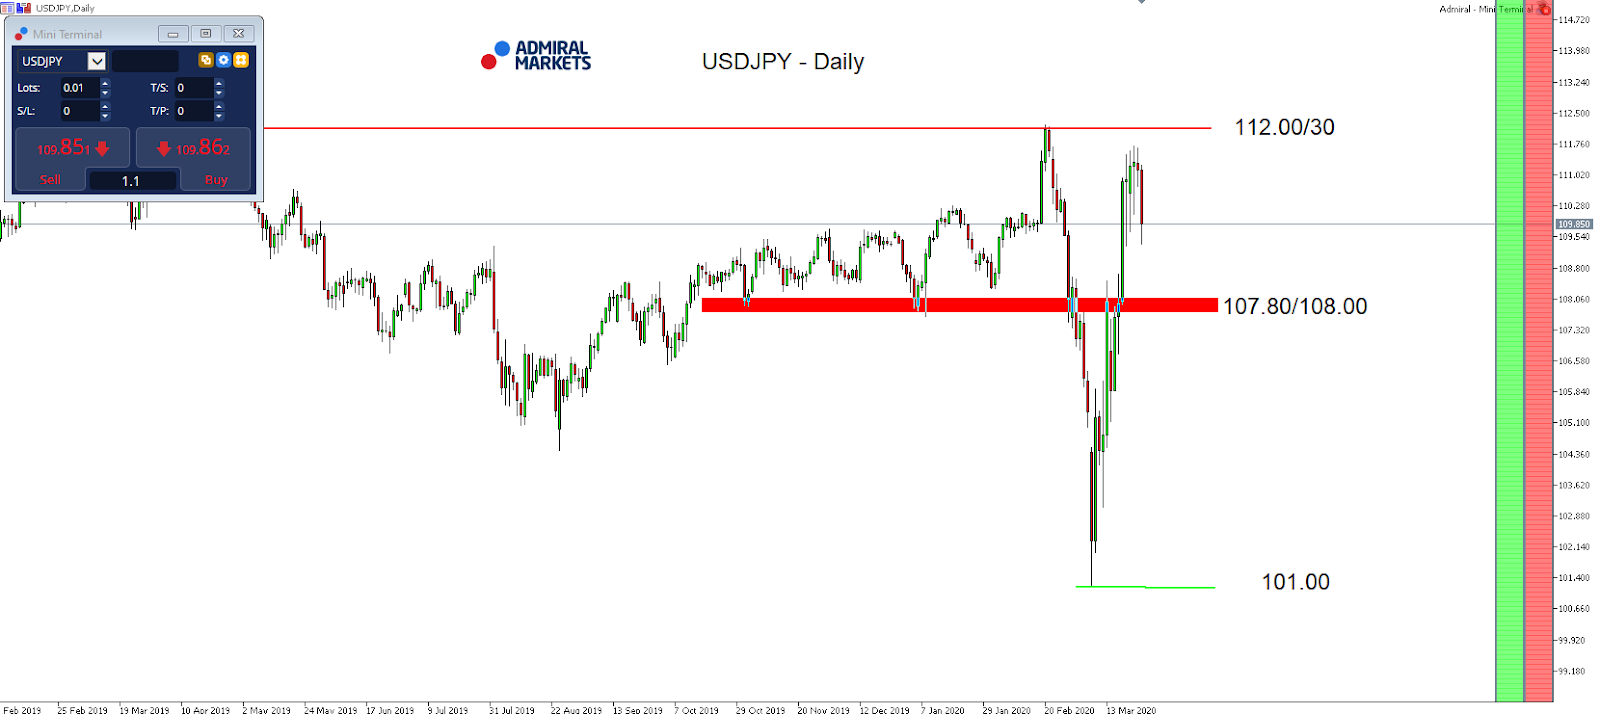
Current developments in the USD/JPY underline even more our short-term cautiousness towards USD short engagements since markets still have a USD shortage, and thus the usage of the re-installed swap lines of the Fed from the BoJ could result in an ongoing squeeze higher and either a test or even a break of the region around 112.00/30.
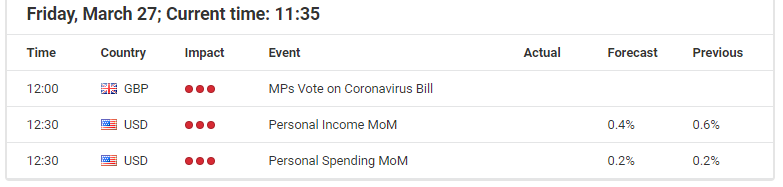
In addition to that, for the weekly close, the upcoming US economic projection in regards to Personal Spending is of high interest, as well. If the data does not come in as bad as markets may anticipate due to the Corona-shutdown, US yields could gain bullish short-term momentum and push the USD/JPY already towards its current yearly highs around 112.30:
Source: Admiral Markets MT5 with MT5-SE Add-on USD/JPY Daily chart (between February 1, 2019, to March 26, 2020). Accessed: March 26, 2020, at 10:00pm GMT – Please note: Past performance is not a reliable indicator of future results, or future performance.
In 2015, the value of the USD/JPY increased by 0.5%, in 2016, it fell by 2.8%, in 2017, it fell by 3.6%, in 2018, it fell by 2.7%, in 2019, it fell by 0.85%, meaning that after five years, it was down by 9.2%.
Discover the world’s #1 multi-asset platform
Admiral Markets offers professional traders the ability to trade with a custom, upgraded version of MetaTrader 5, allowing you to experience trading at a significantly higher, more rewarding level. Experience benefits such as the addition of the Market Heat Map, so you can compare various currency pairs to see which ones might be lucrative investments, access real-time trading data, and so much more. Click the banner below to start your FREE download of MT5 Supreme Edition!
Disclaimer: The given data provides additional information regarding all analysis, estimates, prognosis, forecasts or other similar assessments or information (hereinafter “Analysis”) published on the website of Admiral Markets. Before making any investment decisions please pay close attention to the following:
This is a marketing communication. The analysis is published for informative purposes only and are in no way to be construed as investment advice or recommendation. It has not been prepared in accordance with legal requirements designed to promote the independence of investment research, and that it is not subject to any prohibition on dealing ahead of the dissemination of investment research.
Any investment decision is made by each client alone whereas Admiral Markets shall not be responsible for any loss or damage arising from any such decision, whether or not based on the Analysis.
Each of the Analysis is prepared by an independent analyst (Jens Klatt, Professional Trader and Analyst, hereinafter “Author”) based on the Author’s personal estimations.
To ensure that the interests of the clients would be protected and objectivity of the Analysis would not be damaged Admiral Markets has established relevant internal procedures for prevention and management of conflicts of interest.
Whilst every reasonable effort is taken to ensure that all sources of the Analysis are reliable and that all information is presented, as much as possible, in an understandable, timely, precise and complete manner, Admiral Markets does not guarantee the accuracy or completeness of any information contained within the Analysis. The presented figures refer that refer to any past performance is not a reliable indicator of future results.
The contents of the Analysis should not be construed as an express or implied promise, guarantee or implication by Admiral Markets that the client shall profit from the strategies therein or that losses in connection therewith may or shall be limited.
Any kind of previous or modeled performance of financial instruments indicated within the Publication should not be construed as an express or implied promise, guarantee or implication by Admiral Markets for any future performance. The value of the financial instrument may both increase and decrease and the preservation of the asset value is not guaranteed.
The projections included in the Analysis may be subject to additional fees, taxes or other charges, depending on the subject of the Publication. The price list applicable to the services provided by Admiral Markets is publicly available from the website of Admiral Markets.
Leveraged products (including contracts for difference) are speculative in nature and may result in losses or profit. Before you start trading, you should make sure that you understand all the risks.