By TheTechnicalTraders – Understanding the stock market and its potential through the use of technical analysis and historical price events has been proven repeatedly to outperform all forms of fundamental trading styles. The following is a story that walks you through my experience, the shift in my mindset and how I came to the conclusion that the three charts I share in this article are critical to your understanding of to make money in today’s market!
When I first learned to trade, I got all caught up with researching companies and finding the ones with the best earnings and future growth. I did that for several years after studying and following many “professional traders” who said it was the best way to trade and invest long term. We lost our shirts during the 2000 bear market by continuing to trade on fundamentals as stocks fell in value week after week. Even the companies that showed quarterly earnings growth fell in value – none of it seemed to make any sense to me, and it was very frustrating.
Losing money when buying the best companies made no logical sense, making me step back from the markets and ask myself, ‘what am I doing wrong here‘. People today are asking themselves the same question given today’s dizzying markets:
· Telsa shares fell from $971 a share down to $347, whopping 63% drop, in only a few weeks and then rebounded again too xx
· Netflix is down 30%, even though people are stuck at home desperately trying to find things to watch)
· Amazon has fallen 26% in the past couple of weeks despite soaring demand for their delivery services
· GDXJ, the gold miners sector that is typically a safe haven during times of volatility, crashed 57% even though gold is usually a safe haven during times of volatility.
So, what was I doing wrong? I started calling and visiting traders who were making money during the bear market to see what they were doing, and 100% of them were doing the same thing – Trading with Technical Analysis. I wasn’t doing anything wrong, per se. I was simply using the wrong tools and analysis for success!
What is Technical Analysis? In short, it’s the study of price, time, and volatility of any asset using price charts and indicators. Traders use technical analysis to find cycles and patterns in the market and trade on the analysis of preferred indicators as opposed to the fundamentals of a company and/or the economy in general.
When you start studying technical traders, you will notice every trader has a particular time frame, a preferred set of indicators, and trading frequency that fits their unique personality and lifestyle. Their brains can see the charts in ways you and I may not see them to predict future price direction over the next few hours, days, weeks, or months ahead. I quickly learned there are infinite ways to trade using technical analysis.
I was very surprised by how much these pro traders allowed me. While standing over their shoulders, I was looking at their charts to try to divine their high-level strategies and learn how they think, analyze, and trade. It was amazing how different each of them traded the market. Some traded currencies; others traded stocks, indexes, options, futures, etc. Most were day traders, swing traders, or a mix of the two. But none of them gave me their secret sauce. That is why I turned 100% of my focus to technical analysis. I was excited at the prospect of being able to profit from both rising and falling prices and no concern for anything other than price action reduced my research time dramatically. It was and is the biggest AH-HA moment of my life and a turning point for my career as a trader.
The year was 2001, when I made the shift to technical analysis. I unsubscribed from everything fundamental based. I canceled my CNBC, stopped listing to news, and stopped reading other people’s reports altogether. My goal was to create my own technical trading strategy that best suited my personality and lifestyle. I would have to discover the securities I was most comfortable trading, the frequency I would trade, and the type and amount of risk I was prepared to take.
I traded options, covered-calls, currencies, stocks, ETFs, and futures. From day trading to position trading (holding several months), I tried it all, hoping something would click for me to pursue at a much deeper level. Day trading, momentum, and swing trading were my sweet spots. Having three of them was a bonus as I know some traders only ever master one in their lifetime if they are lucky. I grew a liking for trading the major indexes like the DJIA, S&P 500, and Nasdaq… great liquidity with big money always at play.
Along my journey, I realized that if I could predict the overall market trend direction for the day or week, then I could day-trade small-cap stocks in the same direction as the index, knowing 80+% of the stocks follow the general stock market trend. I could generate much larger gains in a very short period of time. As time went on, I became comfortable predicting, trading, and profiting from the indexes, and my new trading strategy began to emerge.
I was fortunate enough to start learning about the markets and trading in college with a $2,000 E-Trade account, and then retiring (kinda) in 2009 at the age of 28. I built my dream home on the water, bought cars and boats, and spent time traveling with my growing family. I love trading and sharing my analysis with others – it is better than I had ever imagined and why I continue to help thousands of traders around the world every day with these video courses Trading System Mastery, and Trading As Your Business so you learn and make money from your home forever.
I contribute 100% of my trading success and lifestyle to the fact that I embraced technical analysis, where my strategy involves nothing more than price movement, position-sizing, and trade risk management techniques. All these allow me to easily reduce exposure, drawdowns, and losses with proper position sizing and protective strategies. If you want quick and simple, read about my journey and core trading tools in my book Technical Trading Mastery – 7 Steps to Win with Logic. My strategy is represented by human psychology and historical trading, as expressed in the three charts below.
Chart 1 – Human Psychology Is What Drives Price Action
This chart is my favorite as it explains trader and investor psychology at various market stages. It also includes a simplified market cycle in the upper right corner, letting you know where the maximum financial risk is for investors and the highest opportunity for a trade.
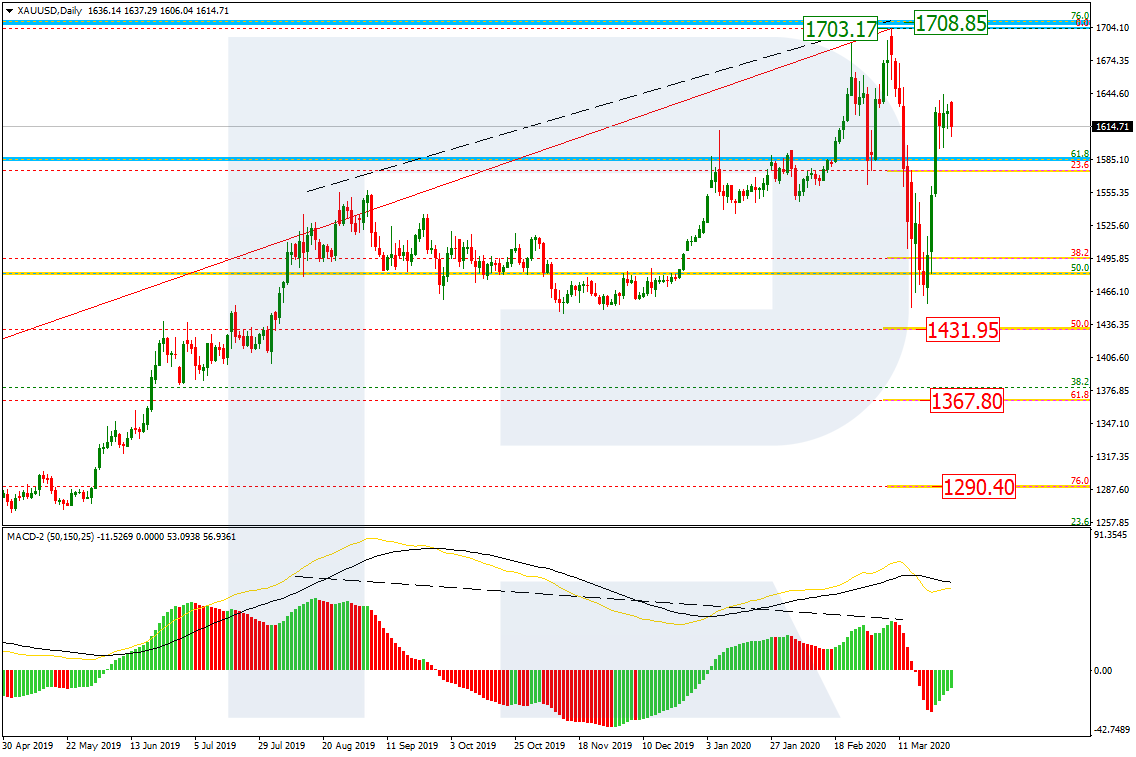
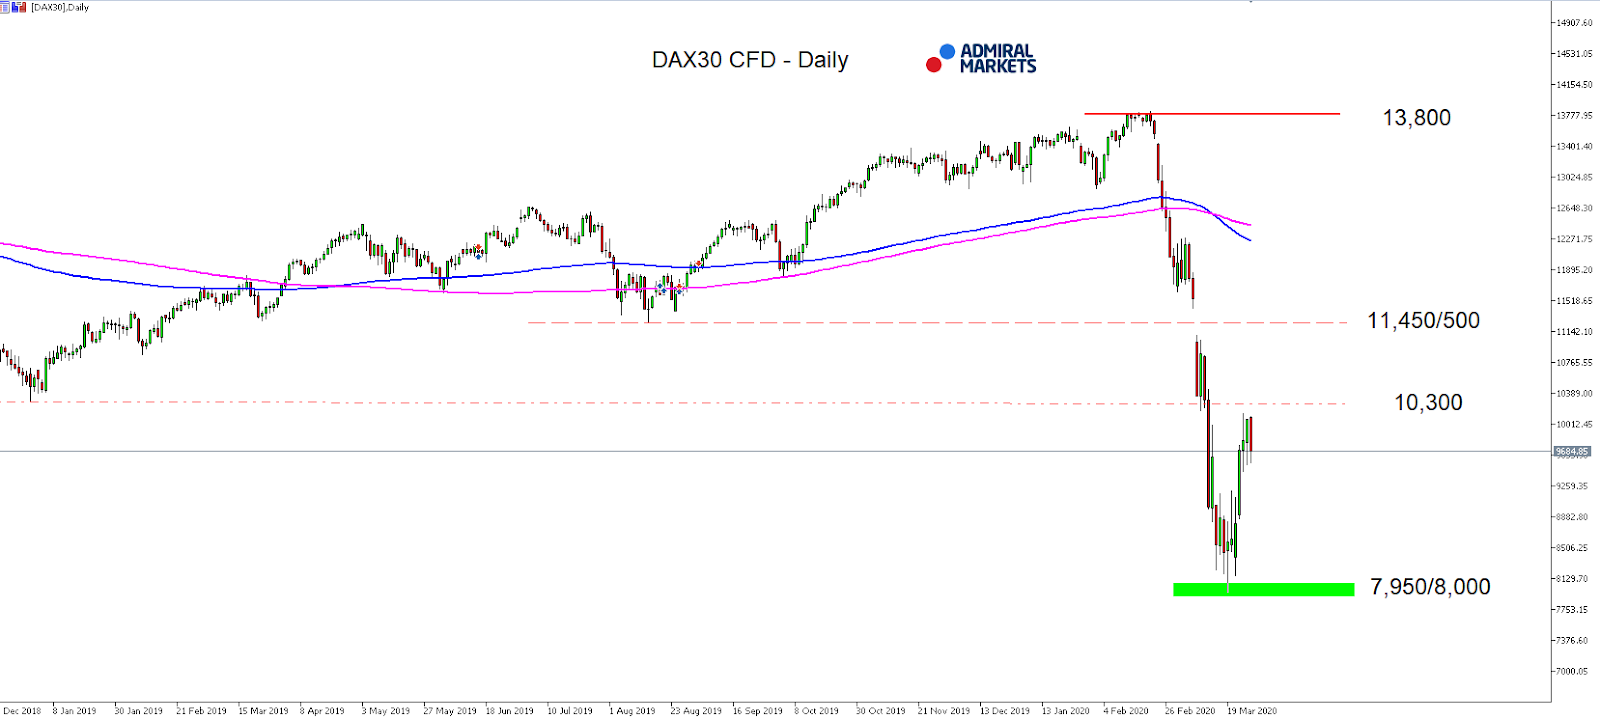
Chart 2 – 2000 Stock Market Top & Bear Market That Followed
The chart may look a little overwhelming, but look at each part and compare it to the market psychology chart above. What happened in 2000 is what I feel is happening this year with the stock market sell-off.
In 2000, all market participants learned of at the same time was that there were no earnings coming from their darling .com stocks. Knowing they were not going to make money for a long time, everyone started selling these terrible stocks, and the market collapsed 40% very quickly.
What is similar between 2000 and 2020? Simple really. COVID-19 virus has halted a huge portion of business activity, travel, purchases, sporting events, etc. Everyone knows earnings are going to be poor, and many companies are going to go bankrupt. It is blatantly clear to everyone this is bad and will be for at least 6-12 months in corporate earnings; therefore, everyone is in a rush to sell their stock shares and are in a panic to unload them before everyone does.
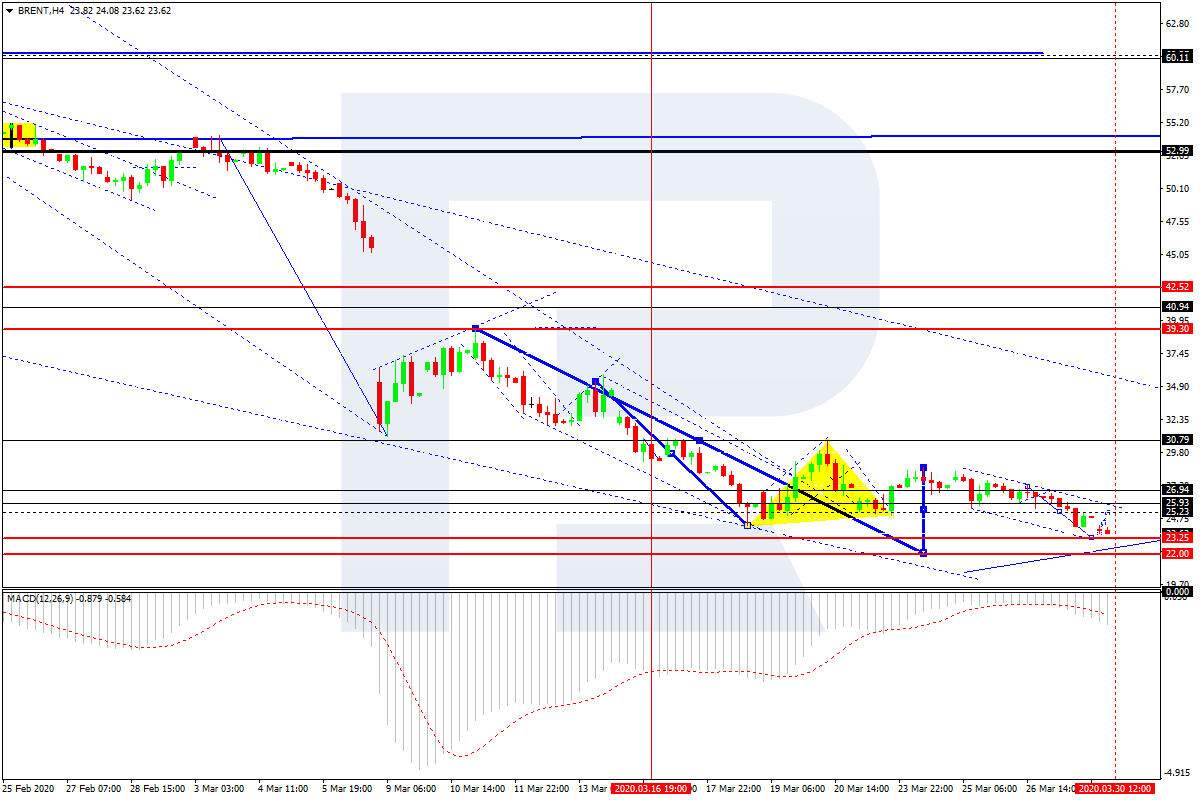
Chart 3 – The 2020 Stock Market Top Looks To Be Unfolding
As you can see, this chart below of this year’s market crash is VERY similar to that of 2000 thus far, it’s based on a similar mindset, which is the fear of losing money, which causes everyone to sell their positions.
I am hopeful that we get a 25-30% rally from these lows before the market starts to fall and continue the new bear market, which I believe we are entering. Only the price will confirm the direction and major trend to follow, and since we follow price action and do not pick tops or bottoms, all we have to do is watch, learn, and trade when price favors new low-risk, high reward trade setups.
It does not matter which way the market crashes from here, we will either profit from the next leg down, or will miss/avoid it depending on if we get a tradable setup. Either cause is a win, just one makes money, while the worst-case scenario just preserves capital in a cash position, you can’t complain either way if you ask me.
Before you continue, be sure to opt-in to our free market trend signals
before closing this page, so you don’t miss our next special report!
Concluding Thoughts:
In short, is if you lost money during the recent market crash, then you likely have not mastered a technical trading strategy and do not have proper trade management rules in place. All traders must manage risk and trades to be sure you lock in profits and limit losses when prices start pullback or collapse. Without either of these, you will not be able to achieve long term success/gains, and that’s a fact.
While we can all make money during a bull market when stocks are rising, if you cannot retain or grow your account during market downturns, then you may as well be a passive buy and hold investors. You are better at riding the emotional investor rollercoaster without wasting your time and effort as a trader if you are not going to spend the time and money to learn to follow someone to become a successful trader. Without proven trading strategies or someone to follow, you are more likely to underperform a long-term passive investor.
I get dozens of emails from people every week trying to trade this wild stock market and use leveraged ETFs, which doing so during these unprecedented market conditions is absolute craziness if you ask me.
These people think that because there are big moves in the market, they should be trading. That big money should be made trading them, which drives me crazy because it could not be further from the truth unless you are a scalp or day trader. To me, in this market condition, it’s about preserving capital, not risking it, in my opinion.
A subscriber to my market video analysis and ETF trading newsletter said it perfectly:
“Always intrigues me how many amateur surfers get to the north shore beaches in Hawaii, take one look at monster waves and conclude it’s way too dangerous. Yet the amateur trader looks at treacherous markets like these and wants to dive right in!!” Richard P.
I have to toot my own horn here a little because subscribers and I had our trading accounts close at a new high watermark for our accounts. We not only exited the equities market as it started to roll over we profited from the sell-off in a very controlled way.
I hope you found this informative, and if you would like to get a pre-market video every day before the opening bell, along with my trade alerts, visit my ETF swing trading visit my website at TheTechnicalTraders.com.
Chris Vermeulen
Founder of Technical Traders Ltd.
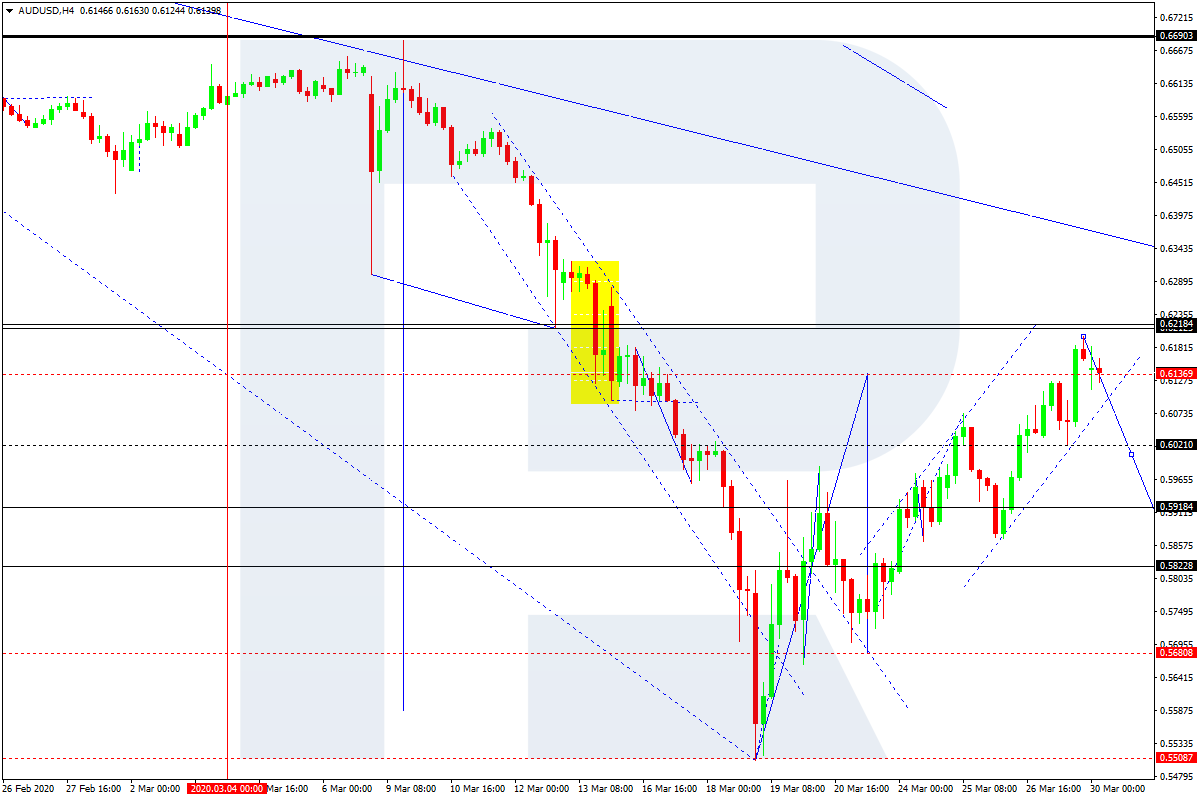
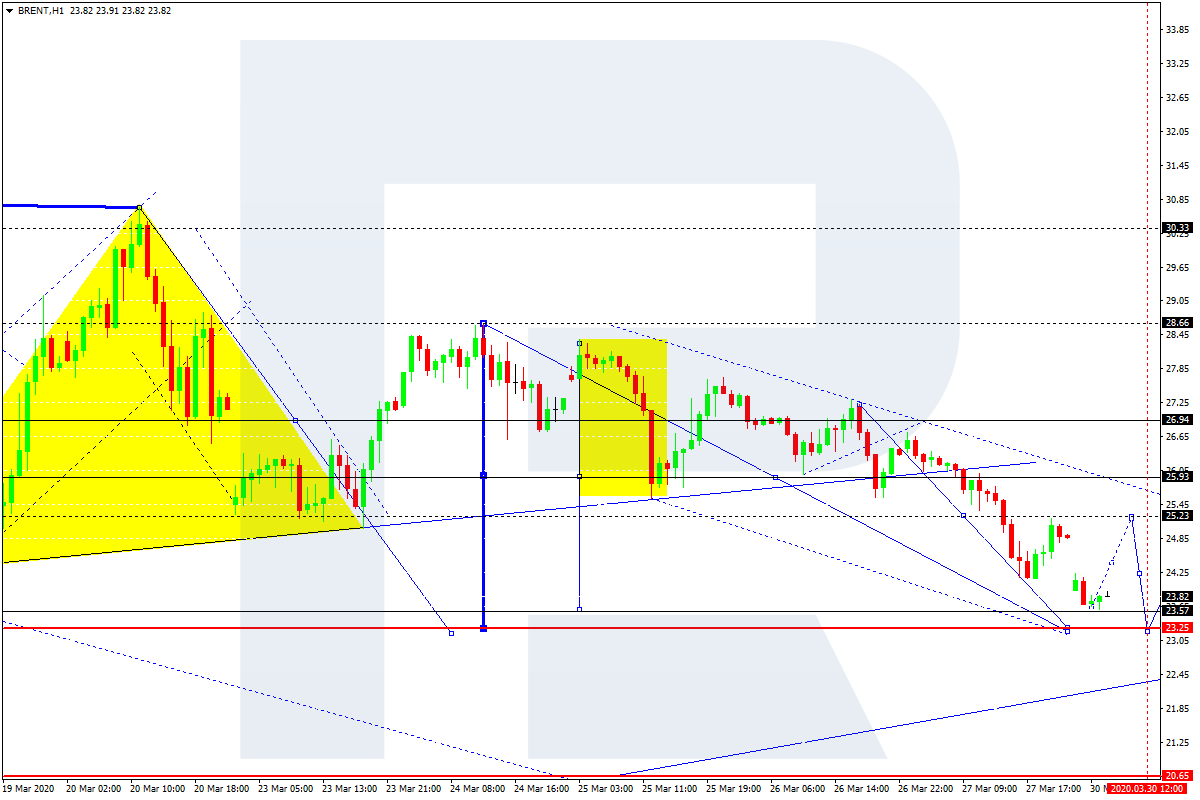
 Current situation:
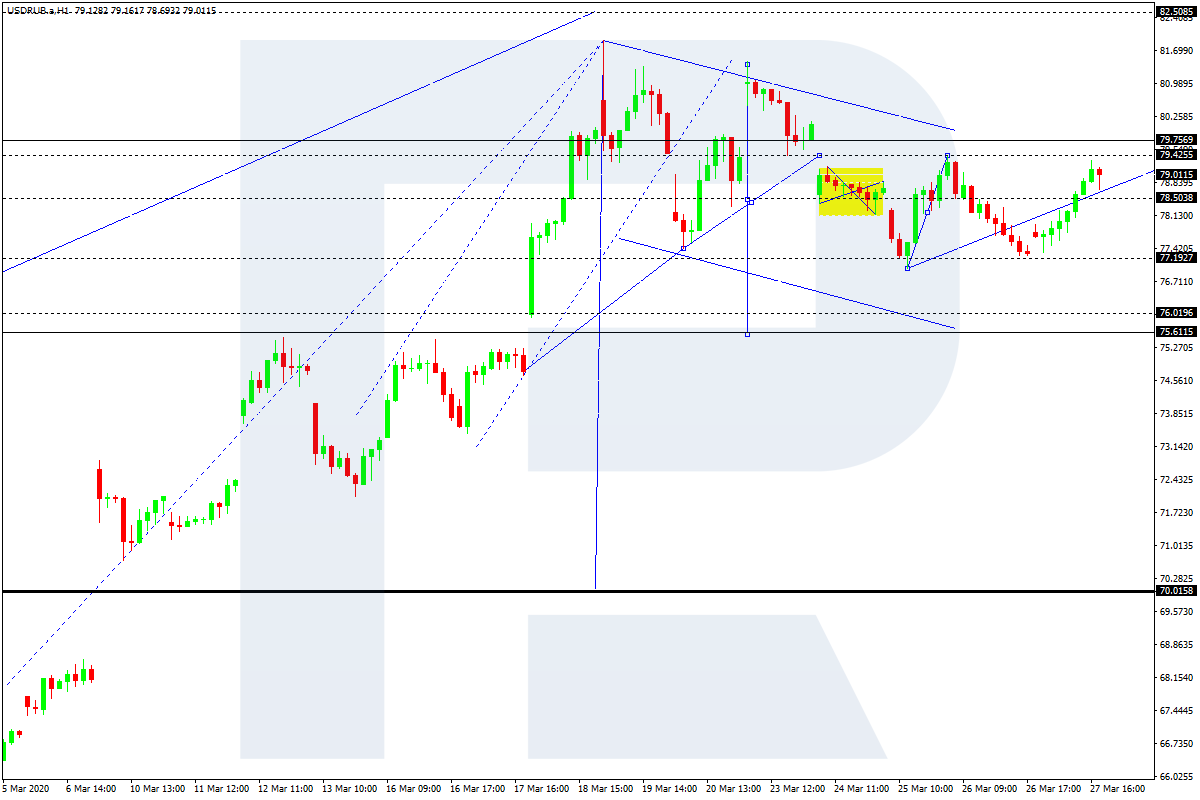
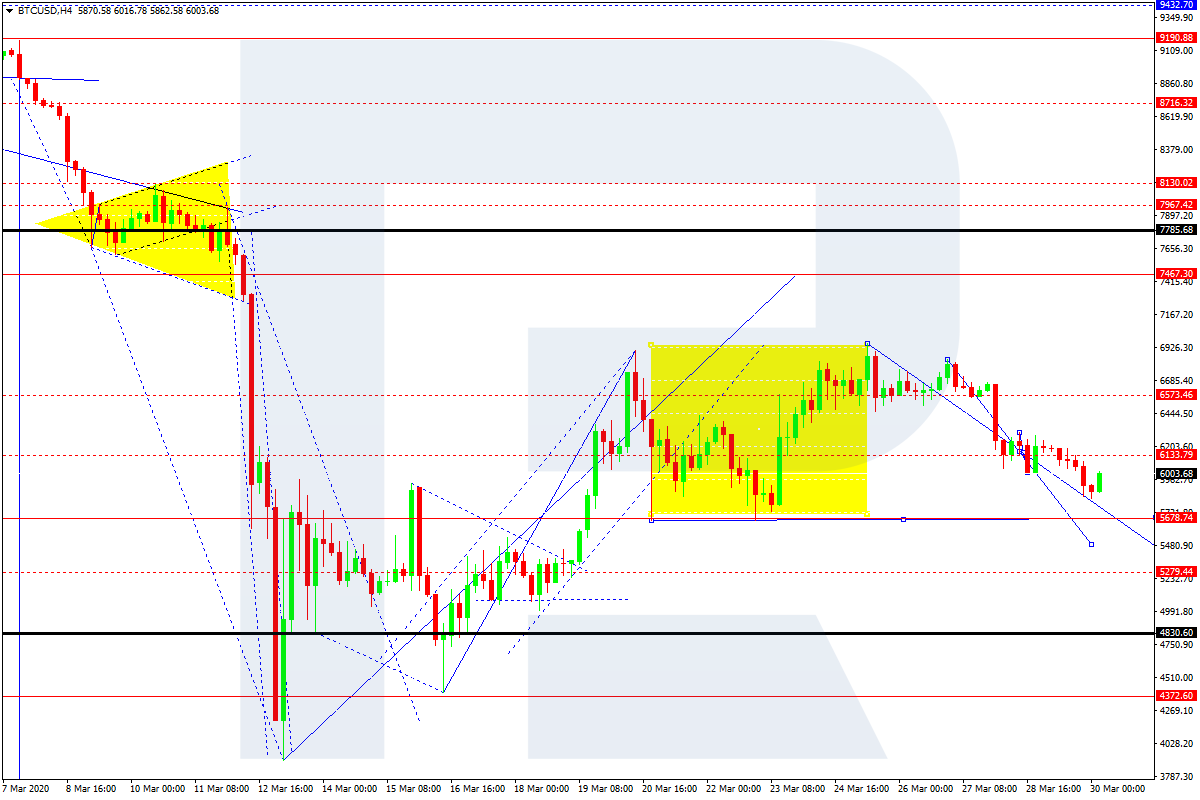