Author Archive for InvestMacro – Page 65

Fibonacci Retracements Analysis 01.04.2020 (GBPUSD, EURJPY)

Article By RoboForex.com

GBPUSD, “Great Britain Pound vs US Dollar”

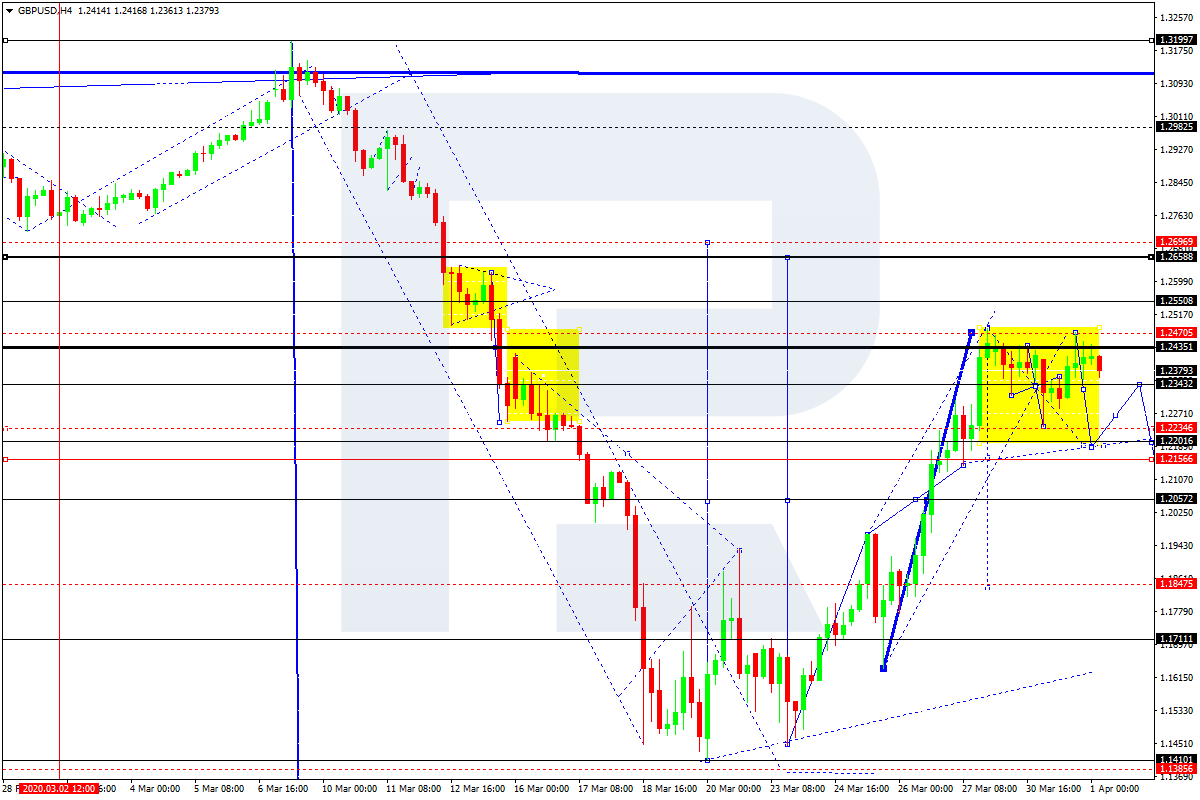
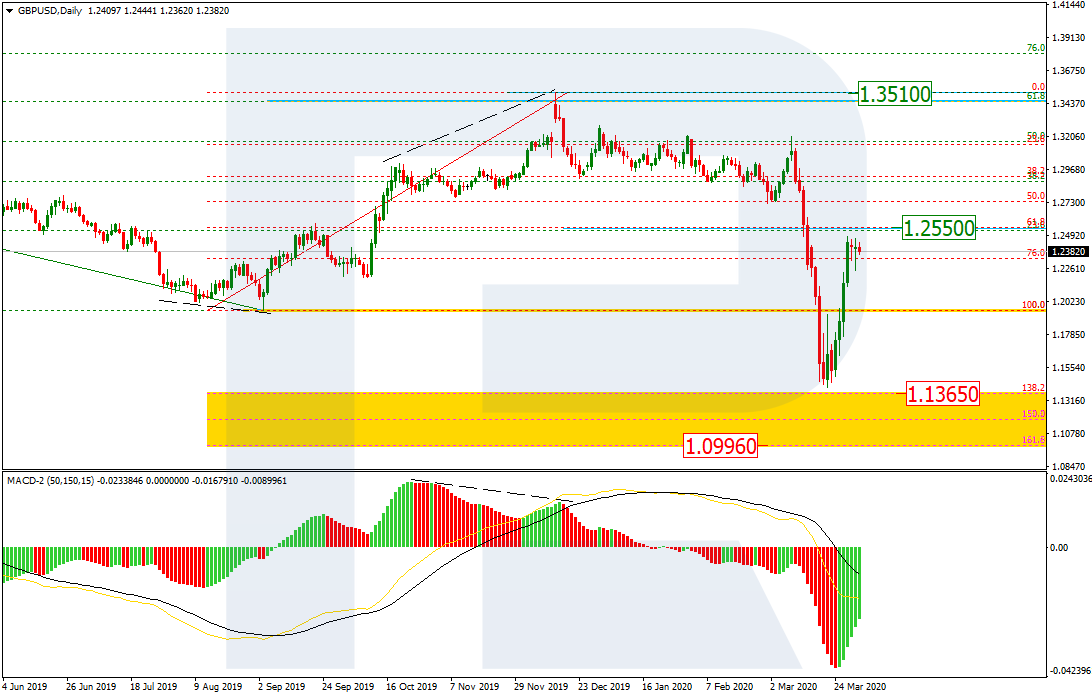
As we can see in the daily chart, GBPUSD is correcting the previous descending wave and trying to fix above the low at 1.1958; by now, the pair has stopped its growth not far from the resistance at 61.8% fibo (1.2550). If the price rebounds from this level, the instrument may resume falling towards the post-correctional extension area between 138.2% and 161.8% fibo at 1.1365 and 1.0996 respectively. However, if the price breaks 61.8% fibo at 1.2550, it may grow to attach the high at 1.3510.

GBPUSD_D1
Risk Warning: the result of previous trading operations do not guarantee the same results in the future

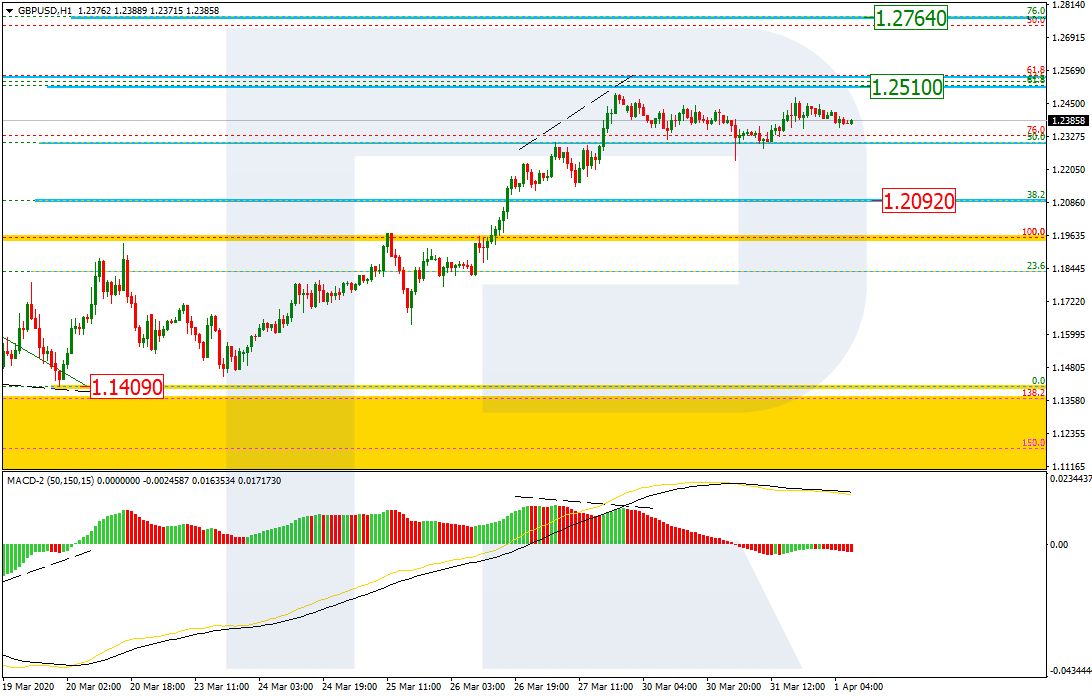
In the H1 chart, the local convergence made the pair start a new correction. The support is at 38.2% fibo (12092). After completing the pullback, the pair may resume growing to reach 61.8% and 76.0% fibo at 1.2510 and 1.2764 respectively.

GBPUSD_H1
Risk Warning: the result of previous trading operations do not guarantee the same results in the future

EURJPY, “Euro vs. Japanese Yen”

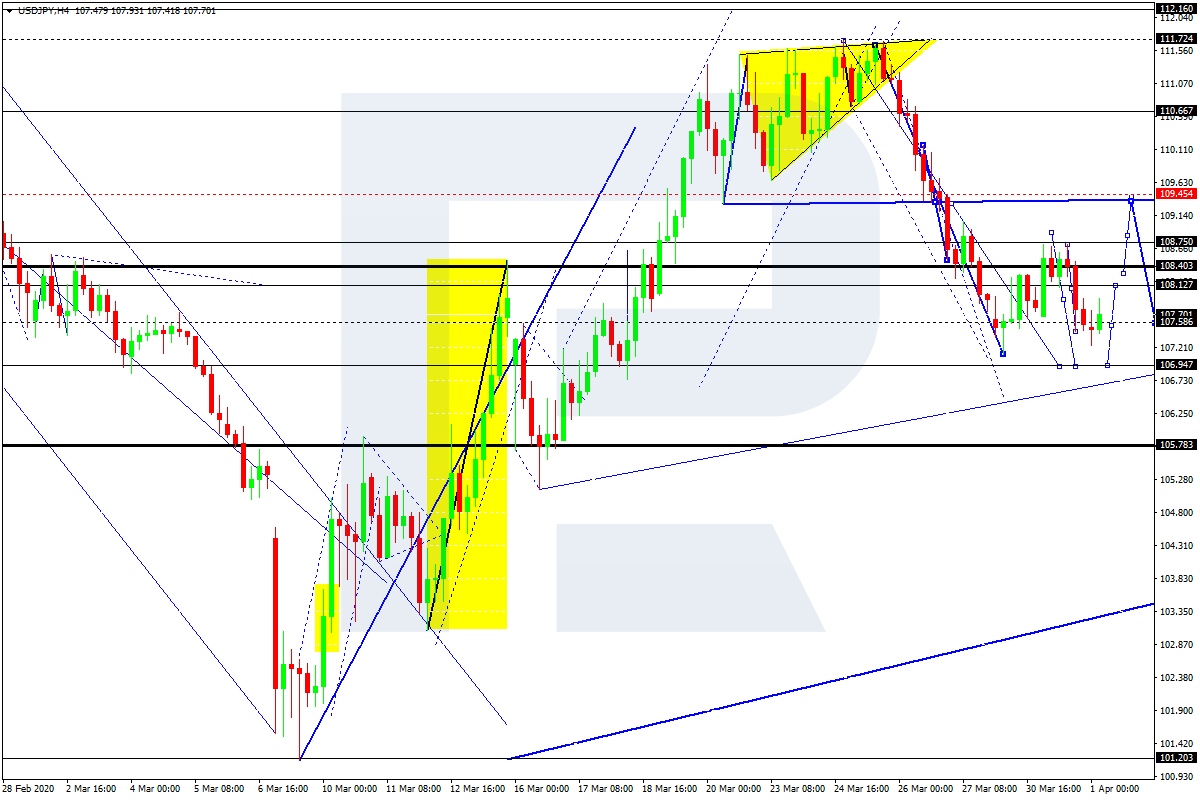
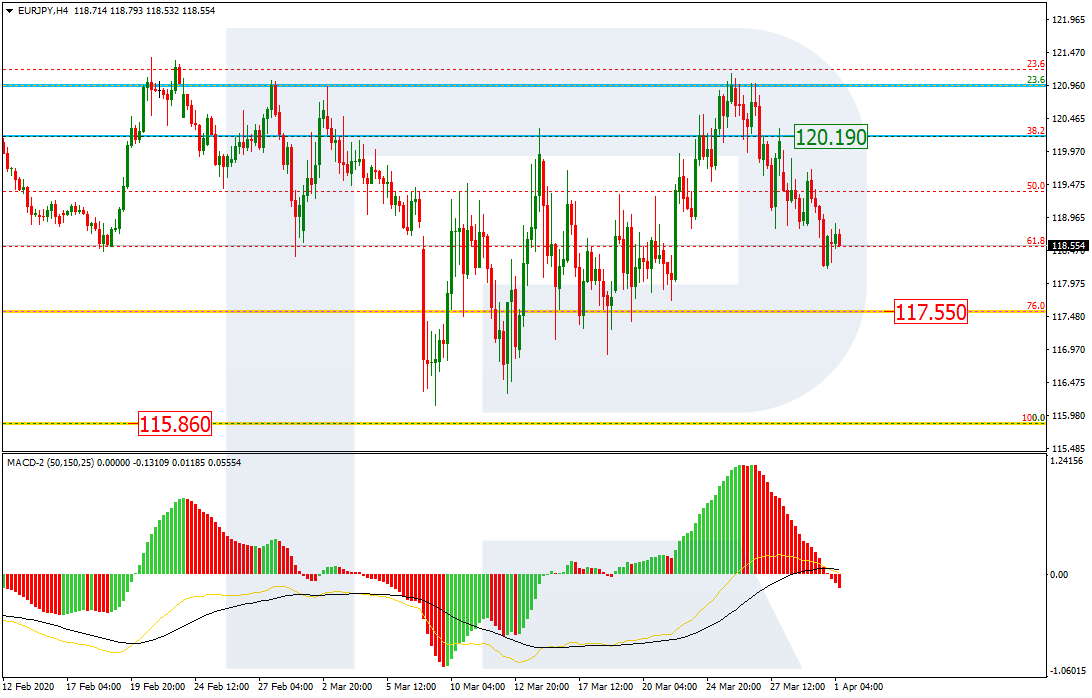
As we can see in the H4 chart, EURJPY has failed to break the highs despite an attempt to fix above the resistance at 38.2% fibo (120.19). Right now, the price is returning to towards 76.0% fibo at 117.55. If later the pair breaks this level, the instrument may continue falling to reach the low at 115.86.

EURJPY_H4
Risk Warning: the result of previous trading operations do not guarantee the same results in the future

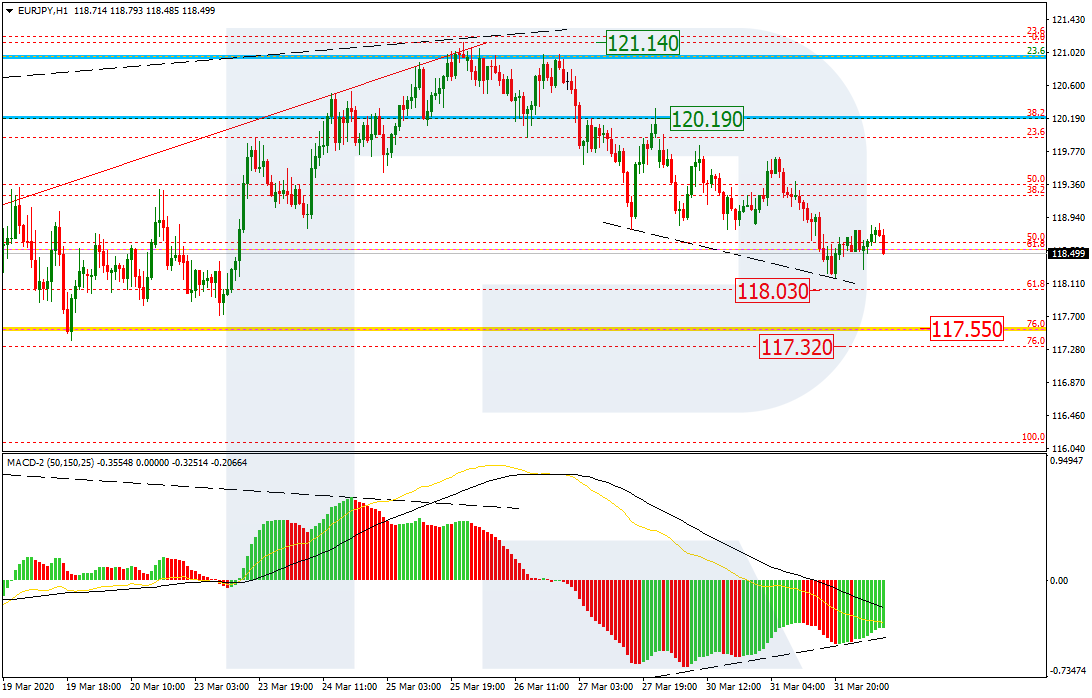
In the H1 chart, the pair is trading downwards to reach 61.8% and 76.0% fibo at 118.03 and 117.32 respectively. At the same time, there is a convergence on MACD, which may indicate a possible pullback or reversal. The resistance is the local high at 121.14.

EURJPY_H1

Article By RoboForex.com

Attention!
Forecasts presented in this section only reflect the author’s private opinion and should not be considered as guidance for trading. RoboForex LP bears no responsibility for trading results based on trading recommendations described in these analytical reviews.

Stocks: When Grass Looks Greener on the Other Side of the … Pond

By Elliott Wave International

Let’s start by establishing that the stock market is not driven by the news. Aggregate stock prices are driven by waves of optimism and pessimism — which go from one extreme to another — as reflected by the Elliott wave model. That’s what makes the stock market predictable.

Hence, Elliott wave analysis is at the core of EWI’s stock market forecasts.

Having said that, sentiment indicators are also valuable in providing clues about “what’s next.”

For example, Robert Prechter’s book, Prechter’s Perspective, made this observation:

No crowd buys stocks of other countries intelligently. For decades, heavy foreign buying in the U.S. stock market has served as an excellent indicator of major tops.

Well, in the year 2000, that’s exactly what happened. Foreign purchases of U.S. shares spiked to a then record $402 billion in March 2000. The spike in foreign buying coincided precisely with a price peak in the S&P 500. From the month of the high in March 2000 through October 2002, the S&P declined 51%.

Fast forward to December 2019, when our Elliott Wave Financial Forecast showed two charts related to overseas buying of U.S. shares. Here’s the first one:

This chart notes our discussion about foreign buying in the year 2000 and also in August 2007: “The first five months of [2007] produced what was easily the biggest gusher of net foreign buying in history. The record suggests that falling prices lie directly ahead for the U.S. market.”

The historic stock market top of 2007 occurred just two months later.

Here’s the second chart from the December 2019 Elliott Wave Financial Forecast, along with the commentary:

The chart of foreign holdings of U.S. stocks shows a new record of $7.7 trillion in total stock holdings as of July [2019]. On November 7, The Wall Street Journal reported that the “appetite for U.S. shares among international clients has shown few signs of abating.” Foreigners are all in on the U.S. stock market rally. Our bet is that it will end in a major top just as it did in 2000 and 2007.

Plus, the Elliott wave model was also indicating that the stock market top was approaching. The Jan. 2020 Elliott Wave Financial Forecast noted:

The rally is the final [wave] of the bull market.

The February 2020 stock market top occurred just a month later.

As you know, historic stock market volatility has unfolded since then. Interestingly, during highly emotional markets — such as what investors face now — Elliott waves tend to be clear.

So, now is the ideal time to learn all you can about the Elliott wave method of analyzing and forecasting financial markets.

You can do so free!

You see, when you signup for a free Club EWI membership, you get instant, free access to the online version of the book, Elliott Wave Principle: Key to Market Behavior, by Frost & Prechter. You can have this Wall Street classic on your computer screen in just moments!

Forex Technical Analysis & Forecast 01.04.2020

Article By RoboForex.com

EURUSD, “Euro vs US Dollar”

EURUSD has almost completed the correction by finishing the descending wave towards 1.0926; right now, it is forming the second ascending impulse. After breaking 1.1060, the instrument may grow to reach 1.1100. Later, the market may break this level as well and then continue trading upwards with the short-term target at 1.1140.

EURUSD
Risk Warning: the result of previous trading operations do not guarantee the same results in the future

GBPUSD, “Great Britain Pound vs US Dollar”

GBPUSD continues consolidating around 1.2343. Possibly, today the pair may fall towards 1.2200 and then grow to return to 1.2343. If later the price breaks this range to the downside, the market may form a new descending structure towards 1.2055; if to the upside – resume trading upwards with the target at 1.2555.

GBPUSD
Risk Warning: the result of previous trading operations do not guarantee the same results in the future

USDCHF, “US Dollar vs Swiss Franc”

USDCHF has completed the correction by finishing the ascending structure at 0.9684; right now, it is forming another descending structure to break 0.9580. After that, the instrument may continue trading downwards with the target at 0.9467.

USDCHF
Risk Warning: the result of previous trading operations do not guarantee the same results in the future

USDJPY, “US Dollar vs Japanese Yen”

USDJPY has rebounded from 108.78 to the downside. Today, the pair may fall to reach 106.94 and then resume trading upwards with the target at 109.45.

USDJPY
Risk Warning: the result of previous trading operations do not guarantee the same results in the future

AUDUSD, “Australian Dollar vs US Dollar”

AUDUSD is forming a wide consolidation range around 0.6140. Possibly, today the pair may trade downwards to break 0.6066 and then continue falling with the target at 0.5919.

AUDUSD
Risk Warning: the result of previous trading operations do not guarantee the same results in the future

USDRUB, “US Dollar vs Russian Ruble”

USDRUB is falling; it is still consolidating around 78.45. Possibly, the pair may form one more ascending structure towards 79.75. However, the main scenario implies that the price is expected to fall to break 76.90 and then continue trading downwards with the target at 74.33.

USDRUB
Risk Warning: the result of previous trading operations do not guarantee the same results in the future

USDCAD, “US Dollar vs Canadian Dollar”

USDCAD has completed the correction at 1.4333; right now, it is trading downwards to reach 1.3822. Later, the market may start another correction with the target at 1.4233.

USDCAD
Risk Warning: the result of previous trading operations do not guarantee the same results in the future

XAUUSD, “Gold vs US Dollar”

Gold has finished the descending wave at 1560.50. Today, the pair may correct to reach 1597.50. After that, the instrument may continue trading downwards with the short-term target at 1557.50.

GOLD
Risk Warning: the result of previous trading operations do not guarantee the same results in the future

BRENT

After forming another consolidation range around 23.60, Brent has broken it to the downside. Possibly, today the pair may fall towards 22.00 and then form one more ascending structure to return to 23.60. After that, the instrument may break the latter level and continue trading upwards with the target at 25.40.

BRENT
Risk Warning: the result of previous trading operations do not guarantee the same results in the future

BTCUSD, “Bitcoin vs US Dollar”

BTCUSD is still consolidating around 6100.00. Possibly, the pair may form one more ascending structure towards 6900.00. If later the price breaks this range to the downside, the market may resume trading downwards to reach 5600.00 or even 5300.00; if to the upside – start a new growth with the target at 7600.00.

BITCOIN

Article By RoboForex.com

Attention!
Forecasts presented in this section only reflect the author’s private opinion and should not be considered as guidance for trading. RoboForex LP bears no responsibility for trading results based on trading recommendations described in these analytical reviews.

EURUSD: renewed drop to the D3 line on the cards

By Alpari.com

On Tuesday the 31st of March, trading on the euro closed slightly down. After dropping to 1.0927, the pair recovered to 1.1039. The bears hit fresh lows following a breakout of the trend line during the Asian session. The rebound occurred on the back of the US Fed’s decision to launch a temporary repurchase agreement facility for foreign central banks.

Day’s news (GMT+3):

  • 10:30 Switzerland: SVME PMI (Mar).
  • 10:50 France: Markit manufacturing PMI (Mar).
  • 10:55 Germany: Markit manufacturing PMI (Mar).
  • 11:00 Eurozone: Markit manufacturing PMI (Mar).
  • 11:30 UK: Markit manufacturing PMI (Mar).
  • 12:00 Eurozone: unemployment rate (Feb).
  • 15:15 US: ADP employment change (Mar).
  • 16:45 US: Markit manufacturing PMI (Mar).
  • 17:00 US: ISM manufacturing PMI (Mar), construction spending (Feb).
  • 17:30 US: EIA crude oil stocks change (27 Mar).

Pic. 1Current situation:

As expected, the pair dropped to the D3 line, subsequently rebounding to the LB balance line. The coronavirus rages on across the world. Meanwhile, the US Fed is taking measures to increase the dollar’s liquidity, which is having a negative effect on the currency itself. Regardless, the situation in Europe isn’t any better, and buying the euro isn’t an enticing prospect either.

Since the rate bounced from the D3 line without any divergence, today we expect the pair to fall from the LB line and revisit yesterday’s low with a new test of the D3 line. The technicals indicate growth, but since the pair is trading beneath the LB line, and there’s no divergence on the AO indicator, it’s reasonable to expect a test of 1.0927. We could be mistaken, but we think it better to be in the bears’ camp for today. Once the pair hits fresh lows, markets will begin preparing for Friday’s NFP report.

By Alpari.com

The Analytical Overview of the Main Currency Pairs on 2020.04.01

by JustForex

The EUR/USD currency pair

Technical indicators of the currency pair:
  • Prev Open: 1.10430
  • Open: 1.10390
  • % chg. over the last day: -0.15
  • Day’s range: 1.09712 – 1.10338
  • 52 wk range: 1.0777 – 1.1494

The greenback has become stable against major competitors. Financial market participants expect additional drivers. The EUR/USD currency pair is currently consolidating. The local support and resistance levels are 1.09600 and 1.10400, respectively. In the near future, a technical correction of the trading instrument is not ruled out. We expect important economic releases. We recommend opening positions from key levels.

The Economic News Feed for 01.04.2020:

  • – German manufacturing PMI at 10:55 (GMT+3:00);
  • – ADP nonfarm employment change at 15:15 (GMT+3:00);
  • – ISM manufacturing PMI at 17:00 (GMT+3:00).
EUR/USD

Indicators do not give accurate signals: the price has fixed between 50 MA and 100 MA.

The MACD histogram is near the 0 mark.

Stochastic Oscillator is in the neutral zone, the %K line is below the %D line, which indicates the bearish sentiment.

Trading recommendations
  • Support levels: 1.09600, 1.08850, 1.08000
  • Resistance levels: 1.10400, 1.11450

If the price fixes below 1.09600, the EUR/USD currency pair is expected to correct. The movement is tending to the round level of 1.09000.

An alternative could be the growth of EUR/USD quotes to 1.11000-1.11200.

The GBP/USD currency pair

Technical indicators of the currency pair:
  • Prev Open: 1.23978
  • Open: 1.24140
  • % chg. over the last day: +0.03
  • Day’s range: 1.23302 – 1.24438
  • 52 wk range: 1.1466 – 1.3516

The GBP/USD currency pair is still being traded in a flat. There is no defined trend. The key support and resistance levels are 1.23000 and 1.24800, respectively. In the near future, a technical correction of the trading instrument is not ruled out. Today, investors will assess important statistics from the UK and the US. Positions should be opened from key levels.

At 11:30 (GMT+3:00), UK manufacturing PMI will be published.

GBP/USD

Indicators do not give accurate signals: the price has crossed 50 MA.

The MACD histogram is near the 0 mark.

Stochastic Oscillator is in the neutral zone, the %K line has crossed the %D line. There are no signals at the moment.

Trading recommendations
  • Support levels: 1.23000, 1.21450, 1.20150
  • Resistance levels: 1.24800, 1.25500

If the price fixes below the round level of 1.23000, GBP/USD quotes are expected to fall. The movement is tending to 1.22000-1.21000.

An alternative could be the growth of the GBP/USD currency pair to 1.25500-1.26000.

The USD/CAD currency pair

Technical indicators of the currency pair:
  • Prev Open: 1.41624
  • Open: 1.40648
  • % chg. over the last day: -0.77
  • Day’s range: 1.40569 – 1.41958
  • 52 wk range: 1.2949 – 1.4668

Since the beginning of this week, trading on the USD/CAD currency pair has been very active. At the same time, there is no defined trend. The loonie is currently consolidating in the range of 1.41000-1.42000. The Canadian dollar is under pressure due to a significant collapse in oil prices. Today we recommend paying attention to economic reports from the US. Positions should be opened from key levels.

The news feed on Canada’s economy is calm.

USD/CAD

Indicators do not give accurate signals: the price has fixed between 50 MA and 100 MA.

The MACD histogram is near the 0 mark.

Stochastic Oscillator is in the overbought zone, the %K line has crossed the %D line. There are no signals at the moment.

Trading recommendations
  • Support levels: 1.41000, 1.40100, 1.39250
  • Resistance levels: 1.42000, 1.43350, 1.44150

If the price fixes above 1.42000, the USD/CAD currency pair is expected to grow. The movement is tending to 1.42750-1.43500.

An alternative could be a decrease in the USD/CAD quotes to 1.40500-1.39500.

The USD/JPY currency pair

Technical indicators of the currency pair:
  • Prev Open: 107.694
  • Open: 107.498
  • % chg. over the last day: -0.26
  • Day’s range: 107.253 – 107.938
  • 52 wk range: 101.19 – 112.41

There is an ambiguous technical pattern on the USD/JPY currency pair. The trading instrument is in a sideways trend. Investors expect additional drivers. At the moment, the local support and resistance levels are 107.200 and 107.900, respectively. Demand for the “safe haven” currencies is still high. The yen has the potential for further growth against the US currency. Positions should be opened from key levels.

Positive economic releases from Tankan were published during the Asian trading session.

USD/JPY

Indicators do not give accurate signals: the price is consolidating near 50 MA.

The MACD histogram is in the negative zone, indicating the bearish sentiment.

Stochastic Oscillator is in the neutral zone, the %K line has crossed the %D line. There are no signals at the moment.

Trading recommendations
  • Support levels: 107.200, 106.500.
  • Resistance levels: 107.900, 108.700, 109.200

If the price fixes below 107.200, a further drop in the USD/JPY quotes is expected. The movement is tending to 106.500-106.200.

An alternative could be the growth of the USD/JPY currency pair to 108.500-109.000.

by JustForex

A new Gold liquidation wave, driven by ADP data, on Wednesday?

By Admiral Markets

Economic Events

Source: Economic Events April 1, 2020 – Admiral Markets’ Forex Calendar

On Wednesday, all eyes will be on the ADP Employment Change at 12:15pm GMT.

After Initial jobless claims saw a historically high print at 3.28 million last Thursday, the highest since the Department of Labour started tracking the data in 1967, it will be interesting to see if we get to see a similarly weak ADP print. Around the Great Financial Crisis in 2008, we saw a (negative) record at -835k which will be difficult to beat, as the coming data is is expected to be published around -154k.

But a print which comes in significantly below the expectation of -154k could still trigger elevated volatility, since it would potentially point to a wider US economic downturn, and after US president Trump said last Sunday that federal coronavirus guidelines such as social distancing are to be extended until at least April 30, going beyond Easter. A shutdown that continues beyond expectations could result in an even more damaging effect on the US economy.

Usually, this would be bullish for Gold, and after Gold found a (short-term) bottom around 1,440/450 USD, and with Fed’s stimulus last week (where it was announced the US central bank plans to buy an unlimited amount of US Treasuries and Mortgage-Backed-Securities (MBS)), a further push higher to and beyond 1,700 USD seems to be favoured, but we’d like to be a little careful here.

In fact, we could imagine seeing another wave of selling in classic “safe-haven” assets like Gold, resulting out of a credit crunch and liquidating everything to stay solvent.

That in mind, another “liquidation wave” could bring a short-term drop below 1,440/450 USD into play which would technically darken the picture, activating 1,250/260 USD as a first target:

Gold Daily chart

Source: Admiral Markets MT5 with MT5-SE Add-on Gold Daily chart (between December 31, 2018, to March 31, 2020). Accessed: March 31, 2020, at 10:00pm GMT – Please note: Past performance is not a reliable indicator of future results, or future performance.

In 2015, the value of Gold fell by 10.4%, in 2016, it increased by 8.1%, in 2017, it increased by 13.1%, in 2018, it fell by 1.6%, in 2019, it increased by 18.9%, meaning that after five years, it was up by 28%.

Discover the world’s #1 multi-asset platform

Admiral Markets offers professional traders the ability to trade with a custom, upgraded version of MetaTrader 5, allowing you to experience trading at a significantly higher, more rewarding level. Experience benefits such as the addition of the Market Heat Map, so you can compare various currency pairs to see which ones might be lucrative investments, access real-time trading data, and so much more. Click the banner below to start your FREE download of MT5 Supreme Edition!

Download MetaTrader 5 and begin trading today!

Disclaimer: The given data provides additional information regarding all analysis, estimates, prognosis, forecasts or other similar assessments or information (hereinafter “Analysis”) published on the website of Admiral Markets. Before making any investment decisions please pay close attention to the following:

  1. This is a marketing communication. The analysis is published for informative purposes only and are in no way to be construed as investment advice or recommendation. It has not been prepared in accordance with legal requirements designed to promote the independence of investment research, and that it is not subject to any prohibition on dealing ahead of the dissemination of investment research.
  2. Any investment decision is made by each client alone whereas Admiral Markets shall not be responsible for any loss or damage arising from any such decision, whether or not based on the Analysis.
  3. Each of the Analysis is prepared by an independent analyst (Jens Klatt, Professional Trader and Analyst, hereinafter “Author”) based on the Author’s personal estimations.
  4. To ensure that the interests of the clients would be protected and objectivity of the Analysis would not be damaged Admiral Markets has established relevant internal procedures for prevention and management of conflicts of interest.
  5. Whilst every reasonable effort is taken to ensure that all sources of the Analysis are reliable and that all information is presented, as much as possible, in an understandable, timely, precise and complete manner, Admiral Markets does not guarantee the accuracy or completeness of any information contained within the Analysis. The presented figures refer that refer to any past performance is not a reliable indicator of future results.
  6. The contents of the Analysis should not be construed as an express or implied promise, guarantee or implication by Admiral Markets that the client shall profit from the strategies therein or that losses in connection therewith may or shall be limited.
  7. Any kind of previous or modeled performance of financial instruments indicated within the Publication should not be construed as an express or implied promise, guarantee or implication by Admiral Markets for any future performance. The value of the financial instrument may both increase and decrease and the preservation of the asset value is not guaranteed.
  8. The projections included in the Analysis may be subject to additional fees, taxes or other charges, depending on the subject of the Publication. The price list applicable to the services provided by Admiral Markets is publicly available from the website of Admiral Markets.
  9. Leveraged products (including contracts for difference) are speculative in nature and may result in losses or profit. Before you start trading, you should make sure that you understand all the risks.

By Admiral Markets

The Selloff Structure Explained – Fibonacci On Deck

By TheTechnicalTraders 

– Many traders become very emotional when the markets turn Bearish and fail to properly understand that price structure is still driving market price movement.  This morning, I highlighted this structure to my subscribers attempting to alert them to the possibility that the markets could recover moderately over the next 3 to 5+ days attempting to set up the next “waterfall” downside price event.

On January 29, 2020, I posted a research article detailing my belief that a “waterfall” type of event was setting up in the markets.  This article was nearly 30 days prior to the peak in the markets.  It explained how events take place and how markets tend to develop a moderate recovery phase between selloff price declines.

January 29, 2020: ARE WE SETTING UP FOR A WATERFALL SELLOFF?

Skilled traders should notice the size and levels of each selloff event in the chart (above) and pay very close attention to how price initially collapsed from the peak, then recovered nearly 50% in early and late November before finally setting up a deeper waterfall price collapse in early December.

Our research team believes the US stock markets may attempt something similar over the next 3 to 5+ days as the Covid-19 economic outcome continues to process through the global markets.

The US and other Central Banks have taken broad steps to attempt to overcome the negative economic outcomes related to the Covid-19 global shutdown.  Their biggest concern is that consumer activity could diminish and banking/credit firms could come under severe pressures because of a consumer collapse.

There are over 35 million US low-wage jobs that may become at-risk because of the Covid-19 virus event.  We believe the true economic contagion of the global virus event may now be known until well into April or May 2020.  Yet we believe these at-risk, low-wage jobs are prevalent throughout the globe and foreign nations, such as Asia and Europe, may experience a similar consumer economic contagion over the next 6+ months.

Before you continue, be sure to opt-in to our free market trend signals 
before closing this page, so you don’t miss our next special report!

We believe the data related to the Covid-19 economic crisis will not fully be known until well into April or May 2020.  Because of this, we believe the US stock markets may recover to levels near the 50% Fibonacci Retracement levels on these charts before attempting a series of further downside price moves.  Skilled traders should not become overly emotional right now and pay attention to the structure of the price action as well as other technical conditions in play at the moment.  Our objective is to execute trades with a highly targets success rate – not to trade on emotions.

SPY Daily Chart

This SPY Daily chart shows the SPY would only need to rally 18.70 points to reach the 50% Fibonacci retracement level on this chart.  This could happen very quickly given how close the price actually is to this key Fibonacci level.  If that were to happen over the next 3 to 5+ trading days, the downward sloping price channels from our TTCharger modeling system would move lower to meet price near 278 – which would set up a new resistance zone and possibly a new wave of selling.

INDU Daily Chart

This INDU Daily chart shows the Dow Jones would have to rally about 2025 points (to levels near 23,886) to reach the 50% Fibonacci Retracement target.  If this were to happen, the sloping price channels on this chart would likely move lower to meet price near this 50% target level – presenting a very clear resistance zone for a new wave of selling to begin.

Remember, it is not about emotions or attempting to try to force the markets to adopt your “belief”.  Skilled traders attempt to identify risks, opportunities and realistic technical setups that allow them to objectively determine where and when the markets are providing a real opportunity for success.

We may be just a few days away from the next major wave of selling, yet any trader who jumped into an emotional trader over the past 5+ days expecting the markets to continue to break down is likely under a fair amount of stress right now.  Learn to read the charts and the structure of price more effectively and you’ll find the answers are already on the charts in front of you.

As a technical analysis and trader since 1997, I have been through a few bull/bear market cycles. I believe I have a good pulse on the market and timing key turning points for short-term swing traders.

If you are a more active trader and swing trader visit my Active ETF Trading Newsletter. If you are a long-term investor looking for signals when to own equities, bonds, or cash, be sure to look into my Long-Term Investing Signals.

Ride my coattails as I navigate these financial markets and build wealth while others lose nearly everything they own during the next financial crisis.

Chris Vermeulen
Chief Market Strategist
Founder of Technical Traders Ltd.
TheTechnicalTraders.com

Ichimoku Cloud Analysis 31.03.2020 (BTCUSD, XAUUSD, AUDUSD)

Article By RoboForex.com

BTCUSD, “Bitcoin vs US Dollar”

BTCUSD is trading at 6372.00; the instrument is moving inside Ichimoku Cloud, thus indicating a sideways tendency. The markets could indicate that the price may test the cloud’s upside border at 6555.00 and then resume moving downwards to reach 4365.00. Another signal to confirm further descending movement is the price’s rebounding from the rising channel’s downside border. However, the scenario that implies further decline may be canceled if the price breaks the cloud’s upside border and fixes above 6955.00. In this case, the pair may continue growing towards 7805.00. After breaking the support area and fixing below 5665.00, the price may resume moving downwards and finish a Head & Shoulders pattern.

BITCOIN
Risk Warning: the result of previous trading operations do not guarantee the same results in the future

XAUUSD, “Gold vs US Dollar”

XAUUSD is trading at 1615.00; the instrument is moving above Ichimoku Cloud, thus indicating an ascending tendency. The markets could indicate that the price may test Tenkan-Sen and Kijun-Sen at 1605.00 and then resume moving upwards to reach 1715.00. Another signal to confirm further ascending movement is the price’s rebounding from the downside border of a Triangle pattern. However, the scenario that implies further growth may be canceled if the price breaks the cloud’s downside border and fixes below 1525.00. In this case, the pair may continue falling towards 1495.00.

GOLD
Risk Warning: the result of previous trading operations do not guarantee the same results in the future

AUDUSD, “Australian Dollar vs US Dollar”

AUDUSD is trading at 0.6206; the instrument is moving above Ichimoku Cloud, thus indicating a bullish tendency. The markets could indicate that the price may test Tenkan-Sen and Kijun-Sen at 0.6135 and then resume moving upwards to reach 0.6545. Another signal to confirm further ascending movement is the price’s rebounding from the rising channel’s downside border. However, the scenario that implies further growth may be canceled if the price breaks the cloud’s downside border and fixes below 0.5805. In this case, the pair may continue falling towards 0.5720.

AUDUSD

Article By RoboForex.com

Attention!
Forecasts presented in this section only reflect the author’s private opinion and should not be considered as guidance for trading. RoboForex LP bears no responsibility for trading results based on trading recommendations described in these analytical reviews.

Japanese Candlesticks Analysis 31.03.2020 (EURUSD, USDJPY, EURGBP)

Article By RoboForex.com

EURUSD, “Euro vs. US Dollar”

As we can see in the H4 chart, after returning to the rising channel’s downside border, EURUSD has formed a Harami reversal pattern there. At the moment, the pair is reversing. We may assume that later the price may correct to reach 1.0930 and then resume the ascending tendency. In this case, the upside target may be at 1.1320.

EURUSD
Risk Warning: the result of previous trading operations do not guarantee the same results in the future

USDJPY, “US Dollar vs. Japanese Yen”

As we can see in the H4 chart, USDJPY is still recovering after the fall. Right now, the pair is testing the support level, where it has formed several reversal patterns, such as Harami and Hammer. Possibly, the price may reverse and reach 110.80. The current situation implies that the instrument may yet resume falling towards 105.72 but this scenario is rather unlikely.

USDJPY
Risk Warning: the result of previous trading operations do not guarantee the same results in the future

EURGBP, “Euro vs. Great Britain Pound”

As we can see in the H4 chart, after reaching the support level, EURGBP has formed a Hammer reversal pattern there. At the moment, the pair started reversing. We may assume that later the market may rebound towards 0.9300 and continue the descending tendency. However, one shouldn’t exclude an opposite scenario, which implies that the instrument may continue falling towards 0.9030 without any pullbacks. In this case, the target may be at 0.8745.

EURGBP

Article By RoboForex.com

Attention!
Forecasts presented in this section only reflect the author’s private opinion and should not be considered as guidance for trading. RoboForex LP bears no responsibility for trading results based on trading recommendations described in these analytical reviews.

The Analytical Overview of the Main Currency Pairs on 2020.03.31

by JustForex

The EUR/USD currency pair

Technical indicators of the currency pair:
  • Prev Open: 1.11161
  • Open: 1.10430
  • % chg. over the last day: -0.80
  • Day’s range: 1.09847 – 1.10527
  • 52 wk range: 1.0777 – 1.1494

The EUR / USD currency pair stabilized after a significant rally last week. Quotes are currently being consolidated. The local support and resistance levels are 1.09750 and 1.10550, respectively. Investors continue to evaluate the impact of the coronavirus pandemic on the global economy. In the near future, technical correction of the trading instrument is not ruled out. We expect important reports today.

The Economic News Feed for 31.03.2020:

  • – Labour Market Report (GER) – 10:55 (GMT+3:00);
  • – Consumer Price Index (EU) – 12:00 (GMT+3:00);
  • – Consumer Confidence Index (US) – 17:00 (GMT+3:00);
EUR/USD

Indicators do not give accurate signals: the price has fixed between 50 MA and 100 MA.

The MACD histogram has moved into the negative zone, which indicates a possible correction of the EUR/USD currency pair.

The Stochastic Oscillator is in the neutral zone, the %K line is below the %D line, which indicates a bearish sentiment.

Trading recommendations
  • Support levels: 1.09750, 1.08850, 1.08000
  • Resistance levels: 1.10550, 1.11450

If the price consolidates below 1.09750, expec the quotes to correct toward 1.09000.

Alternatively, they can rise toward 1.11200-1.11500.

The GBP/USD currency pair

Technical indicators of the currency pair:
  • Prev Open: 1.24262
  • Open: 1.23978
  • % chg. over the last day: -0.27
  • Day’s range: 1.22421 – 1.24051
  • 52 wk range: 1.1466 – 1.3516

An ambiguous technical picture has developed on the GBPUSD currency pair. Sterling is currently consolidating. GBP/USD quotes are testing a round level of 1.23000. The 1.24800 mark is a key resistance. Participants in financial markets expect additional drivers. In the near future, technical correction of the trading instrument is not ruled out. Open positions from key levels.

In the fourth quarter of 2019, UK GDP growth met market expectations and amounted to 1.1% (yoy).

GBP/USD

Indicators do not give accurate signals: the price crossed 50 MA.

The MACD histogram is near the 0 mark.

The Stochastic Oscillator is in the neutral zone, the %K line is below the %D line, which indicates a bearish sentiment.

Trading recommendations
  • Support levels: 1.23000, 1.21450, 1.20150
  • Resistance levels: 1.24800, 1.25500

If the price consolidates below the round level of 1.23000 expect a fall to 1.22000-1.21000.

Alternatively, the quotes could grow toward 1.25500-1.26000.

The USD/CAD currency pair

Technical indicators of the currency pair:
  • Prev Open: 1.40170
  • Open: 1.41624
  • % chg. over the last day: +0.87
  • Day’s range: 1.41496 – 1.42079
  • 52 wk range: 1.2949 – 1.4668

The USD / CAD currency pair has moved up. The trading tool has updated local highs. Pressure on CAD is caused by a significant collapse in the oil prices yesterday. At the moment, USD/CAD quotes are testing a round level of 1.42000. 1.41000 is already a mirror support. We do not exclude further growth of the USD/CAD currency pair. Open positions from key levels.

At 15:30 (GMT+3:00), Canada will release a GDP report.

USD/CAD

Indicators do not give accurate signals, the price fixed between 50 MA and 200 MA.

The MACD histogram is in the positive zone, which indicates an increase in the USD/CAD quotes.

The Stochastic Oscillator is in the neutral zone, the %K line crossed the %D line. There are no signals at the moment.

Trading recommendations
  • Support levels: 1.41000, 1.39900, 1.39250
  • Resistance levels: 1.42000, 1.42750, 1.43750

If the price consolidates above 1.42000, expect a rise to 1.42750-1.43500.

Alternatively, the quotes could descend toward 1.40500-1.39500.

The USD/JPY currency pair

Technical indicators of the currency pair:
  • Prev Open: 107.644
  • Open: 107.694
  • % chg. over the last day: +0.03
  • Day’s range: 107.692 – 108.714
  • 52 wk range: 101.19 – 112.41

USD/JPY quotes stabilized after a significant drop. At the moment, the trading instrument is in lateral movement. There is no defined trend. The local support and resistance levels are: 107.800 and 108.600, respectively. Demand for the currency of the safe haven is still at a high level. We do not exclude the further strengthening of the yen against the greenback. Open positions from key levels.

Positive reports on industrial production and retail sales in Japan were published during the Asian trading session.

USD/JPY

Indicators do not give accurate signals: the price has fixed between 50 MA and 100 MA.

The MACD histogram has moved into the positive zone, which indicates a possible correction of the USD/JPY currency pair.

The Stochastic Oscillator is in the neutral zone, the %K line crossed the %D line. There are no signals at the moment.

Trading recommendations
  • Support levels: 107.800, 107.150
  • Resistance levels: 108.600, 109.200, 110.000

If the price consolidates below 107.800, expect the quotes to drop toward 107.400-106.500.

Alternatively, the quotes could grow toward 109.000-109.500.

by JustForex