April 2nd, Limassol, Cyprus – RoboMarkets announces improvements of trading conditions offered to its clients – until the end of 2020, trading operations on accounts of ECN-Pro and Prime types will be available on the most comfortable conditions.
What changes have been introduced?
Spread values on ECN-Pro accounts are now similar to Prime ones. The leverage for ECN-Pro accounts has been increased up to 1:500. The maximum permissible leverage will be available only to Professional clients.
Trading conditions for premium accounts of a “Prime” type have also improved. The minimum deposited amount for these accounts is just 100 USD instead of 5,000 USD required earlier. The leverage value available to Professional clients has been increased up to 1:300.
“We’re holding to our course on the improvement of trading conditions. Standing in close relations with our clients, we analyze the statistics and implement new technologies in order to follow our priorities for compliance with the highest quality standards. This promotion will allow RoboMarkets clients to take their trading operations to a brand new efficiency level and trade on some of the most competitive trading conditions in the industry throughout the entire year.” – said Anton Ivanov, a marketing manager at RoboMarkets.
About RoboMarkets
RoboMarkets is an investment company with the CySEC license No. 191/13. RoboMarkets offers investment services in many European countries by providing traders, who work on financial market, with access to its proprietary trading platforms. More detailed information about the Company’s products and activities can be found on the official website at www.robomarkets.com.
– Thinking somewhat far off into the future, our researchers believe China/Asia could become the next Black Hole in the global economy. China recently released its March PMI number which came in at 52.0 – showing moderate expansion in Chinese manufacturing. The February Chinese PMI level was 35.7. We strongly believe China wants to show some strength in their perceived economic recovery and that these PMI numbers are somewhat “manufactured for effect”.
We believe the real economic toll taking place in China/Asia will continue to unfold over the next 3 to 6+ months as the historic expansion of wealth and the exported foreign investment from Wealthy Chinese continues to contract over this time. In a very similar manner to what happened in the US when the Japanese economy contracted in the 1990s – as wealth creation processes collapse, these foreign investors suddenly start to liquidate assets trying to protect their “home-country assets”.
We’ve recently posted an article suggesting the US Real Estate market could suddenly find itself in a real measurable collapse and we believe the foreign investors, speculators and speculative renters (Air BnB and others) will suddenly find themselves in a very difficult situation. You can find our Real Estate article here.
As the COVID-19 virus event continues to unfold, the data from global nations will quickly identify any outlier factors and data points related to China/Asia and how they are reporting their data. Chinese economic data has raised suspicions for quite some time with global analysts. It seems highly unlikely that the Chinese economy rebounded from an almost complete shutdown in February and most of March to a moderate manufacturing growth level at the end of March 2020. Meanwhile, throughout the rest of the globe, economies, and manufacturing levels are contracting as the COVID-19 shutdown continues.
We believe the disparity between the global markets and the numbers China continues to proffer will quickly result in a complete lack of confidence in future data related to any Chinese economic activity or future expectations. We also believe the global capital markets will make an immediate shift away from risks associated with any falsified data originating from China by mitigating forward risks in investments and currency market exposure over the next 3 to 5+ years – possibly longer.
Before you continue, be sure to opt-in to our free market trend signals before closing this page, so you don’t miss our next special report!
Source: Finviz.com
What happens when global events like the COVID-19 virus event takes place is that capital immediately attempts to identify extreme risks and attempt to move to safer environments. Currencies are no different. Global markets, investment, and manufacturing are increasingly exposed to risks related to the shifting markets and any false or otherwise “outlier” data being reported right now. The bigger players can’t afford to take risks and will take active measures to protect their futures and investments.
Our opinion is that the Chinese PMI level of 52 for March 2020 is an outlier data point. This virus event started in early January in China and almost all of February and March were when the globe suddenly became aware of the risks and infection spread. Even though China may have attempted to ramp up manufacturing over the past 2+ weeks to appear to be “back to normal” – it makes no sense to us that manufacturing in China actually “expanded”, based on historical levels, that quickly.
Watch how quickly global economies and currencies work to mitigate the risks related to perceived “outlier data”. We believe most of Asia will continue into an economic contraction over the next 3+ months and we believe the FOREX market will relate the immediate risk concerns related to Asia/China/global market expectations. In other words, watch the currencies to see how global investors perceive risks associated with true economic activity.
The World Bank many not have a deep enough piggy bank to back the extended risks of an Asian Economic contraction lasting 6+ months.
As a technical analysis and trader since 1997, I have been through a few bull/bear market cycles. I believe I have a good pulse on the market and timing key turning points for short-term swing traders.
I hope you found this informative, and if you would like to get a pre-market video every day before the opening bell, along with my trade alerts visit my Active ETF Trading Newsletter. If you are a long-term investor looking for signals when to own equities, bonds, or cash, be sure to look into my Long-Term Investing Signals.
Ride my coattails as I navigate these financial markets and build wealth while others lose nearly everything they own during the next financial crisis.
Since inadequate preparedness prevailed in Europe until recently, the consequent pandemic will cast a prolonged, dark shadow over the regionwide economy – starting with the contraction, followed by the debt crisis.
Around the world, the early economic defense against the economic impact of the novel coronavirus has been by the major central banks to cut down the rates, inject liquidity and re-start major asset purchases.
But as the post-2008 decade has shown, monetary responses cannot resolve fiscal challenges.
Bracing for the plunge
The early damage has focused on a set of key sectors, such as healthcare, transportation, retail, tourism, among others. So easy money will be coupled with targeted fiscal stimuli in affected economies. Yet, current measures to restrict the infection and economic damage will contribute to further debt erosion in major advanced and emerging economies.
Recently, the White House signed the $2 trillion coronavirus bill, the largest ever U.S. stimulus. It may not ensure adequate support for more than 4-6 months. To overcome the crisis, an extended period of 6-18 months may loom ahead when some kind of fiscal accommodation will be needed.
In the US, sovereign debt has increased record fast in the Trump era and now exceeds $23.5 trillion (107% of GDP); that is, before the virus stimulus bill or bills will cause it to soar. And so, we are back in the post-2008 territory that was never supposed to recur. But now, after a decade of ultra-low rates, rounds of quantitative easing and liquidity injections, the situation is much worse.
In the Eurozone, recessionary pressures come in a particularly bad time. Before the virus, the annual economic growth was about 1.0% in the fourth quarter of 2019, signaling the weakest expansion in seven years. However, the first quarter could contract to -3.0%, while the second could be worse than in 2008-9.
In both the United States and the Eurozone/UK, the first quarter damage will only be the prelude to the second quarter carnage. And if the virus is not managed appropriately, the consequent hit will cast a shadow over the hoped-for rebound in the second half of 2020 as well, possibly into 2021.
In Europe, the Maastricht Treaty deems that member states should not have excessive government debt (60%+ of GDP). Today, no major European economy fulfills that criteria. To overcome their short-term challenges, countries will take more debt, which will further erode their debt-to-GDP ratios.
Certainly, central banks in Europe and the UK will follow US footprints into more monetary and fiscal accommodation. But that may fail to quell virus fears, if infection rates continue to soar. As virus mobilization intensifies in European economies, so will new debt-taking.
Even before the virus crisis, Italy’s level of sovereign debt soared from 110% as share of the GDP to the alarming 135% in the course of the 2010s. It will increase a lot faster now. In Spain, the debt crisis of the past decade pushed the ratio from just 60% to a peak of 100% of GDP in 2014. In the past half a decade, it has decreased but that progress will now be reversed.
In France, the ratio climbed from 85% to close to 100% in 2016 but has stayed at that level since then. Those days are now over as the ratio will start climbing. In the UK, sovereign debt was close to 60% in 2010, but soared to close to 85% in 2017, thanks to the impending Brexit. Now the UK will have to face the costs of the Brexit and the virus crisis.
Germany is the only major European economy in which sovereign debt as share of the GDP actually declined in the past decade from 80% to close to 60%. In the past two years, Berlin has been able to offset the US tariff war losses, but now it will have to cope with worse challenges. And when German economy contracts, the rest of Europe will plunge.
The way out
In advanced economies – and particularly in the heavily-indebted European countries, which are already struggling to absorb the costs of the 2008 great recession, the 2010 EU debt crisis, the UK Brexit, and the US tariff wars – the coronavirus contraction has potential to wipe out a decade of recovery. But that’s just a prelude.
Furthermore, if containment measures fail, or subsequent mitigation proves inadequate, or new virus clusters emerge after containment and mitigation, markets will remain volatile and economies will suffer further damage, particularly if multiple waves of secondary infections recur after current restrictive measures.
What is desperately needed is multipolar cooperation among major economies and across political differences. In this quest, China, where containment measures have been successful, can show the way, along with major advanced and emerging powers.
President Xi Jinping’s call on Trump to improve US-China relations amid Covid-19 crisis and cooperate against the virus is a good start.
But isn’t it time for Europe to join the bandwagon?
About the Author:
Dr. Dan Steinbock is an internationally recognized strategist of the multipolar world and the founder of Difference Group. He has served at the India, China and America Institute (USA), Shanghai Institutes for International Studies (China) and the EU Center (Singapore). For more, see https://www.differencegroup.netFor recent coronavirus briefings, seehttps://www.differencegroup.net/coronavirus-briefs
This is the second part of the commentary that the European Financial Review released online on March 30, 2020 online and will publish in its April/May print edition.
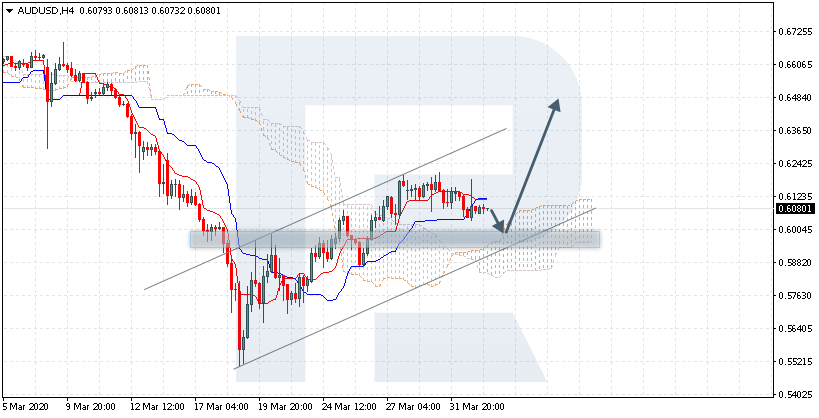
AUDUSD is trading at 0.6080; the instrument is moving above Ichimoku Cloud, thus indicating a bullish tendency. The markets could indicate that the price may test the cloud’s upside border at 0.6005 and then resume moving upwards to reach 0.6485. Another signal to confirm further ascending movement is the price’s rebounding from the rising channel’s downside border. However, the scenario that implies further growth may be canceled if the price breaks the cloud’s downside border and fixes below 0.5760. In this case, the pair may continue falling towards 0.5680.
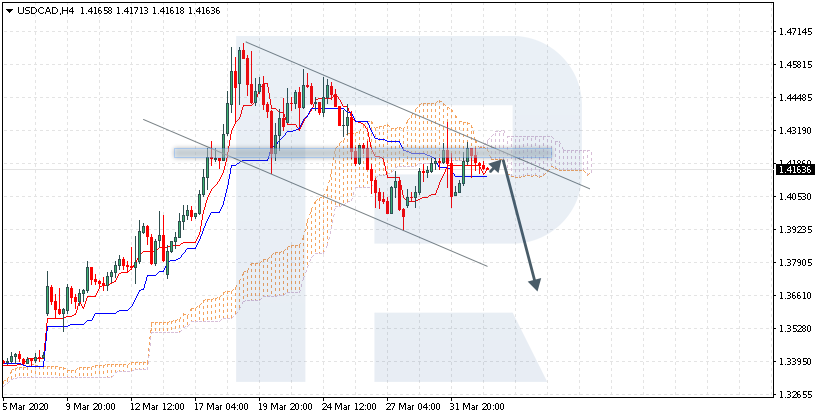
USDCAD, “US Dollar vs Canadian Dollar”
USDCAD is trading at 1.4163; the instrument is moving below Ichimoku Cloud, thus indicating a bearish tendency. The markets could indicate that the price may test the cloud’s downside border at 1.4175 and then resume moving downwards to reach 1.3665. Another signal to confirm further descending movement is the price’s rebounding from the descending channel’s upside border. However, the scenario that implies further decline may be canceled if the price breaks the cloud’s upside border and fixes above 1.4335. In this case, the pair may continue growing towards 1.4450.
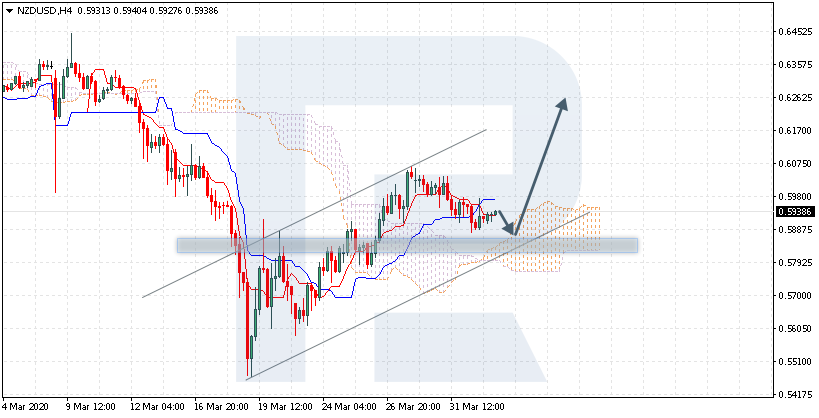
NZDUSD, “New Zealand Dollar vs US Dollar”
NZDUSD is trading at 0.5938; the instrument is moving above Ichimoku Cloud, thus indicating an ascending tendency. The markets could indicate that the price may test the cloud’s upside border at 0.5885 and then resume moving upwards to reach 0.6265. Another signal to confirm further ascending movement is the price’s rebounding from the rising channel’s downside border. However, the scenario that implies further growth may be canceled if the price breaks the cloud’s downside border and fixes below 0.5695. In this case, the pair may continue falling towards 0.5605.
Attention! Forecasts presented in this section only reflect the author’s private opinion and should not be considered as guidance for trading. RoboForex LP bears no responsibility for trading results based on trading recommendations described in these analytical reviews.
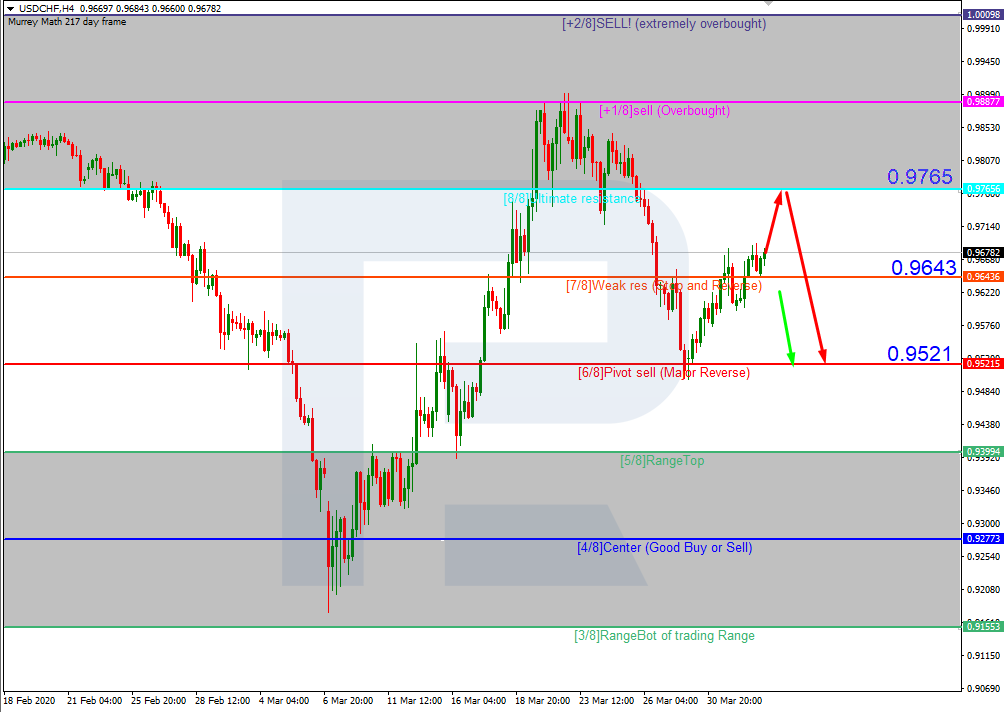
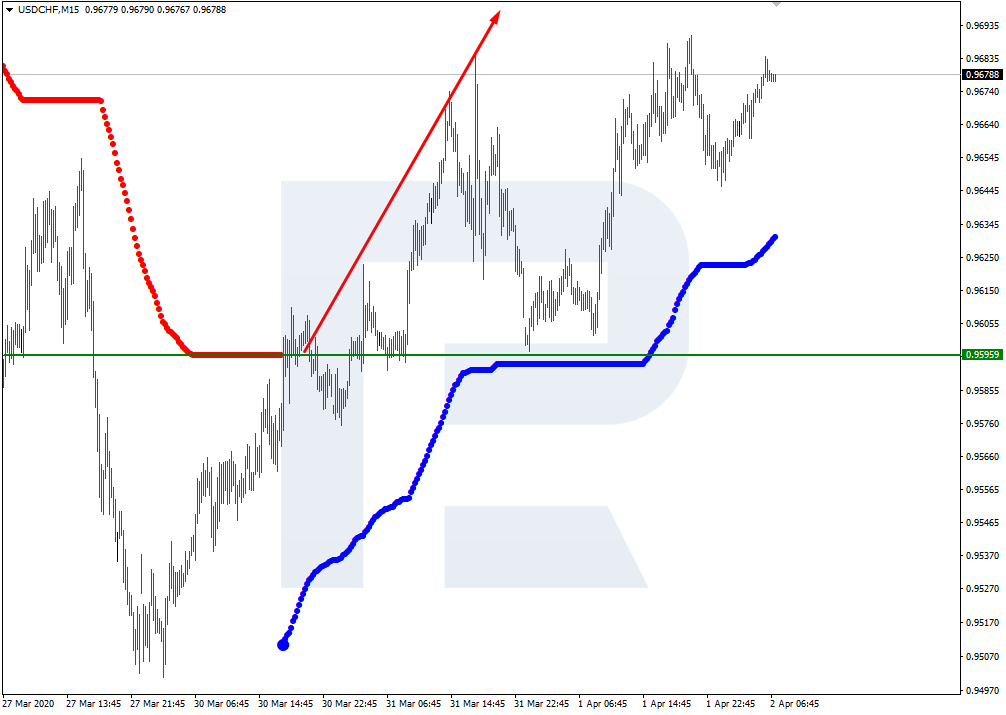
In the H4 chart, USDCHF is trading above 7/8. In this case, the price is expected to continue growing towards the resistance at 8/8. However, this scenario may no longer be valid if the price breaks 7/8 to the downside. After that, the instrument may continue falling to reach the support at 6/8.
As we can see in the M15 chart, the pair has broken the upside line of the VoltyChannel indicator and, as a result, may continue the ascending tendency towards 8/8 from the H4 chart.
XAUUSD, “Gold vs US Dollar”
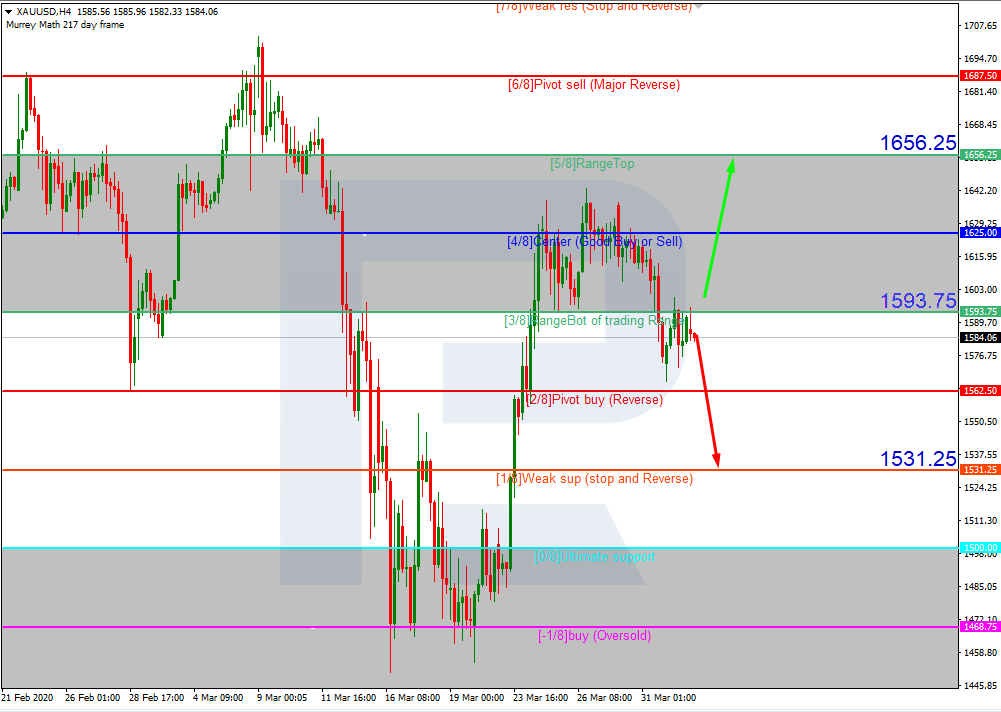
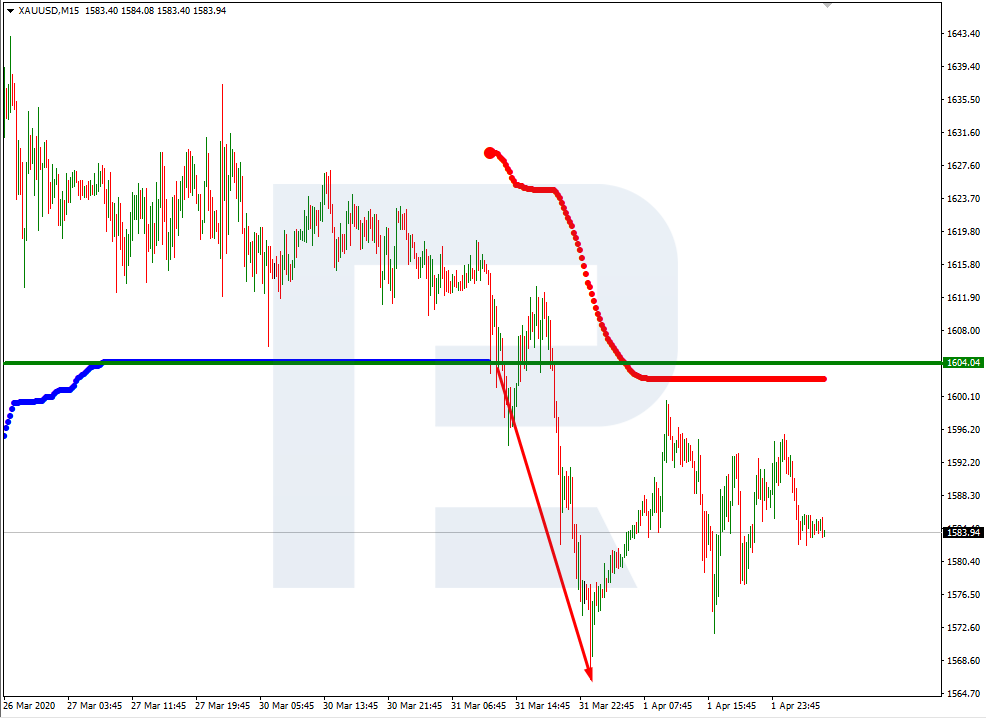
In the H4 chart, XAUUSD is trading below 3/8. In this case, the price is expected to continue falling to reach the support at 1/8. However, this scenario may no longer be valid if the price breaks 3/8 to the upside. After that, the instrument may continue growing towards the resistance at 5/8.
As we can see in the M15 chart, the pair has broken the downside line of the VoltyChannel indicator and, as a result, may continue trading downwards to reach 1/8 from the H4 chart.
Attention! Forecasts presented in this section only reflect the author’s private opinion and should not be considered as guidance for trading. RoboForex LP bears no responsibility for trading results based on trading recommendations described in these analytical reviews.
During yesterday’s trading session, the US dollar started to grow against a basket of major currencies. The dollar index (#DX) closed in the green zone (+0.67%). At the moment, currency majors are consolidating. Investors began trading currencies, which are considered more reliable. The COVID-19 epidemic continues to impact the global economy negatively. Earlier this week, US President Donald Trump announced that the United States would have to endure “painful two weeks” in the fight against COVID-19 before the trend tends to improve. Today, the number of coronavirus cases in the United States is 216,722. In total, there are already 939,436 cases in the world.
Today, investors expect a report on initial jobless claims in the United States. Experts expect that the number of Americans applying for jobless claims is likely to hit a record high for the second week in a row, as more and more states announce quarantine and insist residents stay at home. All these measures are aimed at containing the coronavirus pandemic, which, according to economists, has already pushed the world economy into recession.
The “black gold” prices have started recovering. At the moment, futures for the WTI crude oil are testing the $22.25 mark per barrel.
Market indicators
Yesterday, there were aggressive sales in the US stock market: #SPY (-4.50%), #DIA (-4.49%), #QQQ (-4.25%).
The 10-year US government bonds yield fell again. At the moment, the indicator is at the level of 0.60-0.61%.
The news feed on 2020.04.02:
– Initial jobless claims in the US at 15:30 (GMT+3:00).
Sales prevail on the EUR/USD currency pair. Quotes have updated local lows. The COVID-19 pandemic continues to impact the global economy negatively. Donald Trump announced the upcoming “painful” two-week fight against coronavirus. At the moment, EUR/USD quotes are consolidating in the range of 1.08900-1.09700. We recommend opening positions from these marks.
The Economic News Feed for 02.04.2020:
At 15:30 (GMT+3:00), data on initial jobless claims will be published in the US.
Indicators do not give accurate signals: the price has fixed between 50 MA and 100 MA.
The MACD histogram is in the negative zone, but above the signal line, which gives a weak signal to sell EUR/USD.
Stochastic Oscillator is in the neutral zone, the %K line has crossed the %D line. There are no signals at the moment.
Trading recommendations
Support levels: 1.08900, 1.08000
Resistance levels: 1.09700, 1.10400, 1.11400
If the price fixes below 1.08900, the EUR/USD currency pair is expected to fall. The movement is tending to the round level of 1.08000.
An alternative could be the growth of EUR/USD quotes to 1.10300-1.10800.
The GBP/USD currency pair
Technical indicators of the currency pair:
Prev Open: 1.24140
Open: 1.23771
% chg. over the last day: -0.33
Day’s range: 1.23664 – 1.24318
52 wk range: 1.1466 – 1.3516
The British pound is still being traded in a prolonged flat. There is no defined trend. Since the beginning of this week, the following key support and resistance levels have been formed: 1.23000 and 1.24800, respectively. Financial market participants expect additional drivers. Today, investors will assess important statistics from the UK and the US. Positions should be opened from key levels.
At 11:30 (GMT+3:00), UK construction PMI will be published.
Indicators do not give accurate signals: the price has crossed 50 MA.
The MACD histogram is near the 0 mark.
Stochastic Oscillator is in the neutral zone, the %K line has started crossing the %D line. There are no signals at the moment.
Trading recommendations
Support levels: 1.23000, 1.21450, 1.20150
Resistance levels: 1.24800, 1.25500
If the price fixes below the round level of 1.23000, GBP/USD quotes is expected to fall. The movement is tending to 1.22000-1.21000.
An alternative could be the growth of the GBP/USD currency pair to 1.25500-1.26000.
The USD/CAD currency pair
Technical indicators of the currency pair:
Prev Open: 1.40648
Open: 1.41923
% chg. over the last day: +0.91
Day’s range: 1.40787 – 1.41964
52 wk range: 1.2949 – 1.4668
There is an ambiguous technical pattern on the USD/CAD currency pair. A trading instrument is in a sideways trend with a fairly wide range. At the moment, the local support and resistance levels are 1.40800 and 1.42000, respectively. The recovery of the “black gold” prices support the loonie. USD/CAD quotes are tending to decline. Positions should be opened from key levels.
The news feed on Canada’s economy is calm.
Indicators signal the power of sellers: the price has fixed below 50 MA and 100 MA.
The MACD histogram has moved into the negative zone, which indicates the development of bearish sentiment.
Stochastic Oscillator is in the neutral zone, the %K line is below the %D line, which gives a signal to sell USD/CAD.
Trading recommendations
Support levels: 1.40800, 1.40100, 1.39250
Resistance levels: 1.42000, 1.42700, 1.43350
If the price fixes below 1.40800, USD/CAD quotes are expected to fall. The movement is tending to 1.40100-1.39500.
An alternative could be the growth of the USD/CAD currency pair to 1.42500-1.43000.
The USD/JPY currency pair
Technical indicators of the currency pair:
Prev Open: 107.498
Open: 107.154
% chg. over the last day: -0.35
Day’s range: 107.040 – 107.568
52 wk range: 101.19 – 112.41
USD/JPY quotes continue to consolidate. There is no defined trend. At the moment, the local support and resistance levels are 107.000 and 107.650, respectively. Demand for the “safe haven” currencies is still high. The USD/JPY currency pair has the potential for further decline. We recommend paying attention to the dynamics of the US government bonds yield. Positions should be opened from key levels.
The news feed on Japan’s economy is calm.
Indicators do not give accurate signals: the price is consolidating near 50 MA.
The MACD histogram is near the 0 mark.
Stochastic Oscillator is in the neutral zone, the %K line is below the %D line, which indicates the bearish sentiment.
Trading recommendations
Support levels: 107.000, 106.500
Resistance levels: 107.650, 108.250, 108.700
If the price fixes below 107.000, a further drop in the USD/JPY quotes is expected. The movement is tending to 106.500-106.200.
An alternative could be the growth of the USD/JPY currency pair to 108.000-108.500.
On Wednesday the 1st of April, trading on the euro closed down, with the EURUSD pair sliding to 1.0903. Pressure was piled on the euro in the US session during President Trump’s press conference. He warned of a tough couple of weeks ahead. Investors are nervous over the serious toll that COVID-19 has taken on the global economy. Manufacturing production has slowed down, and economies around the world are expecting a drop in GDP.
We correctly predicted yesterday’s trajectory. The bears went on the offensive in the European session, bringing the rate down to 1.0903. From there, the pair began a recovery towards the balance line.
The pair is currently trading at 1.0935. Today’s central focus will be the US report on initial jobless claims, where around 3.5 million new people are expected to have made claims for unemployment benefits. Markets have already factored in this pessimistic prediction. If the actual figure turns out to be closer to 5 million, we can expect to see a sharp decline on the US dollar across the board. It’s difficult to say with any certainty what the actual figure will be, so there’s a lot of uncertainty surrounding the market at the moment. This isn’t helped by the fact that the NFP report comes out tomorrow.
Let’s see if we can find a link between the technicals and fundamentals. Since we didn’t see a sharp rebound from 1.0930, we may see some cleaning take place, which could then take us up to 1.1040. This would be the ideal scenario for today. There may not be any fresh lows, and we may even get a double bottom model. It would be better for the bulls to see three lower lows, which would provide more growth potential. However, if 1.0883 doesn’t hold up, the bears will power through to 1.0815.
– Today, the number of confirmed cases in Europe is more than four times as high as in China. It wasn’t an inevitable scenario. It is the result of complacency, inadequate preparedness and missed opportunities.
Today, the epicenter of the novel coronavirus outbreaks is in the United States and Europe. In effect, more than half of all cases worldwide are in Europe.
Furthermore, Europe has over four times more cases than China.
How did this happen? How could it happen?
The first missed opportunity
At the end of January, the World Health Organization (WHO) declared the ongoing virus outbreak a “public health emergency of international concern.” The WHO was concerned about the possible effects of the virus, if it would spread to countries with weaker healthcare systems.
On February 4, WHO chief Dr. Tedros dropped a news bomb by stating publicly that it was the countries outside China that had been slow in sharing information about cases. After a month of international crisis and a global alert, a stunning three of five member countries had failed to provide adequate case information to WHO. Those reports were vital to assess the international scope of the outbreak and to contain it.
Instead of mobilization, major European economies followed the virus crisis as if it was a “Chinese problem.”
The complacency was compounded by the concurrent media coverage, which was often sensational and misguided contributing to the “infodemic.” Still worse, instead of preparing against the virus, public debate began an odd battle against the WHO, its chief and some of his right-hand executives thereby compounding the inadequate preparedness (see my “The Strange War with WHO’s Battle Against COVID-19”, The World Financial Review, Feb 14, 2020).
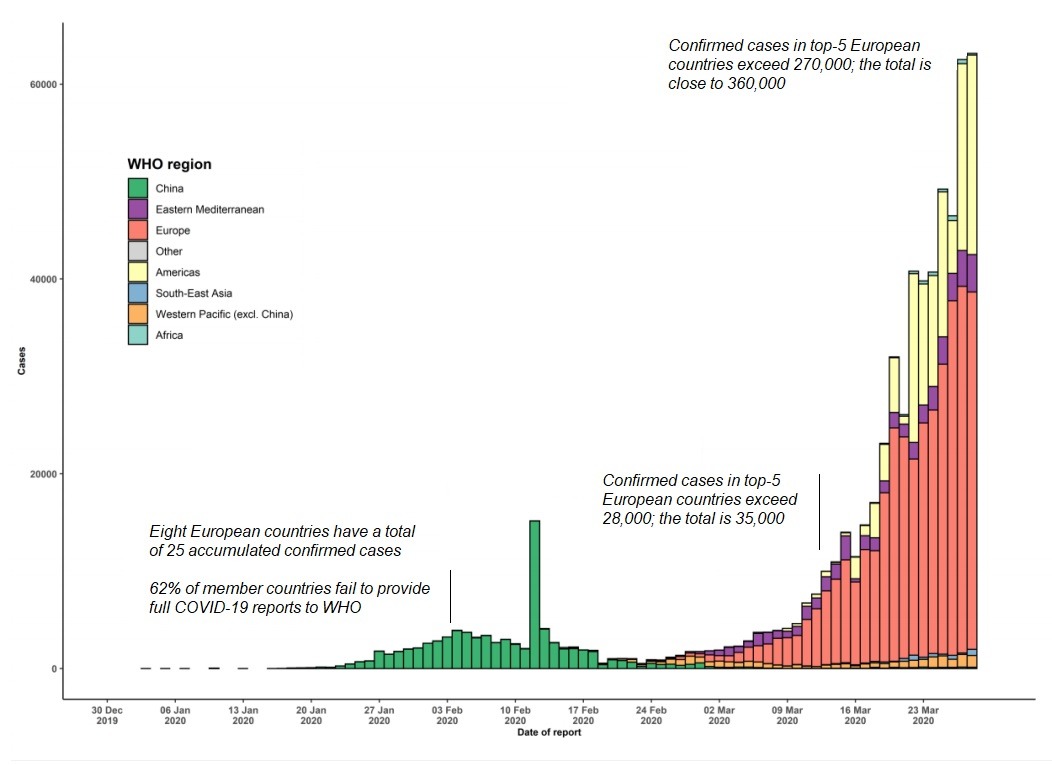
As the timeline suggests, it was this missed first month that led to the confirmed cases soaring outside China after February 4 (Figure).
Figure The Human Costs of Europe’s Coronavirus Complacency*
* Confirmed COVID-19 cases worldwide through March 29 2020
Source: WHO, Difference Group.
Yet, the writing was on the wall. In China, a “mystery pneumonia” of unknown etiology was first identified in Wuhan by the end of December. At the onset of January, the WHO had been informed about the new virus. And by January 10, scientists in China sequenced the virus’s genome and made it available. With SARS this work had taken months; now only a month.
After mid-January, Beijing initiated the draconian measures to contain the virus and the story was all over in international headlines.
In the United States, the first coronavirus case was identified on January 20. In Europe, the first cases were detected just days later, on January 24, in Bordeaux and Paris, along with a cluster of infections that was discovered in Haute-Savoie. In Germany, the first case was confirmed on January 27; in Italy, four days later; in Spain and the UK, on January 31.
And yet, thereafter, weeks of mobilization were missed as major European countries hoped for the best but didn’t prepare for the worst. That odd state of waiting prevailed until a dramatic escalation ensued in Italy on February 21, when a cluster of cases was confirmed cases in Lombardy, followed by another acceleration in Spain just three days later.
That’s how Inadequate preparedness ensured the virus a free ride, which resulted in an explosion of local transmissions in late February. By then, Italy had few alternatives but to adopt the Chinese strategy of shutting down cities and banning social activities, strictly isolating infected people. Only weeks before, many European leaders had criticized such measures as “autocratic” and “counter-productive.” Now they rushed to adopt them.
At the turn of April, confirmed cases worldwide exceeded 650,000, while those in Italy were approaching 100,000; in Spain, 75,000; Germany, 55,000; France, 40,000; and the UK 20,000. Combined, these five European countries alone had more than twice as many cases as the U.S.
Here’s the inconvenient truth about the first missed opportunity: When Dr Tedros delivered his news bomb on February 4, there were only 25 confirmed cases in Europe. When serious mobilization began around mid-March, the number of those cases had exploded more than 1000-fold to 28,000 in the five major European economies, while the total had soared to about 35,000. Today, at the start of April, those cases have increased 10-fold in major European economies and the region as a whole – in the former case, to 270,000 and in the latter, to some 360,000.
Worse, another missed opportunity may loom ahead.
Toward a second missed opportunity?
As mobilization began belatedly, some European leaders tried to frame inadequate preparedness as a foresighted strategy. In the UK, Prime Minister Boris Johnson stated that “we can turn the tide within the next 12 weeks.” In mid-March, he added that schools would stay open. He advised people with symptoms to stay at home for a week and advised seniors over the age of 70 to avoid certain activities.
Relying on the advice of some epidemiologists, Johnson began to advocate “herd immunity” as the new strategy. Basically, the idea is that, within a certain group of people, the circulation of diseases can be stopped after enough are infected and gain immunity. If, say, two thirds of people in a group have immunity, the number of people a sick person can infect will plunge below one. And that will bring the disease under control.
The idea is presented as a “realistic” solution. Since tight control and isolation strategies may not work anymore, the virus is already spread all around the world.
It is not a new idea, however. It was first deployed in the 1920s and recognized as a recurring phenomenon in the 1930s when, after a significant number of children had become immune to measles, new infections temporarily decreased. Subsequently, mass vaccination to induce herd immunity became common.
Unfortunately, in the coronavirus crisis, the idea of the herd immunity may imply the kind of medication that has potential to worsen the crisis. After all, there is no vaccine yet and it may take a year or longer to develop. So, if resignation is disguised as a strategy, it is likely to condemn major risk groups – the elderly, those with chronic pulmonary conditions, hypertension, diabetes and asthma patients, and those without adequate access to affordable health care – into a premature death.
Worse, whatever happens in Europe will not stay in region. In a global, inter-connected economy, all countries are linked. And with pandemics, the weakest links determine the future of the whole, through flows of world trade, investment and particularly migration and tourism.
If major European countries opt for the herd immunity scenario, it would be naïve to expect the virus to disappear by early summer (that’s the current expectation). It could easily last into the fall and well into 2021. As a result, human costs would soar, while economic devastation would spread deeper and broader.
In that scenario, herd immunity would signal a second missed opportunity.
About the Author:
Dr. Dan Steinbock is an internationally recognized strategist of the multipolar world and the founder of Difference Group. He has served at the India, China and America Institute (USA), Shanghai Institutes for International Studies (China) and the EU Center (Singapore). For more, see https://www.differencegroup.netFor recent coronavirus briefings, seehttps://www.differencegroup.net/coronavirus-briefs
This is the first part of the commentary that was released by The European Financial Review on March 31, 2020
– As the world reacts to the global economic slowdown because of the COVID-19 virus event and the massive stimulus programs and central bank efforts to support the global economy, investors still expect weakness in the US and foreign markets. We believe this expected weakness will not subside until news of a proper resolution to this virus event is rooted in the minds of investors and global markets.
Hong Kong and China are currently concerned about experiencing a “third wave” of the COVID-19 virus within their society. As the economies open back up to somewhat normal, people are very concerned that a renewed wave of new infections will suddenly appear and potentially result in another shut-down event or infectious cycle? We believe all nations are watching what is happening in Hong Kong and China as they attempt to reopen their economies.
The rest of the world is still battling the rising infection rates and dealing with the economic shutdowns that have brought the global economy to its knees. Europe, Japan, Canada, and the US are all experiencing vast disruptions to their economies and commodity prices and demand expectations are collapsing as a result.
Nearly a week ago, we issued a research article that suggested our proprietary Fibonacci Price Modeling tool’s key resistance levels may become a very valid ceiling for any price recovery. It appears this is happening in the markets as the NQ Daily chart, below, shows.
Before you continue, be sure to opt-in to our free market trend signals before closing this page, so you don’t miss our next special report!
Daily Nasdaq (NQ) Chart
The NQ resistance level, near 7880, has acted as a soft ceiling in the NQ over the past 4+ trading days. Today, the NQ briefly rallied above this level, then rotated downward below this level again to confirm this key resistance level. We believe this critical Fibonacci resistance level may continue to act as a price ceiling over the next few trading days and push prices lower as economic news and expectations hit the news this week and next.
The next downside price target for the NQ is 6565 – new price lows.
This ES Weekly chart illustrates another key resistance level near 2679. Although the ES price has not rallied up to reach this critical Fibonacci resistance level, we still believe this level is acting as a price ceiling and that the ES will weaken as future expectations are confirmed by earnings data, economic data and other collateral damage to the global economy.
We are still very early in understanding the total scope of this virus event. The US and other global central banks are attempting to front-run any weakened expectations as a result of this virus event. We continue to believe the extended collateral damage to the consumer, business and other aspects of the economy are yet to come. Most recently, consumer delinquencies have begun to skyrocket and the news is being printed about landlords and renters being unable to satisfy obligations on April 1st.
This is part of the reason why we believe further caution is warranted at this time in the markets. We issued an Important Trade and Investment Alert Yesterday.
Our research team believes a deeper price low will likely set up over the next 30+ days to establish a true price bottom. As we’ve warned, we believe extended collateral damage to the US and global economy will soon become better understood and the extended shutdown of the US and other economies only manages to complicate any positive expectations for a bottom.
We believe a deeper price low will set up within the next 30+ days and we urge skilled traders to pay attention to the broader expectations of the markets. Earnings data and other economic data will continue to stream into the news centers over the next 30+ days. Don’t get too aggressive with trying to buy a bottom in the markets just yet. Be patient and wait for the markets to show you when the bottom has really setup.
As a technical analysis and trader since 1997, I have been through a few bull/bear market cycles. I believe I have a good pulse on the market and timing key turning points for short-term swing traders.
I hope you found this informative, and if you would like to get a pre-market video every day before the opening bell, along with my trade alerts visit my Active ETF Trading Newsletter. If you are a long-term investor looking for signals when to own equities, bonds, or cash, be sure to look into my Long-Term Investing Signals.
Ride my coattails as I navigate these financial markets and build wealth while others lose nearly everything they own during the next financial crisis.