Author Archive for InvestMacro – Page 63

DAX30 less volatile over the last few days – the calm before the bears?

By Admiral Markets

Economic Events

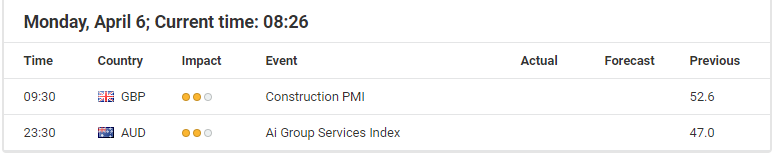
Source: Economic Events April 6, 2020 – Admiral Markets’ Forex Calendar

While the economic calendar is very thin for the start of the week, the picture for the DAX30 CFD nevertheless stays very interesting, and has the potential to see strong moves in either direction.

While we consider the DAX30 CFD to be technically neutral between 9,150/200 and 10,150 points on an hourly time-frame, we still favour a break out of the range on the downside, considering the recent correction into the end of March towards a bear market rally.

In fact, the main driver for the upwards run in Equities (especially US Equities) for the end of the first quarter could be a necessary rebalancing of portfolios by money managers, who need to step up their Equity exposure and selling of bonds in order to maintain their allocation targets.

The resulting “problem” is obvious: after this “rebalancing” demand diminishes, and with the latest bad numbers from the labour market showing that the number of Americans filing for unemployment benefits jumped to 6.6 million in the week of March 28, the failure to recapture the mark of 10,000 points last week clearly points to bears being still in control of the price action and the advantage remaining clearly on the short side.

In the short-term, the main focus stays on the region around 9,150/200 points. If we get to see a sustainable drop below that level, a re-test of the region around 8,000 points, probably a drop even lower stays a serious option in the days to come.

On the other hand: above 9,150/200 points a push back towards and even above 10,000 points respectively 10,150 points stays on the table:

Hourly chart

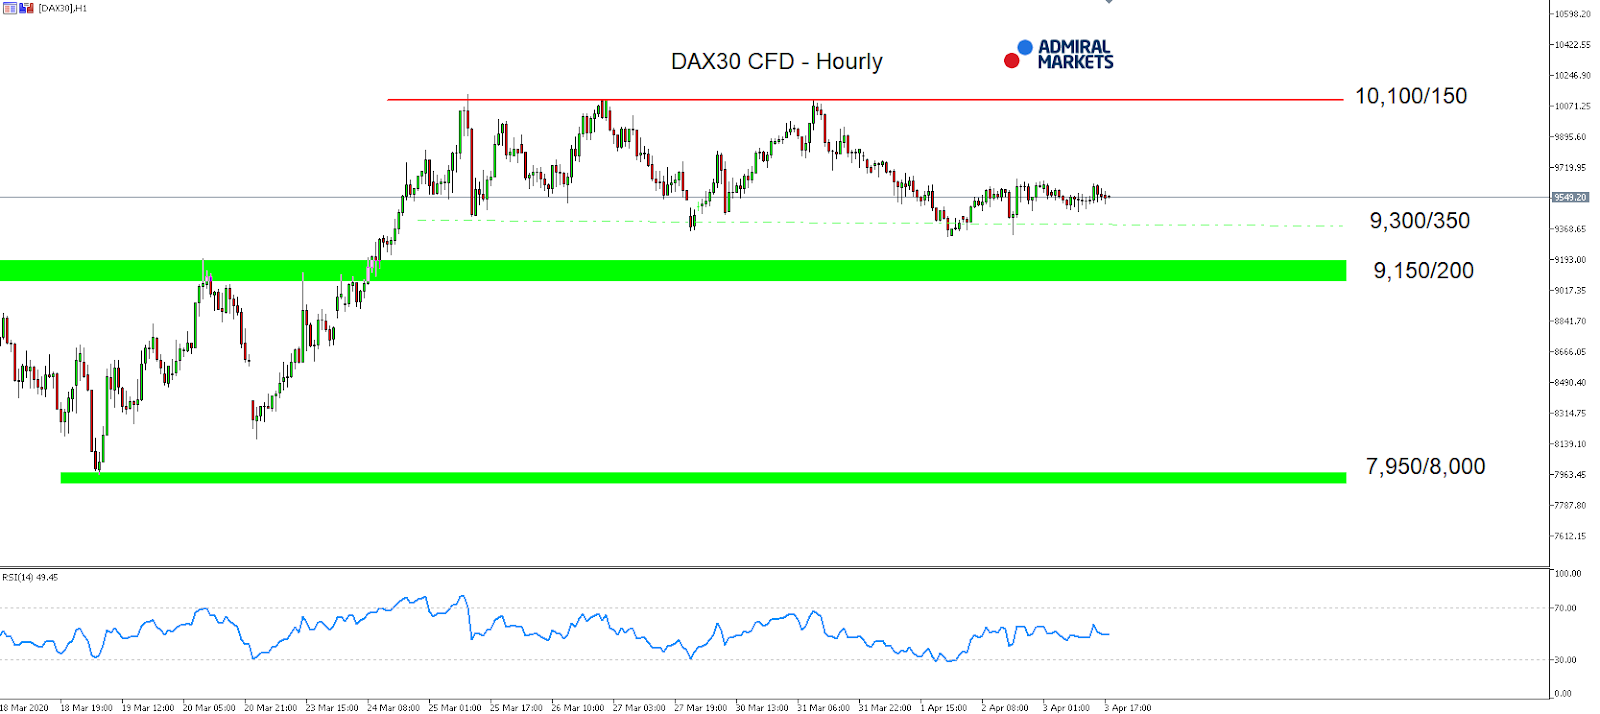
Source: Admiral Markets MT5 with MT5-SE Add-on DAX30 CFD Hourly chart (between March 17, 2020, to April 3, 2020). Accessed: April 3, 2020, at 10:00 PM GMT

Daily chart

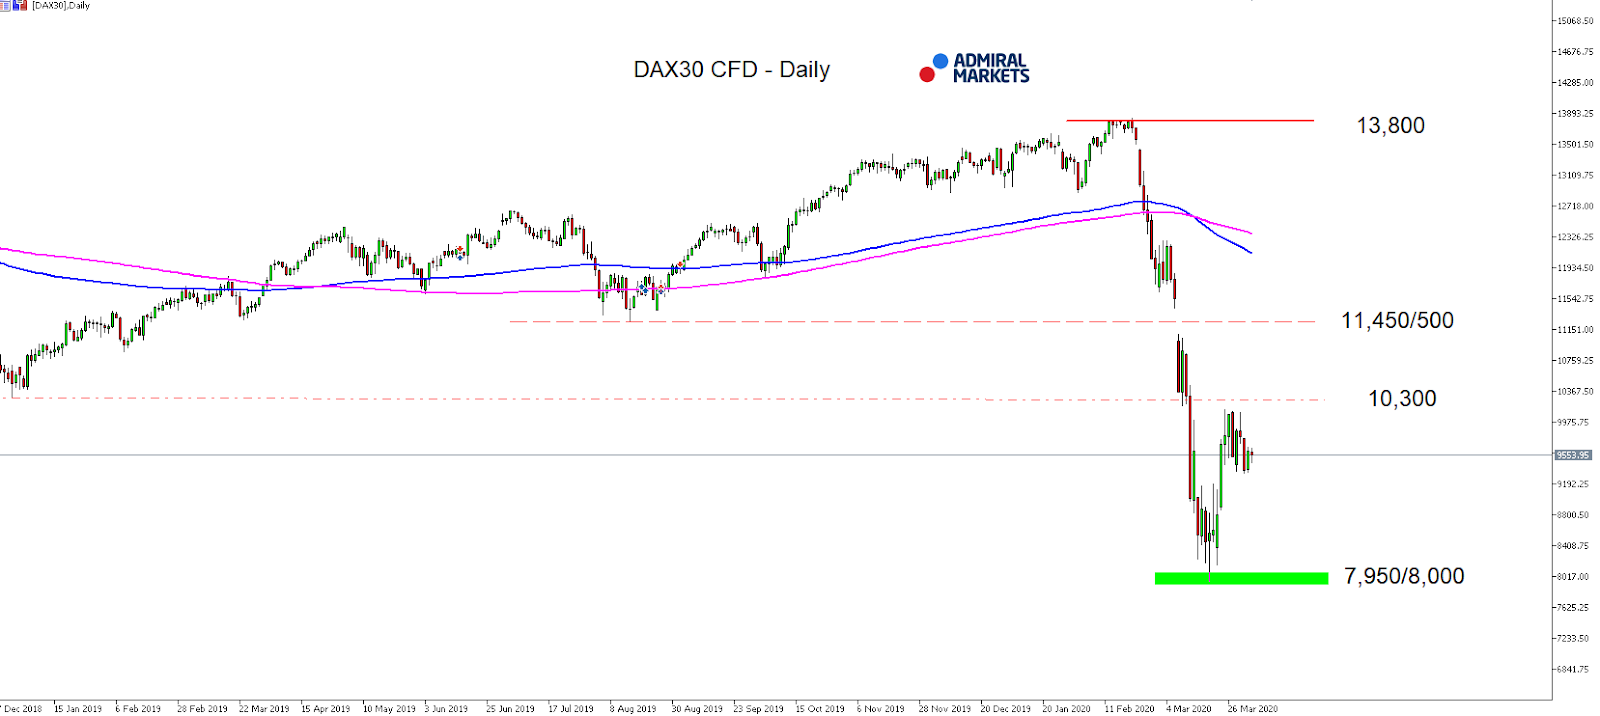
Source: Admiral Markets MT5 with MT5-SE Add-on DAX30 CFD Daily chart (between December 17, 2018, to April 3, 2020). Accessed: April 3, 2020, at 10:00pm GMT – Please note: Past performance is not a reliable indicator of future results, or future performance.

In 2015, the value of the DAX30 CFD increased by 9.56%, in 2016, it increased by 6.87%, in 2017, it increased by 12.51%, in 2018, it fell by 18.26%, in 2019, it increased by 26.44% meaning that after five years, it was up by 34.2%.

Discover the world’s #1 multi-asset platform

Admiral Markets offers professional traders the ability to trade with a custom, upgraded version of MetaTrader 5, allowing you to experience trading at a significantly higher, more rewarding level. Experience benefits such as the addition of the Market Heat Map, so you can compare various currency pairs to see which ones might be lucrative investments, access real-time trading data, and so much more. Click the banner below to start your FREE download of MT5 Supreme Edition!

Download MetaTrader 5 and begin trading today!

Disclaimer: The given data provides additional information regarding all analysis, estimates, prognosis, forecasts or other similar assessments or information (hereinafter “Analysis”) published on the website of Admiral Markets. Before making any investment decisions please pay close attention to the following:

  1. This is a marketing communication. The analysis is published for informative purposes only and are in no way to be construed as investment advice or recommendation. It has not been prepared in accordance with legal requirements designed to promote the independence of investment research, and that it is not subject to any prohibition on dealing ahead of the dissemination of investment research.
  2. Any investment decision is made by each client alone whereas Admiral Markets shall not be responsible for any loss or damage arising from any such decision, whether or not based on the Analysis.
  3. Each of the Analysis is prepared by an independent analyst (Jens Klatt, Professional Trader and Analyst, hereinafter “Author”) based on the Author’s personal estimations.
  4. To ensure that the interests of the clients would be protected and objectivity of the Analysis would not be damaged Admiral Markets has established relevant internal procedures for prevention and management of conflicts of interest.
  5. Whilst every reasonable effort is taken to ensure that all sources of the Analysis are reliable and that all information is presented, as much as possible, in an understandable, timely, precise and complete manner, Admiral Markets does not guarantee the accuracy or completeness of any information contained within the Analysis. The presented figures refer that refer to any past performance is not a reliable indicator of future results.
  6. The contents of the Analysis should not be construed as an express or implied promise, guarantee or implication by Admiral Markets that the client shall profit from the strategies therein or that losses in connection therewith may or shall be limited.
  7. Any kind of previous or modeled performance of financial instruments indicated within the Publication should not be construed as an express or implied promise, guarantee or implication by Admiral Markets for any future performance. The value of the financial instrument may both increase and decrease and the preservation of the asset value is not guaranteed.
  8. The projections included in the Analysis may be subject to additional fees, taxes or other charges, depending on the subject of the Publication. The price list applicable to the services provided by Admiral Markets is publicly available from the website of Admiral Markets.
  9. Leveraged products (including contracts for difference) are speculative in nature and may result in losses or profit. Before you start trading, you should make sure that you understand all the risks.

By Admiral Markets

Futures rise as US administration signals coronavirus outbreak may be stabilizing

By IFCMarkets.com

US stocks fell after worse than feared March jobs report

US stock market pulled back on Friday after dismal March jobs report. The S&P 500 fell 1.5% to 2488.65, booking a 2.1% weekly loss. Dow Jones industrial dropped 1.7% to 21052.53. The Nasdaq ended 1.5% lower at 7373.08. The dollar strengthening continued despite a depressing jobs report showing more than expected 701,000 Americans lost their jobs in March. The live dollar index data show the ICE US Dollar index, a measure of the dollar’s strength against a basket of six rival currencies, rose 1.4% to 100.6 but is lower currently. Futures are rising currently after President Trump commented on Sunday US maybe approaching “a point where things will start changing for the better” as death toll from COVID-19 peaks.

SP500 edges up toward MA(200) 4/6/2020 Market Overview IFC Markets chart

CAC 40 led European stock indexes pullback

European stocks retreated on Friday. GBP/USD joined EUR/USD’s accelerated declining on Friday with both pairs’ dynamics unchanged currently. The Stoxx Europe 600 Index lost 1.0% giving back all of previous session gain as the final Composite Purchasing Managers’ Index dropped to a record low of 29.7 in March, from 51.6 in February. The DAX 30 slipped 0.5% to 9525.77 Friday. France’s CAC 40 dropped 1.6% and UK’s FTSE 100 slumped 1.2% to 5415.50.

Australia’s All Ordinaries Index leads Asian indexes surge

Asian stock indices are sharply higher today. Nikkei jumped 4.2% to 18576.3 as yen accelerated its sliding against the dollar. Stock markets in China are closed for a public holiday. Hong Kong’s Hang Seng Index is 2.2% higher. Australia’s All Ordinaries Index surged 4.3% despite Australian dollar’s resumed climbing against the greenback.

Brent retreats

Brent futures prices are pulling back today after Saudi Arabia and Russia delayed a meeting to discuss crude oil output cuts. Prices rallied on Friday after reports Saudi Arabia and Russia would meet Monday to discuss curbing production by 10 to 15 million barrels a day, and Baker Hughes reported on Friday the number of active US rigs drilling for oil dropped by 62 to 562 last week. Brent for June settlement rallied 13.9% to $34.11 a barrel Friday.

Gold rebound persists

Gold prices are inching higher today. Prices rose on Friday as dollar weakening continued. Gold for June delivery gained 0.5% to $1645.70 an ounce on Friday.

Market Analysis provided by IFCMarkets

Note:
This overview has an informative and tutorial character and is published for free. All the data, included in the overview, are received from public sources, recognized as more or less reliable. Moreover, there is no guarantee that the indicated information is full and precise. Overviews are not updated. The whole information in each overview, including opinion, indicators, charts and anything else, is provided only for familiarization purposes and is not financial advice or а recommendation. The whole text and its any part, as well as the charts cannot be considered as an offer to make a deal with any asset. IFC Markets and its employees under any circumstances are not liable for any action taken by someone else during or after reading the overview.

Precious Metals Are About To Reset Like In 2008 – Gold Bugs, Buckle Up!

By TheTechnicalTraders 

– For years, many Gold Bugs (investors who’ve been advocating buying Gold and Silver at low prices as a hedge against future global economic risks) were shunned as conspiracy theorists and nuts. How could these people believe Gold and Silver were solid investments when the Global equities markets were rallying 5% a year consistently – what could go wrong?

Over the past two weeks, I have personally received multiple phone calls and emails from friends and associates asking how these people can suddenly ”buy physical metals”. In one case, this individual was purchasing Airline and Food Services stocks in late February thinking this move would be short-lived and telling me how the airlines would recover quickly after this is all over.  Now, that person wants to know my secret contacts for buying physical metals.

If you know any Gold Bugs, you know we’ve built relationships with suppliers, friends and other Gold Bugs throughout the year. Believe it or not, I can still buy physical metals from a few of my closest associates in the industry. Eric Sprott is a fan of my precious metals forecasts and talked about my work a few times publicly. Eric owns SprottMoney.com. the other source is SDBullion.com. Both of these are my most trusted sources for buying physical gold and silver, I have never had any issues with them and customer support is top-notch!

Yes, the prices have begun to skyrocket a bit – Silver especially.  But I can still buy physical metals because I have a deep resource of friends and suppliers.

What’s going to happen over the next few weeks is that more and more average people are suddenly going to realize they should have been buying metals as security against risk.  Paper metals are going to explode as well, but physical metals will demand a premium that is much higher than paper/spot price. Right now, one ounce of Silver is going for about $21 to $25 per ounce in physical form (depending on my sources).  The current SPOT price of silver is $14.50. That means the premium for physical Silver is between +45% to +75% right now in the open market.

Before we continue, be sure to opt-in to our free market trend signals 
before closing this page, so you don’t miss our next special report!

Daily Gold Chart

This Daily Gold chart highlights the upside Fibonacci price targets using our Adaptive Fibonacci Price Modeling system.  We believe the next upside price target for Gold is $1825. A higher upside price target is visible on this chart near $1950 and we believe Gold prices will reach this level eventually.  But we believe the current $1825 level is the immediate target.  This would represent an immediate +10 upside price advance and would establish NEW HIGH prices for the past 9 years.

Silver Daily Chart

This Silver Daily chart also highlights our Adaptive Fibonacci Price Modeling system and shows an upside price target of $17.25.  Remember, the current physical demand for Gold and Silver has skyrocketed over the past 2+ weeks. The Spot price is really not indicative of the open market price of physical at the moment.  If Spot Silver moves to $17.25 as we predict, that would be a +19% upside price advance.  If Silver advances to $18.25, that would be a +26% upside price advance.

You should also take a look at our silver chart from 1999 and what happened then, and should happen again now as well.

Silver Bugs are loving the setup right now because they know the pattern that sets up in the Metals market when a crisis hits.  First, Gold begins to rally faster than Silver and the Gold to Silver ratio spikes higher.  Then, once the shock-wave of the market crisis subsides, the metals begin a fairly usual price advance where both Gold and Silver advance – in unequal forms.  This is when the real fun for Gold & Silver Bugs begins.

Gold to Silver Weekly Ratio Chart
THE SILVER LINING

Take a look at this Gold to Silver Weekly Ratio chart.  This chart measures how much one ounce Silver it takes to purchase one ounce of gold at current prices.  Notice that spike in the ratio back in 2008?  That was the spike in gold prices relative to Silver prices as the top formed in 2008 and the “shock wave” struck global investors.  What happened?  Everyone tried to pile into the Gold trade and ignored Silver for about 6+ weeks.

Then what happened to the Gold to Silver Ratio?  It COLLAPSED from levels near 85 to a bottom hear 31.  That means the price of Silver advance almost 3x faster than the price of Gold over that span.  In order for the ratio to fall from near 90 to levels near 30, that indicates a very expansive price increase in the price of Silver.

Now, take a look at what has happened just recently in the Gold to Silver Ratio…  another massive price spike.  This time, the spike reached levels near 120 (Yikes).  Can you guess why Gold and Silver Bugs are so excited right now? If another price advance takes place in precious metals which is similar to the 2008~2011 rally, Gold may see a 300% to 500% rally and Silver may see a 450% to 900% rally over the next 2 to 3 years.

View chart by TradingView.com

This is no joke.  Physical metals are why Gold and Silver Bugs believe the value of having it in your hands is much better than owning an IOU from a broker or bank.

Get ready for some incredible price moves in the metals markets and congrats to all the Gold and Silver bugs out there.  Our analysis says our patience and accumulation of physical metals will soon pay off in a big way.

As a technical analyst and trader since 1997, I have been through a few bull/bear market cycles. I believe I have a good pulse on the market and timing key turning points for short-term swing traders.

I hope you found this informative, and if you would like to get a pre-market video every day before the opening bell, along with my trade alerts visit my Active ETF Trading Newsletter. If you are a long-term investor with any type of retirement account and are looking for signals when to own equities, bonds, or cash, be sure to become a member of my Long-Term Investing Signals which we issued a new signal this week!

Ride my coattails as I navigate these financial markets and build wealth while others lose nearly everything they own during the next financial crisis.

Chris Vermeulen
Chief Market Strategies
TheTechnicalTraders.com


Crude Oil’s 2020 Crash: See What Helped (Some) Traders Pivot Just in Time

The coronavirus wasn’t the cause of oil’s 70% collapse. This was

By Elliott Wave International

Let’s start by establishing that the stock market is not driven by the news. Aggregate stock prices are driven by waves of optimism and pessimism — which go from one extreme to another — as reflected by the Elliott wave model. That’s what makes the stock market predictable.

Hence, Elliott wave analysis is at the core of EWI’s stock market forecasts.

Having said that, sentiment indicators are also valuable in providing clues about “what’s next.”

For example, Robert Prechter’s book, Prechter’s Perspective, made this observation:

No crowd buys stocks of other countries intelligently. For decades, heavy foreign buying in the U.S. stock market has served as an excellent indicator of major tops.

Since the start of 2020, crude oil has gone from “black gold” to “black days,” plummeting 70% for its “worst quarter on record” (March 30, Bloomberg).

As of March 30, oil prices circled the drain of a two-DECADE low near $20 per barrel.

Is there any way an oil trader or active oil investor could look at the market’s crash and NOT see what one March 12 CNN article coined “a nightmare scenario”?

That depends on one simple factor; i.e. did that trader/investor’s methodology enable him/her to pivot in time to anticipate oil’s downturn before it went from blip to “bloodbath” (March 10, Fortune)?

In his timeless Trader’s Classroom eBook “14 Critical Lessons Every Trader Should Know,” Elliott Wave International’s senior instructor Jeffrey Kennedy asserts that the #1 “fatal flaw” for any trader is a “lack of methodology.” Writes Jeffrey:

“If you aim to be a consistently successful trader, then you must have a defined trading methodology, which is simply a clear and concise way of looking at markets.

“If you don’t have a defined trading methodology, then you don’t have a way to know what constitutes a buy or sell signal.

“Moreover, you can’t even consistently correctly identify the trend.”

So, it’s not just about having a methodology. It’s about having the right methodology.

In the case of crude oil, many oil participants rely on the mainstream methodology known as fundamental analysis. It says market trends are driven by external events related to that market. As of March 30, the event responsible for crude’s 2020 crash is the coronavirus, and the substantial contraction in fuel demand that has resulted from the ongoing, virus-driven travel bans.

Said one March 30 BBC:

“Coronavirus: Oil price collapses to lowest level for 18 years… The price of oil has sunk to levels not seen since 2002 as demand for crude collapses amid the coronavirus pandemic.”

That is now, March 30, 70% down and three months into crude’s crash.

But what about then, in early January, when oil prices orbited an 8-month high near $70 per barrel?

The coronavirus was barely a dot on crude oil’s radar, having taken just two lives and sickened 45 all overseas. As one health expert predicted in a January 17 New York Times:

“There will probably be cases in the United States at some point, but we believe the current risk from the virus to the general public is low.”

COVID-19 wasn’t the bearish news event oil experts were watching; the bullish escalating tensions in the Middle East — set off by the January 3 US drone attack which killed the “second most powerful man in Iran” General Qassem Soleimani — were. A series of retaliations by Iran followed, culminating in Iran’s threat to block exports of oil through the vital gateway the Strait of Hormuz. Wrote one January 8 CNBC:

“Oil prices will climb above $100 a barrel if Iran blocks the Strait of Hormuz.”

Added another news source: “An extended period of conflict in the region will support prices by fueling uncertainty, even as alternative suppliers step up.” (Oil and Gas Journal)

Yet — instead of the ongoing conflict supporting prices, oil turned down on January 6 and didn’t look back. The fundamental methodology failed to prepare traders, either for the direction or the depth of that turn.

The methodology known as the Wave Principle did both.

Meet the Elliott Wave Principle, Esquire

In his Trader’s Classroom eBook “14 Critical Lessons Every Trader Should Know,” Jeffrey half-jokes that the best trading methodologies are so simple, they can “fit on the back of a business card.”

And in his January 17 Commodity Junctures Service, Jeffrey used the tools and rules of the Wave Principle to identify an alternate bearish wave count for crude oil that called for prices to be slashed in half from current levels. In Jeffrey’s words:

“The big narrative when you start looking at the weekly and monthly crude oil charts is — any strength we see is going to fail.”

The basis of Jeffrey’s bearish analysis was the possibility that wave 2 was over, setting the stage for a third wave decline. Pictured below: Jeffrey’s January 17 Commodity Juncture Service chart of crude oil followed by an idealized diagram of an Elliott third wave.

Note the timing of Jeffrey’s January 17 bearish oil forecast. It occurred before the very first coronavirus travel restrictions were enforced on January 23, and before the OPEC+ “price war” began on March 6.

Soon after, on February 7, Jeffrey’s near-term sister service Daily Commodity Junctures confirmed that oil’s trend was now down and said,

It’s basically telling us that the high of the year is in place in crude oil and we will fall to $33 a barrel — at minimum.

The next chart captures the action: Oil prices took the downside in earnest, plunging below $33 per barrel as anticipated by Jeffrey’s January 17 bearish wave count.

The crude oil crash is just one real-world example of the danger of not having a methodology that leads trend changes, rather than follows them.

In his Trader’s Classroom eBook “14 Critical Lessons Every Trader Should Know,” Jeffrey expounds on all 5 “fatal flaws” of trading and offers original charts and lessons that stand the test of time.

In Jeffrey’s words:

“Trading successfully is not easy. It’s hard work…damn hard. And if anyone leads you to believe otherwise, run the other way, and fast.

“But this hard work can be rewarding, above-average gains are possible and the sense of satisfaction one feels after a few nice trades is absolutely priceless.”

Get instant access to the complete, 45-page eBook today by joining the rapidly growing Club EWI community — absolutely FREE. Get started now!

Stocks Have Entered a 25-35year Crisis Cycle Re-evaluation Event

By TheTechnicalTraders 

– We can only imagine what many of you are thinking and feeling right now.  Shock?  Concern?  Despair?  Some of you have already emailed us asking about the US and Global markets to find out what our predictive modeling systems are suggesting.  Today, we’re going to show you what the longer-term Adaptive Fibonacci Price Modeling system is suggesting for the S&P and NASDAQ.

First, we want to ask you to slow down, take a few seconds to realize we will recover from this virus event and the smart thing to do is protect your family, protect your assets, and prepare for the future.  Market crashes happen only 2-3 times in a lifetime and they, not the end of the world or financial system.

This event is different than the 2000 or 2008 market crash events.  Each of those past events was somewhat localized events that disrupted a segment or portion of the global economy.  Yes, the 2008 event was bigger than the 2000 event, but the localization of the event still presented a similarity that provided a moderately quick recovery process.

Before we continue, be sure to opt-in to our free market trend signals 
before closing this page, so you don’t miss our next special report!

Next, we want you to attempt to understand this virus event is a bit different than the most recent crash events.  A virus pandemic of this nature will likely result in a much broader economic contraction and various collateral damage processes as it transitions across the globe.  Currently, our research team is attempting to watch for the early signs of these collateral damage processes to determine if a broader global market collapse is going to take place.  At this time, we must all try to prepare for what is unknown and could happen in the future.

The longer-term generational cycle (the roughly 85-year Strauss-Howe Theory suggests societies navigate a long term cycle that repeats itself, roughly, every 85 years).  This societal evolutionary theory centers around the concept that people repeat many of the same failures learned by previous generations – roughly every 85 years.  What was learned in the 1920s~1940s will have been forgotten in the 1990s~2020 and many of the same mistakes will be made.

One of our researchers, Brad Matheny, authored a book in March 2019 that analyzed these super-cycles and accurately predicted this market crash could happen as early as August or September 2019.  Within this book, Mr. Matheny made great efforts to illustrate how important it is for everyone to become aware of these bigger market cycles and to prepare for what was likely to come near the end of 2019 and into early 2020.  You can get your own copy of this book here.

Additionally, smaller market cycles take place within the bigger super-cycles. This example of the 8.6-year business cycle highlights the repetitive nature of these broader market cycles.  Think about how 10 of these smaller business cycles equal the much larger 85-year generational cycle.  Now, think about how each stage of the roughly 20~21 year generational cycle has played out over the last 85 years.

This screen capture highlights the phases and structures of the broader Strauss-Howe generational theory.  Pay very close attention to how structured the process is and what to expect in the future.  Also, notice that we entered a CRISIS phase in 2005.

Past cycles have lasted more than the average 20~21 years.  Longer cycle lengths are not uncommon within the broader 85-year super-cycle when larger societal events take place.  Thus, this current CRISIS phase could last 25 to 35 years before a new HIGH phase sets up.

The reason we are bringing all of this together within this article is because we want to clearly stress forward and future expectations as well as to make our longer-term market concerns very clear to all of you.  If, as the generational cycles suggest, we have entered a CRISIS phase and are moving toward a HIGH phase, then we are in the midst of a phase that can be very destructive to institutions and society as a whole.

“According to the authors, the Fourth Turning is a Crisis. This is an era of destruction, often involving war or revolution, in which institutional life is destroyed and rebuilt in response to a perceived threat to the nation’s survival. After the crisis, civic authority revives, cultural expression redirects towards community purpose, and people begin to locate themselves as members of a larger group.”

These super-cycles and the broader “collateral damage” issue is what leads our researchers to believe the US and Global markets may continue to target much deeper price support levels before finding a bottom.  Even though the US and global central banks are doing everything possible to avoid a contagion economic collapse, we believe many people have “forgotten” about these broader market cycles and may be shocked to learn the COVID-19 virus event is happening in the midst of an 85-year generational Super-Cycle that predicts a true price bottom (new HIGH phase) may not set up until 2030~2035.

Let’s take a look at where our Adaptive Fibonacci Price Modeling system is suggesting the markets may bottom..

Daily S&P 500 Futures Chart

We’ll start by exploring this Daily ES chart which highlights two key Fibonacci downside price targets: 1683 and 1225.  Look for the GREY and RED lines near the bottom of this chart and look for the BLUE/RED and GREY SQUARES near the right edge of this chart.  These SQUARES are the DAILY Fibonacci downside price targets as calculated by our Adaptive Fibonacci Price Modeling system.

Also, pay attention to the CYAN price channel that we’ve drawn on this chart highlighting the current downside price channel that has setup.  It is our opinion that price will likely attempt to stay within this price channel as it moves deeper to target these support levels – eventually attempting to set up a bottom near either of these deeper Fibonacci support levels.

Weekly S&P 500 Futures Chart

This Weekly ES chart highlights the Weekly Adaptive Fibonacci Price Modeling system’s results – which are almost exactly the same as the Daily targets.  This is very important if you understand that the Fibonacci price structure is supposed to be structured in a universal means throughout all price activity.  Thus, if the Daily and Monthly Fibonacci Modeling system is targeting the exact same levels – then this carries much greater importance to us.

The same downside targets in the ES are 1683 and 1225.  These represent a continued downside price move of -32.75% or -50.25% from current levels.  The YELLOW lines we’ve drawn on the chart represent what we believe the bottom may look like if the first level of support, 1683, acts at a bottom.  We do believe a bottom will set up in a FLAG formation that may take many months to complete before any real rally begins.

We issued an important investment trade alert this week that you should know about if you have not read this alert so be sure to do so now!

Weekly Nasdaq Futures Chart

This Weekly NQ chart points to an even deeper price bottom.  The downside Fibonacci targets are 3900 and 1865 (-48.59% and -75.15% below current price levels).  These deeper price targets suggest the NASDAQ market may become unusually volatile over the next 12 to 24+ months.  We believe this could become an unforeseen risk for many global investors that believe technology will recover faster than many other market sectors.  If our research is correct, the NASDAQ could collapse to far deeper levels than the S&P or the Dow Industrials.

How could the NASDAQ collapse like this?  Remember the “collateral damage” aspect and think about what it would take for these technology companies to loose their financial support?  Companies like Twitter, Uber and dozens of others operate with negative annual cash-flow – they depend on spending money they can’t earn to stay in business.  If this cash reserve vanishes – what happens?

The process of getting to these lows can come in many forms – yet the targets are still there for us to understand and prepare for.

On the weekend I wrote an interesting post sharing a trading experience I had during the 2000 bull market and how there are some similarities in price patterns and psychologically with traders as we have right now. It’s worth a read.

Watch for the global markets to continue to target recent lows.  On the NQ chart, above, we’ve drawn some CYAN lines near recent lows to illustrate these levels.  If the global markets do collapse to the Fibonacci levels we are predicting, then a much bigger contagion event is taking place along with the generational cycles and an unraveling of many institutional processes and functions.  Remember, we may continue within the CRISIS phase of the Super-Cycle for another 3 to 10+ years.  The COVID-19 virus event may be just the trigger of this collapse – but the writing has been on the wall for many decades.

Be very cautious buying into these dips at the moment.  We have been warning about this event for a while. Just last week we published a short guide and our basic trading and investing strategy on how to profit from bear market cycles – explained. Our researchers predicted August/September 2019 as the “critical date” and urged “move to cash” at that time to protect your assets from this event – few listened to us while the markets continued to push higher.

Luckily, on February 23rd we closed out all of our remaining positions for our active ETF trading account with our subscribers. Our trading accounts are sitting at a new high watermark and we avoided the market crash and took advantage of the 20% rally in bonds.

Maybe more people will listen to us after reading this article and prepare for what may come in the near future?  Maybe some of you will grasp the idea that these Super-Cycles are real and learn this may become the greatest opportunity of your life with our help.

As a technical analyst and trader since 1997, I have been through a few bull/bear market cycles. I believe I have a good pulse on the market and timing key turning points for short-term swing traders.

I hope you found this informative, and if you would like to get a pre-market video every day before the opening bell, along with my trade alerts visit my Active ETF Trading Newsletter. If you are a long-term investor with any type of retirement account and are looking for signals when to own equities, bonds, or cash, be sure to become a member of my Long-Term Investing Signals.

Ride my coattails as I navigate these financial markets and build wealth while others lose nearly everything they own during the next financial crisis.

Chris Vermeulen
Chief Market Strategies
Founder of Technical Traders Ltd.

TheTechnicalTraders.com

The Analytical Overview of the Main Currency Pairs on 2020.04.03

by JustForex

The EUR/USD currency pair

Technical indicators of the currency pair:
  • Prev Open: 1.09615
  • Open: 1.08554
  • % chg. over the last day: -0.97
  • Day’s range: 1.07984 – 1.08648
  • 52 wk range: 1.0777 – 1.1494

EUR/USD quotes continue to show negative dynamics. The trading instrument has updated local lows. The coronavirus epidemic continues to impact the global economy negatively. The number of infections in the world exceeded 1 million. The jobless claims in the US exceeded historic highs and counted to more than 6.6 million. Currently, EUR/USD quotes are consolidating in the range of 1.08000-1.08700. Financial market participants have taken a wait-and-see attitude before the publication of US labor statistics for March. We recommend paying attention to the difference between the actual and forecasted values. Positions should be opened from key levels.

The Economic News Feed for 03.04.2020:

  • – Indicators on economic activity in the Eurozone at 11:00 (GMT+3:00);
  • – Report on the US labor market at 15:30 (GMT+3:00);
  • – ISM non-manufacturing PMI at 17:00 (GMT+3:00).
EUR/USD

Indicators signal the power of sellers: the price has fixed below 50 MA and 100 MA.

The MACD histogram is in the negative zone and continues to decline, that gives a strong signal to sell EUR/USD.

Stochastic Oscillator is in the neutral zone, the %K line is below the %D line, which also indicates the bearish sentiment.

Trading recommendations
  • Support levels: 1.08000, 1.07200
  • Resistance levels: 1.08700, 1.09200, 1.09700

If the price fixes below the round level of 1.08000, a further fall in the EUR/USD currency pair is expected. The movement is tending to 1.07500-1.07000.

An alternative could be the growth of EUR/USD quotes to 1.09200-1.09700.

The GBP/USD currency pair

Technical indicators of the currency pair:
  • Prev Open: 1.23771
  • Open: 1.23997
  • % chg. over the last day: +0.11
  • Day’s range: 1.23252 – 1.24023
  • 52 wk range: 1.1466 – 1.3516

The GBP/USD currency pair is still being traded in a prolonged flat. There is no defined trend. The key support and resistance levels are 1.23000 and 1.24800, respectively. Financial market participants have taken a wait-and-see attitude. Today, the US labor market report for March is in the focus of attention. Positions should be opened from key levels.

At 11:30 (GMT+3:00), composite PMI will be published in the UK.

GBP/USD

Indicators do not give accurate signals: the price has crossed 50 MA.

The MACD histogram is near the 0 mark.

Stochastic Oscillator is in the neutral zone, the %K line has crossed the %D line. There are no signals at the moment.

Trading recommendations
  • Support levels: 1.23000, 1.21450, 1.20150
  • Resistance levels: 1.24800, 1.25500

If the price fixes below the round level of 1.23000, GBP/USD quotes are expected to fall. The movement is tending to 1.22000-1.21000.

An alternative could be the growth of the GBP/USD currency pair to 1.25500-1.26000.

The USD/CAD currency pair

Technical indicators of the currency pair:
  • Prev Open: 1.41923
  • Open: 1.41358
  • % chg. over the last day: -0.40
  • Day’s range: 1.41163 – 1.41972
  • 52 wk range: 1.2949 – 1.4668

The technical pattern on the USD/CAD currency pair is still ambiguous. The loonie is in a sideways trend. The local support and resistance levels are 1.40800 and 1.42000, respectively. The recovery of “black gold” prices supports the Canadian dollar. Today we recommend paying attention to economic releases from the US. Positions should be opened from key levels.

The news feed on Canada’s economy is calm.

USD/CAD

Indicators do not give accurate signals: the price has crossed 50 MA and 100 MA.

The MACD histogram is near the 0 mark.

Stochastic Oscillator is in the neutral zone, the %K line is below the %D line, which indicates the bearish sentiment.

Trading recommendations
  • Support levels: 1.40800, 1.40100, 1.39250
  • Resistance levels: 1.42000, 1.42700, 1.43350

If the price fixes below 1.40800, USD/CAD quotes are expected to fall. The movement is tending to 1.40100-1.39500.

An alternative could be the growth of the USD/CAD currency pair to 1.42500-1.43000.

The USD/JPY currency pair

Technical indicators of the currency pair:
  • Prev Open: 107.154
  • Open: 107.886
  • % chg. over the last day: +0.13
  • Day’s range: 107.808 – 108.292
  • 52 wk range: 101.19 – 112.41

USD/JPY quotes have been growing. The trading instrument has updated local highs. At the moment, the “safe haven” currency is testing the resistance level of 108.250. The 107.600 mark is the nearest support. Today, investors will assess US labor statistics for March. We also recommend paying attention to the dynamics of US government bonds yield. Positions should be opened from key levels.

The news feed on Japan’s economy is calm enough.

USD/JPY

Indicators do not give accurate signals: the price has fixed between 50 MA and 100 MA.

The MACD histogram is in the positive zone, which indicates the growth of USD/JPY quotes.

Stochastic Oscillator is in the neutral zone, the %K line is above the %D line, which gives a signal to buy USD/JPY.

Trading recommendations
  • Support levels: 107.600, 107.000, 106.500
  • Resistance levels: 108.250, 108.700, 109.600

If the price fixes above 108.250, further growth of USD/JPY quotes is expected. The movement is tending to 108.700-109.200.

An alternative could be a decrease in the USD/JPY currency pair to a round level of 107.000.

by JustForex

Ichimoku Cloud Analysis 03.04.2020 (BTCUSD, XAUUSD, EURUSD)

Article By RoboForex.com

BTCUSD, “Bitcoin vs US Dollar”

BTCUSD is trading at 6750.00; the instrument is moving above Ichimoku Cloud, thus indicating a bullish tendency. The markets could indicate that the price may test the cloud’s upside border at 6555.00 and then resume moving upwards to reach 7445.00. Another signal to confirm further ascending movement is the price’s rebounding from the rising channel’s downside border. However, the scenario that implies further growth may be canceled if the price breaks the cloud’s downside border and fixes below 6325.00. In this case, the pair may continue falling towards 5825.00.

BTCUSD
Risk Warning: the result of previous trading operations do not guarantee the same results in the future

XAUUSD, “Gold vs US Dollar”

XAUUSD is trading at 1610.00; the instrument is moving above Ichimoku Cloud, thus indicating an ascending tendency. The markets could indicate that the price may test Tenkan-Sen and Kijun-Sen at 1600.00 and then resume moving upwards to reach 1635.00. Another signal to confirm further ascending movement is the price’s rebounding from the rising channel’s downside border. However, the scenario that implies further growth may be canceled if the price breaks the cloud’s downside border and fixes below 1580.00. In this case, the pair may continue falling towards 1535.00.

GOLD
Risk Warning: the result of previous trading operations do not guarantee the same results in the future

EURUSD, “Euro vs US Dollar”

EURUSD is trading at 1.0847; the instrument is moving below Ichimoku Cloud, thus indicating a descending tendency. The markets could indicate that the price may test the cloud’s downside border at 1.0895 and then resume moving downwards to reach 1.0705. Another signal to confirm further descending movement is the price’s rebounding from the descending channel’s upside border. However, the scenario that implies further decline may be canceled if the price breaks the cloud’s upside border and fixes above 1.0975. In this case, the pair may continue growing towards 1.1065.

EURUSD

Article By RoboForex.com

Attention!
Forecasts presented in this section only reflect the author’s private opinion and should not be considered as guidance for trading. RoboForex LP bears no responsibility for trading results based on trading recommendations described in these analytical reviews.

Fibonacci Retracements Analysis 03.04.2020 (BITCOIN, ETHEREUM)

Article By RoboForex.com

BTCUSD, “Bitcoin vs US Dollar”

As we can see in the H4 chart, the correctional uptrend has reached 50.0% The next upside target may be at 61.8% fibo (7987.75) but the divergence on MACD indicates a possible reverse soon. After completing the correction, the instrument may resume falling to break the support – the low at 3929.75.

BTCUSD
Risk Warning: the result of previous trading operations do not guarantee the same results in the future

In the H1 chart, the convergence on MACD made the pair start a new rising wave. The short-term upside targets may be inside the post-correctional extension area between 138.2% and 161.8% fibo at 7410.00 and 7685.00 respectively. The support is the low at 5851.00.

BITCOIN
Risk Warning: the result of previous trading operations do not guarantee the same results in the future

ETHUSD, “Ethereum vs. US Dollar”

In the H4 chart, ETHUSD has broken the consolidation range to the upside; right now, it is moving towards 38.2% and 50.0% fibo at 166.13 and 189.40 respectively. The support is the low at 89.80.

ETHEREUM
Risk Warning: the result of previous trading operations do not guarantee the same results in the future

The H1 chart shows a short-term rising wave towards 38.2% fibo at 166.13.

ETHUSD

Article By RoboForex.com

Attention!
Forecasts presented in this section only reflect the author’s private opinion and should not be considered as guidance for trading. RoboForex LP bears no responsibility for trading results based on trading recommendations described in these analytical reviews.

EURUSD: bears gaining momentum

By Alpari.com

On Thursday the 2nd of April, trading on the euro closed down, with the EURUSD pair dropping to 1.0821. The US dollar ignored the record number of new unemployment benefit claims, which hit 6.6 million against a forecast of 3.5 million. Markets were already shaken after US President Donald Trump warned Americans on Tuesday to expect a tough two weeks ahead.

The number of confirmed coronavirus cases has surpassed 1 million. Demand for safe haven assets remains high, which is helping the dollar hold its own against the other major currencies.

Day’s news (GMT+3):

  • 10:50 France: Markit services PMI (Mar).
  • 10:55 Germany: Markit services PMI (Mar).
  • 11:00 Eurozone: Markit services PMI (Mar).
  • 11:30 UK: Markit services PMI (Mar).
  • 12:00 Eurozone: retail sales (Feb).
  • 15:30 US: unemployment rate (Mar), nonfarm payrolls (Mar).
  • 16:45 US: Markit services PMI (Mar).
  • 17:00 US: ISM non-manufacturing PMI (Mar).
  • 20:00 US: Baker Hughes US oil rig count.

Pic. 1Current situation:

At 6.6 million, the number of initial jobless claims in the last week was double the amount expected. The dollar, however, ignored this, and the bulls failed to induce a rebound from 1.0875. The pair continues its downwards trajectory along the D3 line.

There’s no prediction in today’s review, since all eyes are on the US employment market, particularly the nonfarm payrolls report. We don’t make predictions on payrolls day,  but we’re inclined to believe that the market will largely ignore employment data for March, since it hasn’t been having much of an effect over the last couple of weeks.

The pair is declining within a downwards channel. The LB line is acting as a dynamic support level. Pressure on the euro could increase ahead of the weekend as the bears set their sights on 1.0768 and 1.0697.

By Alpari.com

Will bad NFPs push the USD/JPY towards 105.00?

By Admiral Markets

Economic Events

Source: Economic Events April 3, 2020 – Admiral Markets’ Forex Calendar

For weekly close, the eyes of forex traders around the globe will on the US employment report and the Non-Farm Payrolls (NFPs).

The ADP data on Wednesday, usually a good indication for today’s NFP’s, came in at only -27,000, while market participants expected it to be around -154,000 (and thus better than expected), but what counts can be read between the lines.

The ADP data only covered the period through March 12, being the period before the worst of the Coronavirus-induced economic freeze took place.

With that in mind, this new ADP dataset carries no good NFP-indication, and the risk of an acceleration of the bearish momentum in the USD/JPY in response to a print below expectations (currently at -100,000), driven by an even further drop in 10-year-US Treasury yields, seems a serious option.

On the other hand: if a new wave of risk-off hits global financial markets, under “normal” circumstances this would usually be a driver to lower the USD/JPY, this time such a risk-off has the potential to result in a sharp USD/JPY reversal. This being because we expect such a risk-off wave to go hand-in-hand with increasing demand for the US dollar given the global USD shortage.

So, while we need to wait to see if such a risk-off hits the markets and result in a strong USD demand; a test, or probably even break of the region around 112.00/30 is still on the table.

Nevertheless, given the recent bearish momentum in the USD/JPY, we currently favour further bearish momentum, especially with a disappoint NFP print, bringing a test of the region around 105.00 into play:

Source: Admiral Markets MT5 with MT5-SE Add-on USD/JPY Daily chart (between February 8, 2019, to April 2, 2020). Accessed: April 2, 2020, at 9:00pm GMT – Please note: Past performance is not a reliable indicator of future results, or future performance.

In 2015, the value of the USD/JPY increased by 0.5%, in 2016, it fell by 2.8%, in 2017, it fell by 3.6%, in 2018, it fell by 2.7%, in 2019, it fell by 0.85%, meaning that after five years, it was down by 9.2%.

Discover the world’s #1 multi-asset platform

Admiral Markets offers professional traders the ability to trade with a custom, upgraded version of MetaTrader 5, allowing you to experience trading at a significantly higher, more rewarding level. Experience benefits such as the addition of the Market Heat Map, so you can compare various currency pairs to see which ones might be lucrative investments, access real-time trading data, and so much more. Click the banner below to start your FREE download of MT5 Supreme Edition!

Download MetaTrader 5 and begin trading today!

Disclaimer: The given data provides additional information regarding all analysis, estimates, prognosis, forecasts or other similar assessments or information (hereinafter “Analysis”) published on the website of Admiral Markets. Before making any investment decisions please pay close attention to the following:

  1. This is a marketing communication. The analysis is published for informative purposes only and are in no way to be construed as investment advice or recommendation. It has not been prepared in accordance with legal requirements designed to promote the independence of investment research, and that it is not subject to any prohibition on dealing ahead of the dissemination of investment research.
  2. Any investment decision is made by each client alone whereas Admiral Markets shall not be responsible for any loss or damage arising from any such decision, whether or not based on the Analysis.
  3. Each of the Analysis is prepared by an independent analyst (Jens Klatt, Professional Trader and Analyst, hereinafter “Author”) based on the Author’s personal estimations.
  4. To ensure that the interests of the clients would be protected and objectivity of the Analysis would not be damaged Admiral Markets has established relevant internal procedures for prevention and management of conflicts of interest.
  5. Whilst every reasonable effort is taken to ensure that all sources of the Analysis are reliable and that all information is presented, as much as possible, in an understandable, timely, precise and complete manner, Admiral Markets does not guarantee the accuracy or completeness of any information contained within the Analysis. The presented figures refer that refer to any past performance is not a reliable indicator of future results.
  6. The contents of the Analysis should not be construed as an express or implied promise, guarantee or implication by Admiral Markets that the client shall profit from the strategies therein or that losses in connection therewith may or shall be limited.
  7. Any kind of previous or modeled performance of financial instruments indicated within the Publication should not be construed as an express or implied promise, guarantee or implication by Admiral Markets for any future performance. The value of the financial instrument may both increase and decrease and the preservation of the asset value is not guaranteed.
  8. The projections included in the Analysis may be subject to additional fees, taxes or other charges, depending on the subject of the Publication. The price list applicable to the services provided by Admiral Markets is publicly available from the website of Admiral Markets.
  9. Leveraged products (including contracts for difference) are speculative in nature and may result in losses or profit. Before you start trading, you should make sure that you understand all the risks.

By Admiral Markets