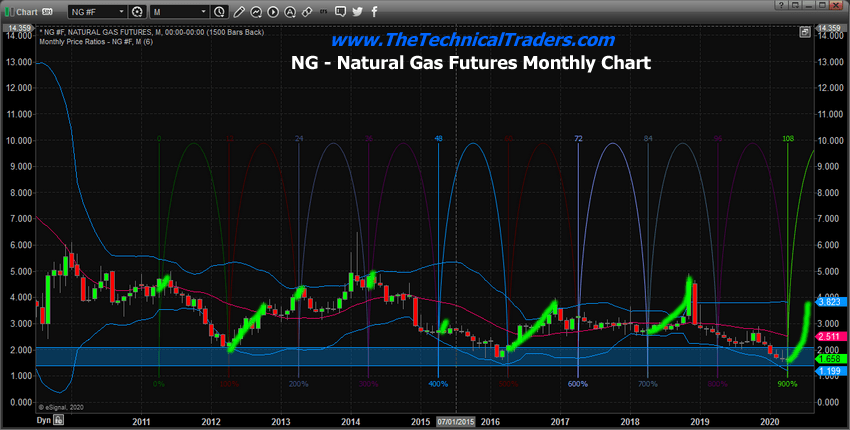
Author Archive for InvestMacro – Page 62

Is Natural Gas Ready For An April Rally?

By TheTechnicalTradersOur researchers have been following Natural Gas for many months and believe the current price level, near $1.65, is acting as a continued historical support level (a floor in price).  Our researchers also used one of our data mining tools to attempt to identify if any opportunity exists in NG over the next 30 to 60+ days for skilled traders.  The purpose of this data mining tool is to explore historical price activity and to determine if there is any true price “bias” that exists within certain months.

For example, if we could determine that Natural Gas tends to rally in April by a 2:1 ratio (historically) and that the rally in NG is typically somewhere between $0.50 and $1.50 to the upside, then we could attempt to use this information to set up a trade that allows us to attempt to profit from this potential future trend bias.  A 2:1 ratio would indicate that, historically, the price rallied 10 times and didn’t rally 5 times over a span of 15 instances.

Our data mining utility reported the following data for April, May, and June in Natural Gas.

Monthly Natural Gas Price Chart

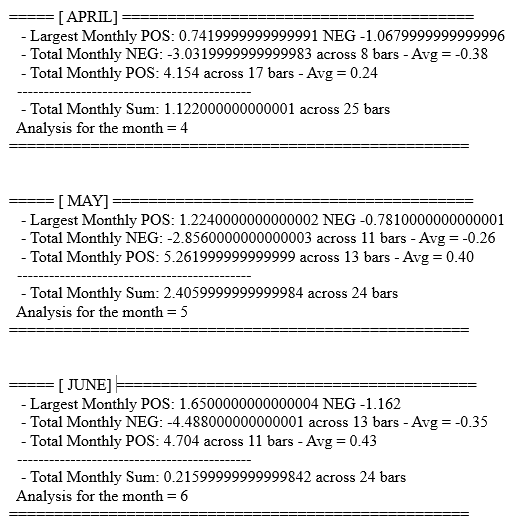
If we look at the APRIL data, the POS bars = 17 and the NEG bars = 8 – that sets up a slightly greater than 2:1 ratio of advancing price over declining price in April.  The “Total Monthly Sum” across 25 instances of data is $1.12 whereas the Average for the POS price activity comes to just $0.24.

This suggests that in April, we have a fairly high opportunity for some upside price activity in Natural Gas based on this data – a nearly 2:1 advancing price ratio (historically).  Yet it also means that advancing price may only rally $0.35 to $0.75 from any price bottom – so we have to be aware of risks that may exists with a small price advance from the current low levels.

If we take a look at the MAY data, the POS bars = 13 and the NEG bars = 11 – that sets up a 1.18:1 ratio that suggests a very slight advantage to the possibility that continued upside price activity will happen in May.  Yet, the upside price advantage shown my the “Total Monthly Sum” data suggests a very big opportunity for a breakout rally in May (+$2.40).  The way I interpret this data is to understand that May is roughly 60/40 biased to the upside whereas if any upside move takes place in April, a continuation of that trend in May could be incredibly profitable with a proper strategy.

Take a look at the JUNE data and try to come up with an interpretation yourself.  The POS bars / NEG bars represent a less than 1:1 ratio.  The Total Monthly Sum ($0.21) is not a very substantial price advance.  The data is somewhat indecisive or inconclusive in suggesting any real price advantage in June for trading.

Yet, we have a very clear advantage in April and May.  So, how are we going to approach this trade setup?

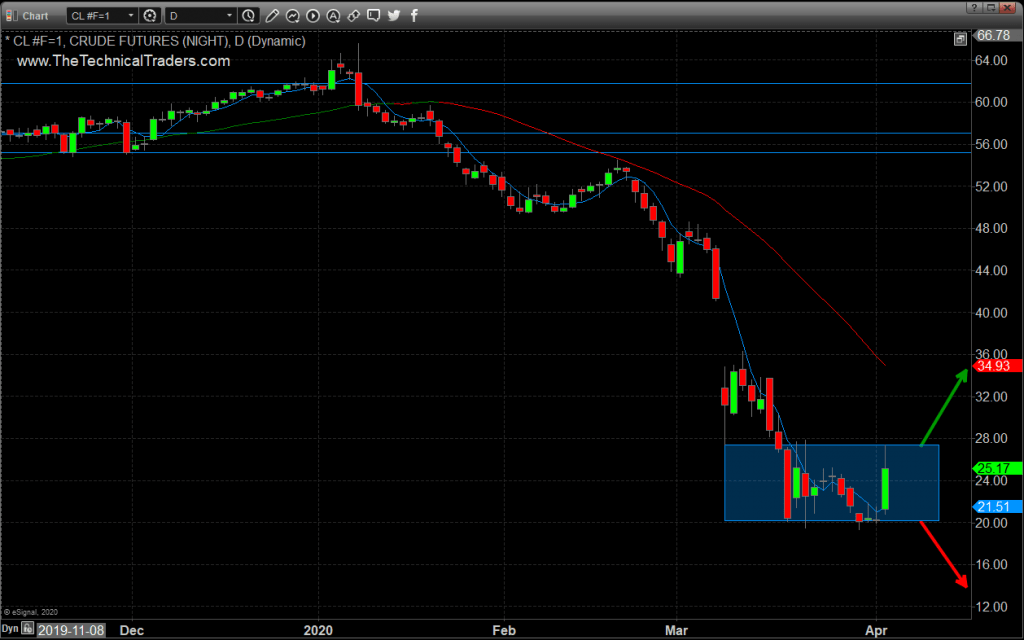
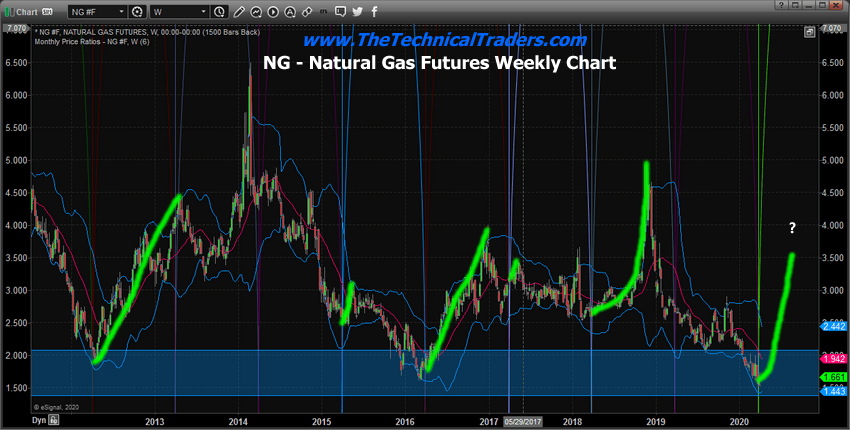
Weekly Natural Gas Chart – Cycles & Support

Currently, NG is testing very deep price levels within the BLUE support range box.  Aggressive traders can attempt to look for opportunities within this range but must understand risks are still high for continued moderate price decline before a bottom sets up in April.  Skilled traders would wait for the bottom to set up and possibly look for opportunities in ETFs as a means to limit risks on initial positions – attempting to scale into the trade comfortably.

Once the rally in NG really sets up and breaches the $1.98 level moving higher, then we believe we have a very real rally on our hands that may see price levels back above $2.75 eventually.  The $1.85 to $1.99 price level will act as resistance as price attempts to move higher.

Before we continue, be sure to opt-in to our free market trend signals 
before closing this page, so you don’t miss our next special report!

Why are these types of setups so important to skilled traders?  Historical price structures and patterns, like this data mining pattern, help to clearly illustrate strategic advantages in certain markets for skilled traders. Determining how to set up a proper trade knowing this data is also important.  Risks exist with every trade you make and I’m sure we’ve all learned a lesson or two about making a hasty trade and not thinking about it?

Our research team believes April and May 2020 could be very exciting for Natural Gas.

As a technical analyst and trader since 1997, I have been through a few bull/bear market cycles in stocks and commodities. I believe I have a good pulse on the market and timing key turning points for investing and short-term swing traders.

I hope you found this informative, and if you would like to get a pre-market video every day before the opening bell, along with my trade alerts visit my Active ETF Trading Newsletter.

We all have trading accounts, and while our trading accounts are important, what is even more important are our long-term investment and retirement accounts. Why? Because they are, in most cases, our largest store of wealth other than our homes, and if they are not protected during a time like this, you could lose 25-50% or more of your entire net worth. The good news is we can preserve and even grow our long term capital when things get ugly like they are now and ill show you how and one of the best trades is one your financial advisor will never let you do because they do not make money from the trade/position.

If you have any type of retirement account and are looking for signals when to own equities, bonds, or cash, be sure to become a member of my Long-Term Investing Signals which we issued a new signal for subscribers.

Ride my coattails as I navigate these financial markets and build wealth while others lose nearly everything they own during the next financial crisis.

Chris Vermeulen
Chief Market Strategies

TheTechnicalTraders.com


Japanese Candlesticks Analysis 07.04.2020 (USDCAD, AUDUSD, USDCHF)

Article By RoboForex.com

USDCAD, “US Dollar vs Canadian Dollar”

As we can see in the H4 chart, after forming a Hammer pattern and reversing, USDCAD has tested the channel’s upside border. At the moment, the pair is still rebounding from the resistance level to continue the descending tendency. In this case, the downside target may be at 1.3920. At the same time, there might be another scenario, which implies that the instrument may re-test the channel’s upside border and grow towards 1.4300.

USDCAD
Risk Warning: the result of previous trading operations do not guarantee the same results in the future

AUDUSD, “Australian Dollar vs US Dollar”

As we can see in the H4 chart, the pair continues the ascending tendency. After completing an Inverted Hammer pattern near the rising channel’s downside border, AUDUSD is reversing. Later, the price may continue trading upwards to reach 0.6333. Still, the instrument may choose a different scenario and continue falling towards 0.6000.

AUDUSD
Risk Warning: the result of previous trading operations do not guarantee the same results in the future

USDCHF, “US Dollar vs Swiss Franc”

As we can see in the H4 chart, the pair continues forming the ascending channel. By now, USDCHF has formed a Doji pattern near the resistance level. The current situation suggests that after reversing the pair may start a slight correction and then continue the ascending tendency. In this case, the upside target may be at 0.9868. However, one shouldn’t ignore another scenario, which implies a deeper correction towards 0.9645.

USDCHF

Article By RoboForex.com

Attention!
Forecasts presented in this section only reflect the author’s private opinion and should not be considered as guidance for trading. RoboForex LP bears no responsibility for trading results based on trading recommendations described in these analytical reviews.

Ichimoku Cloud Analysis 07.04.2020 (BTCUSD, AUDUSD, USDCAD)

Article By RoboForex.com

BTCUSD, “Bitcoin vs US Dollar”

BTCUSD is trading at 7240.00; the instrument is moving above Ichimoku Cloud, thus indicating a bullish tendency. The markets could indicate that the price may test the cloud’s upside border at 7105.00 and then resume moving upwards to reach 7845.00. Another signal to confirm further ascending movement is the price’s rebounding from the rising channel’s downside border. However, the scenario that implies further growth may be canceled if the price breaks the cloud’s downside border and fixes below 6685.00. In this case, the pair may continue falling towards 5965.00.

BTCUSD
Risk Warning: the result of previous trading operations do not guarantee the same results in the future

AUDUSD, “Australian Dollar vs US Dollar”

AUDUSD is trading at 0.6146; the instrument is moving above Ichimoku Cloud, thus indicating a bullish tendency. The markets could indicate that the price may test the cloud’s upside border at 0.6115 and then resume moving upwards to reach 0.6455. Another signal to confirm further ascending movement is the price’s rebounding from the rising channel’s downside border. However, the scenario that implies further growth may be canceled if the price breaks the cloud’s downside border and fixes below 0.5895. In this case, the pair may continue falling towards 0.5805.

AUDUSD
Risk Warning: the result of previous trading operations do not guarantee the same results in the future

USDCAD, “US Dollar vs Canadian Dollar”

USDCAD is trading at 1.4049; the instrument is moving below Ichimoku Cloud, thus indicating a bearish tendency. The markets could indicate that the price may test Tenkan-Sen and Kijun-Sen at 1.4125 and then resume moving downwards to reach 1.3775. Another signal to confirm further descending movement is the price’s rebounding from the downside border of a Triangle pattern. However, the scenario that implies further decline may be canceled if the price breaks the cloud’s upside border and fixes above 1.4255. In this case, the pair may continue growing towards 1.4335.

USDCAD

Article By RoboForex.com

Attention!
Forecasts presented in this section only reflect the author’s private opinion and should not be considered as guidance for trading. RoboForex LP bears no responsibility for trading results based on trading recommendations described in these analytical reviews.

The Analytical Overview of the Main Currency Pairs on 2020.04.07

by JustForex

The EUR/USD currency pair

Technical indicators of the currency pair:
  • Prev Open: 1.08105
  • Open: 1.07919
  • % chg. over the last day: -0.11
  • Day’s range: 1.07833 – 1.08772
  • 52 wk range: 1.0777 – 1.1494

EUR/USD quotes have been growing after a prolonged fall. The trading instrument has updated local highs. At the moment, the EUR/USD currency pair is testing the 1.08800 mark. The level of 1.08250 is already a “mirror” support. The technical pattern signals a further recovery of the single currency. Today, senior eurozone officials should hold a videoconference to agree on economic measures in the context of the COVID-19 epidemic. Positions should be opened from key support and resistance levels.

The publication of important economic releases is not expected.

EUR/USD

Indicators do not give accurate signals: the price has fixed between 50 MA and 100 MA.

The MACD histogram has started to rise, indicating the development of bullish sentiment.

Stochastic Oscillator is in the overbought zone, the %K line has crossed the %D line. There are no signals at the moment.

Trading recommendations
  • Support levels: 1.08250, 1.07750
  • Resistance levels: 1.08800, 1.09200, 1.09700

If the price fixes above 1.08800, further growth of the EUR/USD currency pair is expected. The movement is tending to 1.09200-1.09500.

An alternative could be a drop in the EUR/USD quotes to 1.07900-1.07700.

The GBP/USD currency pair

Technical indicators of the currency pair:
  • Prev Open: 1.22341
  • Open: 1.22303
  • % chg. over the last day: +0.10
  • Day’s range: 1.21643 – 1.23472
  • 52 wk range: 1.1466 – 1.3516

There is an ambiguous technical pattern on the GBP/USD currency pair. The British pound is being traded in a flat. Financial market participants expect additional drivers. At the moment, the local support and resistance levels are 1.22500 and 1.23450, respectively. British Prime Minister Boris Johnson has been moved to intensive care unit after his COVID-19 symptoms worsened. We recommend opening positions from key levels.

The news feed on the UK economy is quite calm.

GBP/USD

Indicators do not give accurate signals: the price has crossed 50 MA and 100 MA.

The MACD histogram is near the 0 mark.

Stochastic Oscillator is in the overbought zone, the %K line has crossed the %D line. There are no signals at the moment.

Trading recommendations
  • Support levels: 1.22500, 1.21650, 1.20500
  • Resistance levels: 1.23450, 1.24250, 1.24800

If the price fixes below 1.22500, GBP/USD is expected to fall. The movement is tending to 1.21700-1.21200.

An alternative could be the growth of the GBP/USD currency pair to 1.24250-1.24800.

The USD/CAD currency pair

Technical indicators of the currency pair:
  • Prev Open: 1.42242
  • Open: 1.41104
  • % chg. over the last day: -1.01
  • Day’s range: 1.40123 – 1.41432
  • 52 wk range: 1.2949 – 1.4668

The USD/CAD currency pair has been declining after a prolonged consolidation. The trading instrument has updated local lows. At the moment, USD/CAD quotes are testing support of 1.40100. The 1.41000 round level is already a “mirror” resistance. The recovery of oil quotes supports the loonie. The Canadian dollar has the potential to further strengthen against the greenback. Positions should be opened from key levels.

At 17:00 (GMT+3:00), Ivey PMI will be published in Canada.

USD/CAD

Indicators do not give accurate signals: 50 MA has crossed 100 MA.

The MACD histogram is in the negative zone and below the signal line, which gives a strong signal to sell USD/CAD.

Stochastic Oscillator is in the oversold zone, the %K line has crossed the %D line. There are no signals at the moment.

Trading recommendations
  • Support levels: 1.40100, 1.39250
  • Resistance levels: 1.41000, 1.41750, 1.42600

If the price fixes below 1.40100, a further drop in the USD/CAD quotes is expected. The movement is tending to 1.39500-1.39000.

An alternative could be the growth of the USD/CAD currency pair to 1.41500-1.42000.

The USD/JPY currency pair

Technical indicators of the currency pair:
  • Prev Open: 108.350
  • Open: 109.216
  • % chg. over the last day: +0.46
  • Day’s range: 108.672 – 109.280
  • 52 wk range: 101.19 – 112.41

The USD/JPY currency pair has become stable. The trading instrument is currently consolidating. There is no defined trend. USD/JPY quotes are testing local support and resistance levels: 108.700 and 109.300, respectively. Investors expect additional drivers. We recommend paying attention to the dynamics of US government bonds yield. Positions should be opened from key levels.

The news feed on Japan’s economy is calm enough.

USD/JPY

Indicators do not give accurate signals: the price has crossed 50 MA.

The MACD histogram is near the 0 mark.

Stochastic Oscillator is in the neutral zone, the %K line is above the %D line, which indicates the bullish sentiment.

Trading recommendations
  • Support levels: 108.700, 108.200, 107.600
  • Resistance levels: 109.300, 110.100

If the price fixes above 109.300, further growth of USD/JPY quotes is expected. The movement is tending to 110.000-110.200.

An alternative could be a decrease in the USD/JPY currency pair to 108.200-107.800.

by JustForex

Two Leading Indicators for Crude Oil Point To Higher Prices

By TheTechnicalTraders 

– On Friday morning I created these charts on the price of crude oil, the energy sector stocks (XLU), and also the Canadian Dollar, which I think paint a clear picture of what to expect for the price of crude this coming week.

I always like to look at the leading indicators of the asset which I am interested in trading. For those trading the price of crude oil you should be watching what the energy stocks are doing or the sector as a whole. I use XLE ETF for this. I also will show you the Canadian dollar and what it is going later in this post.

Energy stocks are a way for traders to leverage the move in oil so the smart/big money tends to move into these stocks before the underlying commodity (oil) will start to change direction.

Price of Crude Oil – Daily Chart

Oil has been trading sideways for a couple of weeks. The range may not look big but just note that it’s a roughly 25% range from the bottom to the top of the blue box. The key take-aways here is simple. Oil is still trading at the bottom of the chart and trading sideways. What we will be looking for is a breakout of this zone in either direction which should induce a strong rally or selloff to the expected price levels of $34, or $14. These moves are likely to happen quickly over a 2-3 day period to expect an explosive move.

Price of Energy Sector Stocks ETF (XLE) – Daily Chart

Energy stock generally leads to the price of oil by a few days. The important points on this chart are that price has rallied off the lows, and is forming a bull flag pattern which means higher prices are expected.

Much like crude, a break in either direction in XLE can be traded, but the pattern which has formed puts the odds in favor of an upside breakout and rally of roughly 12%.

Before we continue, be sure to opt-in to our free market trend signals 
before closing this page, so you don’t miss our next special report!

Price of Canadian Dollar – Daily Chart

The Canadian dollar is very tied to the energy sector, both the price of oil and energy stock because we are a resource-rich country, with oil being once of our top resources.

As you can see in the chart below the Canadian dollar it too has formed a bull flag pattern and looked primed and ready for another rally higher. The currency market, in general, is massive and when a large asset class is showing signs of reversing you better pay attention.

When I see a currency forming strong pattern to give us an expected price breakout direction, I like to look at what that is telling me. What companies or commodities will this move affect? In this case, money is moving into the Canadian dollar expecting oil to bottom and rally which should help increase the value even more.

I Talk Live On TV about These Trade Setups

If you want more details on this trade setup just watch this clip from TraderTV where I talked with Brendan Wickens in detail. Click Here To Watch Video

Concluding Thoughts:

In short, this coming week is most likely going to be much wilder than last week. While I didn’t cover on the other asset classes just know that precious metals, the major stock indexes, bonds, and oil have al built powerful patterns. Breakouts of these patterns will trigger big moves 10-25% in some cases, so get ready for fireworks this week!

As a technical analyst and trader since 1997, I have been through a few bull/bear market cycles. I believe I have a good pulse on the market and timing key turning points for short-term swing traders.

I hope you found this informative, and if you would like to get a pre-market video every day before the opening bell, along with my trade alerts visit my Active ETF Trading Newsletter.

We all have trading accounts, and while our trading accounts are important, what is even more important are our long-term investment and retirement accounts. Why? Because they are, in most cases, our largest store of wealth other than our homes, and if they are not protected during a time like this, you could lose 25-50% or more of your entire net worth. The good news is we can preserve and even grow our long term capital when things get ugly like they are now and ill show you how and one of the best trades is one your financial advisor will never let you do because they do not make money from the trade/position.

If you have any type of retirement account and are looking for signals when to own equities, bonds, or cash, be sure to become a member of my Long-Term Investing Signals which we issued a new signal for subscribers.

Ride my coattails as I navigate these financial markets and build wealth while others lose nearly everything they own during the next financial crisis.

Chris Vermeulen
Chief Market Strategies
TheTechnicalTraders.com

Fibonacci Retracements Analysis 06.04.2020 (GOLD, USDCHF)

Article By RoboForex.com

XAUUSD, “Gold vs US Dollar”

As we can see in the H4 chart, after completing a slight correction, XAUUSD is trying to start a new rising impulse towards 76.0% fibo, which was tested earlier. If the pair fixes above this level, the price may reach the high at 1703.17 and break it. In this case, the instrument may trade to attack the long-term 76.0% fibo at 1708.85. The support remains at 1451.18.

GOLD_H4
Risk Warning: the result of previous trading operations do not guarantee the same results in the future

In the H1 chart, there was a local divergence, which made the pair start a new pullback, which has already reached 38.2% fibo. At the moment, the price is steadily trading towards the high at 1643.07. However, one shouldn’t exclude the possibility of a rebound. In this case, the instrument may start a new decline towards 50.0% fibo at 1549.10.

GOLD_H1
Risk Warning: the result of previous trading operations do not guarantee the same results in the future

USDCHF, “US Dollar vs Swiss Franc”

In the H4 chart, the descending wave has corrected the previous uptrend by 50.0%. Another ascending wave may be heading to break the high at 0.9901. If it succeeds, the instrument may continue growing towards 76.0% fibo at 0.9982 and then the high at 1.0236.

USDCHF_H4
Risk Warning: the result of previous trading operations do not guarantee the same results in the future

In the H1 chart, there is a local divergence within the uptrend, which indicates a slowdown in the price growth on its way towards 61.8% fibo. After reaching this level, the pair may start a new pullback.

USDCHF_H1

Article By RoboForex.com

Attention!
Forecasts presented in this section only reflect the author’s private opinion and should not be considered as guidance for trading. RoboForex LP bears no responsibility for trading results based on trading recommendations described in these analytical reviews.

Forex Technical Analysis & Forecast 06.04.2020

Article By RoboForex.com

EURUSD, “Euro vs US Dollar”

After completing another descending structure at 1.0773, EURUSD is expected to resume growing towards 1.0846 and the fall to reach 1.0830, thus forming a new consolidation range between these two levels. If later the price breaks this range to the upside, the market may continue forming the ascending wave towards 1.0930; if to the downside – resume moving inside the downtrend with the target at 1.0752.

EURUSD
Risk Warning: the result of previous trading operations do not guarantee the same results in the future

GBPUSD, “Great Britain Pound vs US Dollar”

GBPUSD is forming the first descending wave with the target at 1.2160. After that, the instrument may form one more ascending structure towards 1.2315 and then resume moving inside the downtrend to reach the short-term target at 1.2050.

GBPUSD
Risk Warning: the result of previous trading operations do not guarantee the same results in the future

USDCHF, “US Dollar vs Swiss Franc”

USDCHF is consolidating around 0.9766. Today, the pair may expand the range down to 0.9737. Later, the market may return to 0.9766 and then form a new descending structure with the target at 0.9696.

USDCHF
Risk Warning: the result of previous trading operations do not guarantee the same results in the future

USDJPY, “US Dollar vs Japanese Yen”

USDJPY continues trading upwards. The main scenario implies that today the price may reach 109.24 and then form a new descending structure towards 108.20. Later, the market may start another growth to reach 109.40 and then resume moving downwards with the target at 105.80.

USDJPY
Risk Warning: the result of previous trading operations do not guarantee the same results in the future

AUDUSD, “Australian Dollar vs US Dollar”

AUDUSD is forming a new descending structure with the short-term target at 0.5940. After that, the instrument may start another growth towards 0.6028 and then resume falling to reach 0.5822.

AUDUSD
Risk Warning: the result of previous trading operations do not guarantee the same results in the future

USDRUB, “US Dollar vs Russian Ruble”

USDRUB is forming a new descending structure towards 74.90. According to the main scenario, the price is expected to reach this level and then resume growing towards 77.20. Later, the market may resume trading downwards with the first target at 74.22.

USDRUB
Risk Warning: the result of previous trading operations do not guarantee the same results in the future

USDCAD, “US Dollar vs Canadian Dollar”

USDCAD is still consolidating below 1.4240. Today, the pair may trade downwards to break 1.4060 and then continue falling with the short-term target 1.3888.

USDCAD
Risk Warning: the result of previous trading operations do not guarantee the same results in the future

XAUUSD, “Gold vs US Dollar”

Gold is consolidating around 1614.80. Possibly, today the pair may fall to reach 1605.65 and then grow to return to 1614.80. If later the price breaks this range to the downside, the market may form a new descending structure towards 1586.59; if to the upside – trade upwards to extend the wave up to 1650.25 (an alternative scenario).

GOLD
Risk Warning: the result of previous trading operations do not guarantee the same results in the future

BRENT

Brent continues forming the ascending wave towards 35.86. After completing it, the instrument may correct to reach 30.80. If later the price breaks this level to the downside, the market may continue the correction towards 25.77.

BRENT
Risk Warning: the result of previous trading operations do not guarantee the same results in the future

BTCUSD, “Bitcoin vs US Dollar”

BTCUSD is still forming the ascending structure towards 7330.00, which may later be followed by another decline to reach 6600.00. After that, the instrument may resume growing towards 7600.00 and then start a new correction with the target at 5600.00.

BITCOIN

Article By RoboForex.com

Attention!
Forecasts presented in this section only reflect the author’s private opinion and should not be considered as guidance for trading. RoboForex LP bears no responsibility for trading results based on trading recommendations described in these analytical reviews.

Greenback Is in the Positive Zone Despite Weak US Labor Market Report

by JustForex

On Friday, the US dollar strengthened again relative to a basket of currency majors despite weak labor market data for March. The dollar index (#DX) closed in the green zone (+0.40%). The stock market fell sharply, but the dollar continued to gain momentum amid declining demand for risk. However, investors are still concerned about the possible worsening of the pandemic around the world and its impact on the global economy. Also, according to Trump, US will probably face two most difficult weeks. The US President warned that Americans should prepare for a significant spike in deaths from coronavirus. White House medical experts forecast that between 100,000 and 240,000 Americans may die during a pandemic, even if they strictly adhere to the quarantine.

The British pound began to decline after it became known that British Prime Minister Boris Johnson was hospitalized for examination due to persistent symptoms of COVID-19. The British Prime Minister was hospitalized on Sunday because he still has symptoms of coronavirus ten days after testing positive for the virus. Downing Street says he continues to lead the government. However, the UK Constitution does not provide for measures regarding who will take the lead if Johnson cannot continue to rule the country.

The “black gold” prices have been declining again. Currently, futures for the WTI crude oil are testing the $27.60 mark per barrel.

Market indicators

On Friday, there was the bearish sentiment in the US stock market: #SPY (-1.45%), #DIA (-1.57%), #QQQ (-1.42%).

The 10-year US government bonds yield increased slightly. At the moment, the indicator is at the level of 0.66-0.67%.

The news feed on 2020.04.06:
  • Today, the publication of important news is not expected.

by JustForex

The Analytical Overview of the Main Currency Pairs on 2020.04.06

by JustForex

The EUR/USD currency pair

Technical indicators of the currency pair:
  • Prev Open: 1.08554
  • Open: 1.08105
  • % chg. over the last day: -0.45
  • Day’s range: 1.07986 – 1.08355
  • 52 wk range: 1.0777 – 1.1494

The bearish sentiment prevails on the EUR/USD currency pair. On Friday, the US published a weak labor market report for March. The number of people employed in the nonfarm sector of the country fell sharply (701K). The unemployment rate increased from 3.5% to 4.4%. The labor force participation rate decreased from 63.4% to 62.7%. At the same time, the growth in average hourly earnings accelerated from 0.3% to 0.4%. Nevertheless, the demand for greenback is still high. Currently, the EUR/USD quotes are consolidating in the range of 1.07750-1.08350. Positions should be opened from these marks.

Today the news feed is calm.

EUR/USD

Indicators do not give accurate signals: the price is testing 50 MA.

The MACD histogram has approached the 0 mark.

Stochastic Oscillator is in the neutral zone, the %K line is below the %D line, which indicates the bearish sentiment.

Trading recommendations
  • Support levels: 1.07750, 1.07200
  • Resistance levels: 1.08350, 1.09000, 1.09700

If the price fixes below the support level of 1.07750, a further fall in the EUR/USD currency pair is expected. The movement is tending to 1.07200-1.07000.

An alternative could be the growth of EUR/USD quotes to a round level of 1.09000.

The GBP/USD currency pair

Technical indicators of the currency pair:
  • Prev Open: 1.23997
  • Open: 1.22341
  • % chg. over the last day: -1.07
  • Day’s range: 1.22096 – 1.23093
  • 52 wk range: 1.1466 – 1.3516

The GBP/USD currency pair has been declining after a prolonged consolidation. The British pound has updated local lows. The pound is under pressure due to weak releases on economic activity in the UK. It also became known that British Prime Minister Boris Johnson, infected with the COVID-19 virus, was hospitalized on Sunday for an examination. At the moment, GBP/USD quotes are consolidating in the range of 1.22100-1.23000. A trading instrument has the potential to further decline. Positions should be opened from key levels.

At 11:30 (GMT+3:00), UK construction PMI will be published.

GBP/USD

Indicators do not give accurate signals: the price has crossed 50 MA and 100 MA.

The MACD histogram is in the negative zone, but above the signal line, which gives a weak signal to sell GBP/USD.

Stochastic Oscillator is in the neutral zone, the %K line is above the %D line, which indicates the bullish sentiment.

Trading recommendations
  • Support levels: 1.22100, 1.21450, 1.20150
  • Resistance levels: 1.23000, 1.24000, 1.24800

If the price fixes below 1.22100, a further drop in GBP/USD quotes is expected. The movement is tending to 1.21000-1.20500.

An alternative could be the growth of the GBP/USD currency pair to 1.24000-1.24500.

The USD/CAD currency pair

Technical indicators of the currency pair:
  • Prev Open: 1.41358
  • Open: 1.42242
  • % chg. over the last day: +0.49
  • Day’s range: 1.40805 – 1.42613
  • 52 wk range: 1.2949 – 1.4668

The USD/CAD currency pair is still being traded in a protracted flat. There is no defined trend. Investors expect additional drivers. At the moment, the local support and resistance levels are 1.40800 and 1.42000, respectively. The Canadian dollar is supported by the “black gold” price recovery. USD/CAD quotes are tending to decline. Positions should be opened from key levels.

The news feed on Canada’s economy is calm.

USD/CAD

Indicators do not give accurate signals: 50 MA has crossed 100 MA.

The MACD histogram is near the 0 mark.

Stochastic Oscillator is located near the oversold zone, the %K line has crossed the %D line. There are no signals at the moment.

Trading recommendations
  • Support levels: 1.40800, 1.40100, 1.39250
  • Resistance levels: 1.42000, 1.42700, 1.43350

If the price fixes below 1.40800, USD/CAD quotes are expected to fall. The movement is tending to 1.40100-1.39500.

An alternative could be the growth of the USD/CAD currency pair to 1.42500-1.43000.

The USD/JPY currency pair

Technical indicators of the currency pair:
  • Prev Open: 107.886
  • Open: 108.350
  • % chg. over the last day: +0.13
  • Day’s range: 108.337 – 109.382
  • 52 wk range: 101.19 – 112.41

USD/JPY quotes show positive dynamics. The trading instrument has updated local highs again. At the moment, the “safe haven” currency is testing the resistance level of 109.400. The 108.700 mark is already a “mirror” support. Financial market participants continue to assess the impact of the COVID-19 epidemic on the global economy. We recommend paying attention to the dynamics of US government bonds yield. Positions should be opened from key levels.

The news feed on Japan’s economy is calm.

USD/JPY

Indicators signal the power of buyers: the price has fixed above 100 MA.

The MACD histogram is in the positive zone, which indicates an increase in the USD/JPY quotes.

Stochastic Oscillator is in the neutral zone, the %K line has crossed the %D line. There are no signals at the moment.

Trading recommendations
  • Support levels: 108.700, 108.200, 107.600
  • Resistance levels: 109.400, 110.100

If the price fixes above 109.400, further growth of USD/JPY quotes is expected. The movement is tending to 110.000-110.300.

An alternative could be a decrease in the USD/JPY currency pair to 108.200-107.800.

by JustForex

EUR/USD Stopped Falling

By Dmitriy Gurkovskiy, Chief Analyst at RoboForex

After a continuous decline, the major currency pair is reaching stability early in the new April week; it is trading at 1.0810.

The statistics published by the USA last Friday showed exactly what it was expected to. The Unemployment Rate went from 3.5% in February to 4.4% in March, which is worse than expected, 3.8%. The Non-Farm Employment Change dropped to -701K over the same period of time after being 275K and against the expected reading of -100K. The Average Hourly Earnings added 0.4% m/m in March after expanding by 0.3% m/m the month before.

Most likely, the March readings don’t seem to reveal all stress that the labor market is exposed to, that’s why the April report is expected to be more insightful. For example, the Morgan Stanley report was more pessimistic about the future outlook: they assume that the unemployment in the USA may skyrocket up to 15.7% in the second quarter 2020 and the entire labor market may lose about 20-21M jobs. Probably, this is the gloomiest scenario right now.

In the H4 chart, EUR/USD is growing towards 1.0847. Possibly, the pair may reach this level and then start a new correction towards 1.0800. After that, the uptrend may resume to break 1.0850 and then continue with the short-term target at 1.0900. From the technical point of view, this scenario is confirmed by MACD Oscillator: its signal line is moving outside the histogram area but still below 0. There is a possibility of a new decline towards 1.0725. However, if the line breaks 0 to the upside, the pair may boost its growth on the price chart to reach 1.0940.

As we can see in the H1 chart, after reaching the short-term target of the first rising wave and then correcting towards 1.0807, EUR/USD is expected to grow to reach 1.0847 (at least). Later, the market may form a new descending correction with the target at 1.0800. From the technical point of view, this scenario is confirmed by Stochastic Oscillator: its signal line is moving above 50 and may grow to reach 80 to complete the rising wave. Later, the line may fall to return to 50, thus resulting in a new correction on the price chart.

Disclaimer

Any predictions contained herein are based on the authors’ particular opinion. This analysis shall not be treated as trading advice. RoboForex shall not be held liable for the results of the trades arising from relying upon trading recommendations and reviews contained herein.