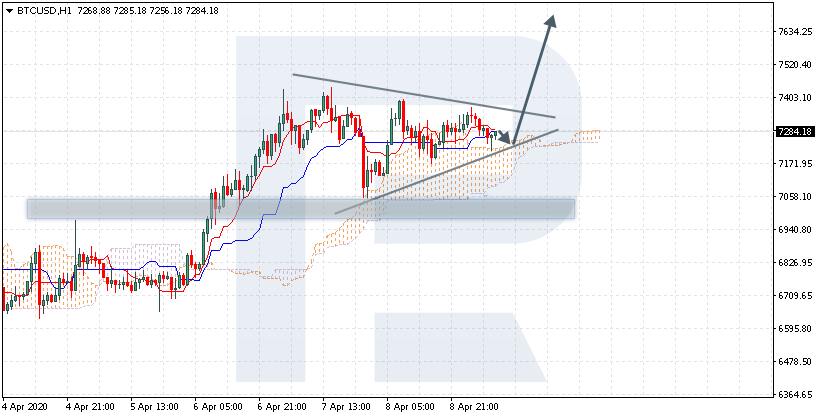
BTCUSD is trading at 7284.00; the instrument is moving above Ichimoku Cloud, thus indicating a bullish tendency. The markets could indicate that the price may test the cloud’s upside border at 7275.00 and then resume moving upwards to reach 7645.00. Another signal to confirm further ascending movement is the price’s rebounding from the Triangle’s downside border. However, the scenario that implies further growth may be canceled if the price breaks the cloud’s downside border and fixes below 7045.00. In this case, the pair may continue falling towards 6355.00. After breaking the pattern’s upside border and fixing above 7425.00, the price may resume moving upwards.
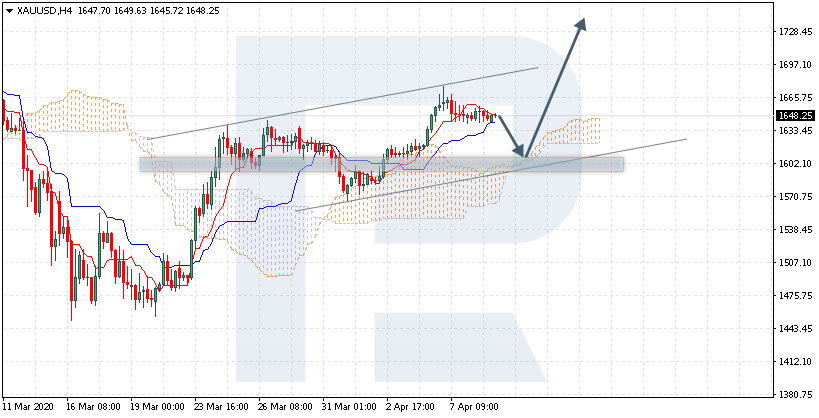
XAUUSD, “Gold vs US Dollar”
XAUUSD is trading at 1648.00; the instrument is moving above Ichimoku Cloud, thus indicating an ascending tendency. The markets could indicate that the price may test the cloud’s upside border at 1605.00 and then resume moving upwards to reach 1725.00. Another signal to confirm further ascending movement is the price’s rebounding from the rising channel’s downside border. However, the scenario that implies further growth may be canceled if the price breaks the cloud’s downside border and fixes below 1575.00. In this case, the pair may continue falling towards 1545.00.
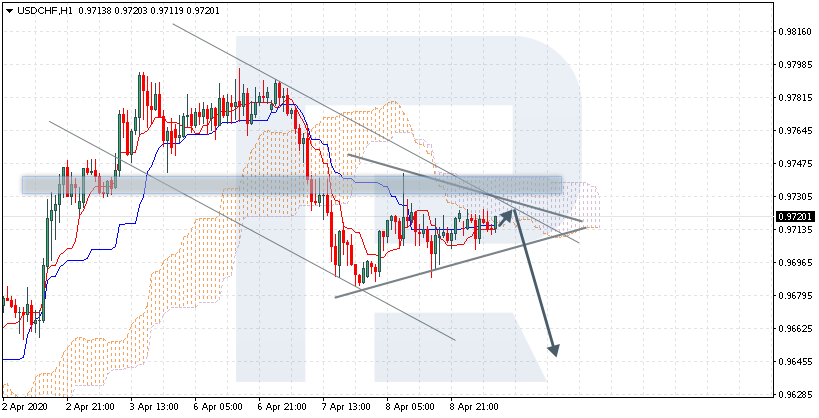
USDCHF, “US Dollar vs Swiss Franc”
USDCHF is trading at 0.9720; the instrument is moving below Ichimoku Cloud, thus indicating a descending tendency. The markets could indicate that the price may test the cloud’s downside border at 0.9730 and then resume moving downwards to reach 0.9645. Another signal to confirm further descending movement is the price’s rebounding from the descending channel’s upside border. However, the scenario that implies further decline may be canceled if the price breaks the cloud’s upside border and fixes above 0.9755. In this case, the pair may continue growing towards 0.9845. After breaking the Triangle’s downside border and fixing below 0.9690, the price may resume moving downwards.
Attention! Forecasts presented in this section only reflect the author’s private opinion and should not be considered as guidance for trading. RoboForex LP bears no responsibility for trading results based on trading recommendations described in these analytical reviews.
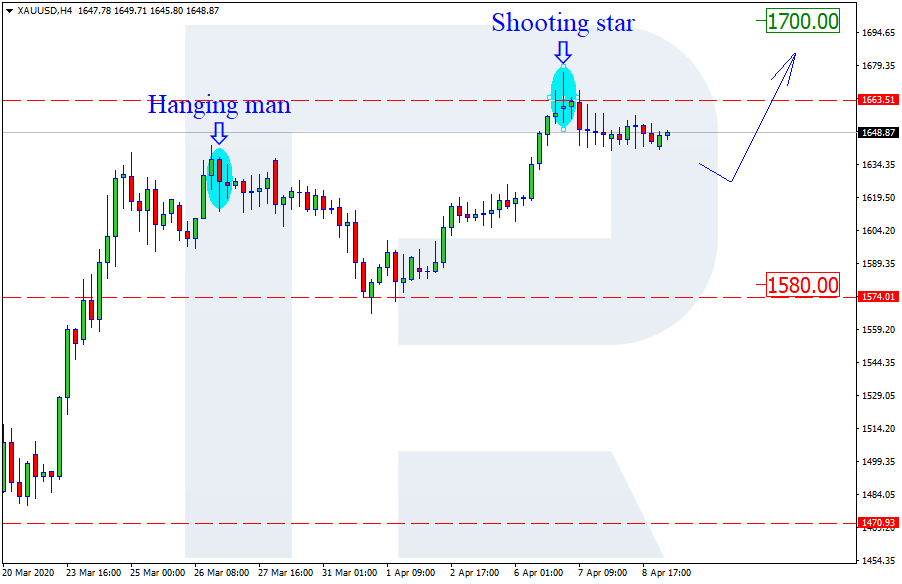
As we can see in the H4 chart, after testing another resistance level and forming several reversal patterns, such as Shooting Star, Gold is trading inside the horizontal channel and trying to reverse. The current situation implies that the pair may form a correction from the resistance level and then resume the rising tendency. In this case, the upside target may be at 1700.00. At the same time, there is another scenario, according to which the instrument may correct to reach the support level at 1580.00.
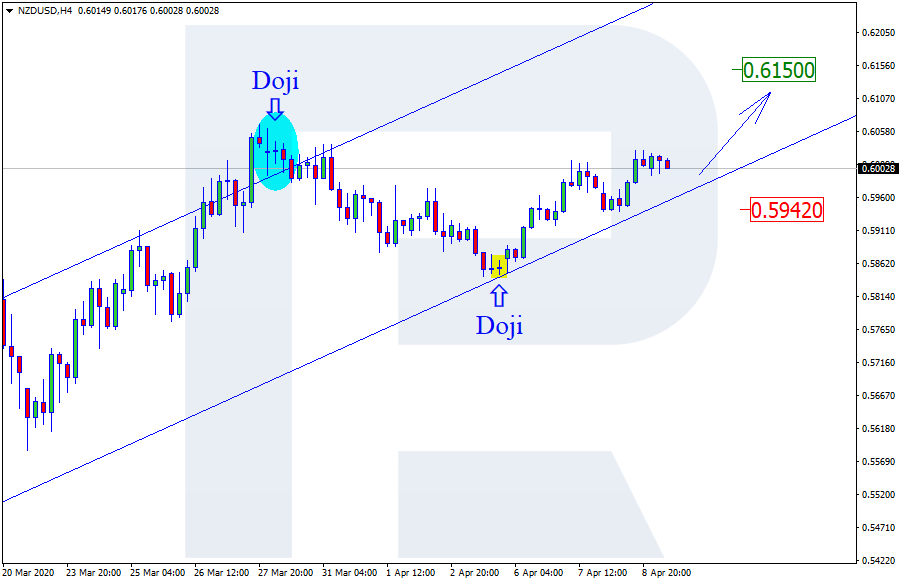
NZDUSD, “New Zealand vs. US Dollar”
As we can see in the H4 chart, the rising channel continues. After finishing a Doji reversal pattern, NZDUSD is reversing. Possibly, the pair complete the correction and resume trading upwards. The upside target may be at 0.6150. Still, one shouldn’t exclude another scenario, which says that the instrument may continue falling towards 0.5942.
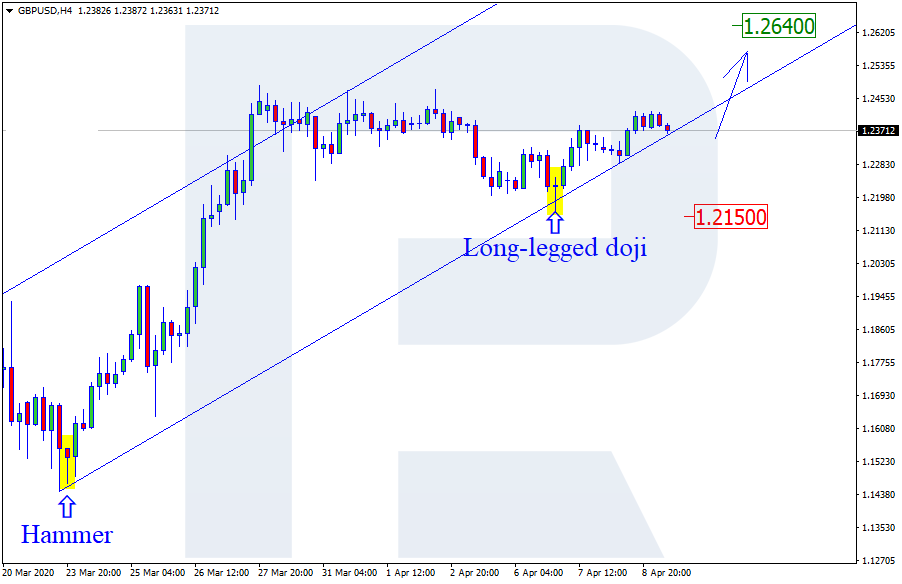
GBPUSD, “Great Britain Pound vs US Dollar”
As we can see in the H4 chart, the pair continues moving within the rising tendency. By now, GBPUSD has formed several reversal patterns, such as Long-Legged Doji, close to the support level. At the moment, the pair is reversing and may later resume growing with the target at 1.2640. However, there is another scenario, which implies that the instrument may fall and test 1.2150.
Attention! Forecasts presented in this section only reflect the author’s private opinion and should not be considered as guidance for trading. RoboForex LP bears no responsibility for trading results based on trading recommendations described in these analytical reviews.
The EUR/USD currency pair is consolidating. There is no defined trend. EUR/USD quotes are testing local support and resistance levels: 1.08250 and 1.08850, respectively. Financial market participants have taken a wait-and-see attitude before the publication of the ECB protocol. We recommend paying attention to the comments by representatives of the regulator. Investors will also assess important economic releases from the US. Positions should be opened from key support and resistance levels.
The Economic News Feed for 09.04.2020
– ECB monetary policy meeting account at 14:30 (GMT+3:00);
– Initial jobless claims in the US at 15:30 (GMT+3:00);
– US producer price index at 15:30 (GMT+3:00).
Indicators do not give accurate signals: the price has crossed 50 MA.
The MACD histogram is near the 0 mark.
Stochastic Oscillator is in the neutral zone, the %K line is above the %D line, which indicates the bullish sentiment.
Trading recommendations
Support levels: 1.08250, 1.07750
Resistance levels: 1.08850, 1.09250, 1.09700
If the price fixes above 1.08850, the EUR/USD currency pair is expected to grow. The movement is tending to 1.09250-1.09500.
An alternative could be a drop in the EUR/USD quotes to 1.07900-1.07700.
The GBP/USD currency pair
Technical indicators of the currency pair:
Prev Open: 1.23253
Open: 1.23753
% chg. over the last day: +0.39
Day’s range: 1.23608 – 1.24187
52 wk range: 1.1466 – 1.3516
The GBP/USD currency pair is in a sideways trend. There is no defined trend. At the moment, the local support and resistance levels are 1.23550 and 1.24250, respectively. The technical pattern signals a possible growth of the trading instrument. Today, investors will assess important statistics on the US economy. We recommend opening positions from key levels.
Great Britain published weak data on the country’s GDP. At the same time, UK manufacturing production grew by 0.5% and exceeded market expectations at 0.1%.
Indicators do not give accurate signals: 50 MA has crossed 100 MA.
The MACD histogram is in the positive zone, indicating the bullish sentiment.
Stochastic Oscillator is in the neutral zone, the %K line is above the %D line, which gives a signal to buy GBP/USD.
Trading recommendations
Support levels: 1.23550, 1.22900, 1.22150
Resistance levels: 1.24250, 1.24800
If the price fixes above 1.24250, GBP/USD quotes are expected to grow. The movement is tending to 1.24700-1.25000.
An alternative could be a decrease in the GBP/USD currency pair to a round level of 1.23000.
The USD/CAD currency pair
Technical indicators of the currency pair:
Prev Open: 1.39921
Open: 1.40137
% chg. over the last day: +0.14
Day’s range: 1.40002 – 1.40549
52 wk range: 1.2949 – 1.4668
At the moment, USD/CAD quotes are consolidating. The technical pattern is ambiguous. The local support and resistance levels are 1.40000 and 1.40800, respectively. Recovery of the “black gold” prices supports the loonie. We do not rule out the strengthening of the Canadian dollar relative to the greenback. Investors expect a report on Canada’s labor market. Positions should be opened from key levels.
At 15:30 (GMT+3:00), data on the labor market of Canada will be published.
Indicators do not give accurate signals: the price has crossed 50 MA.
The MACD histogram is near the 0 mark.
Stochastic Oscillator is in the neutral zone, the %K line has crossed the %D line. There are no signals at the moment.
Trading recommendations
Support levels: 1.40000, 1.39450
Resistance levels: 1.40800, 1.41750, 1.42600
If the price fixes below the round level of 1.40000, a further drop in the USD/CAD quotes is expected. The movement is tending to 1.39500-1.39200.
An alternative could be the growth of the USD/CAD currency pair to 1.41300-1.41600.
The USD/JPY currency pair
Technical indicators of the currency pair:
Prev Open: 108.744
Open: 108.824
% chg. over the last day: +0.11
Day’s range: 108.768 – 109.063
52 wk range: 101.19 – 112.41
The USD/JPY currency pair is still being traded in a flat. There is no defined trend. USD/JPY quotes are testing the key support and resistance levels: 108.550 and 109.000, respectively. US economic releases are in the focus of attention. We also recommend paying attention to the dynamics of the US government bonds yield. Positions should be opened from key levels.
The news feed on Japan’s economy is calm.
Indicators do not give accurate signals: the price has crossed 50 MA.
The MACD histogram is near the 0 mark.
Stochastic Oscillator is in the neutral zone, the %K line is below the %D line, which indicates the bearish sentiment.
Trading recommendations
Support levels: 108.550, 108.150, 107.600
Resistance levels: 109.000, 109.350, 110.100
If the price fixes above 109,000, further growth of USD/JPY quotes is expected. The movement is tending to 109.400-109.800.
An alternative could be a decrease in the USD/JPY currency pair to 108.200-107.800.
– Our Adaptive Fibonacci Price Modeling system suggests a much deeper price move is in the works and the current price rally will likely end near resistance levels identified by the Adaptive Fibonacci Price Modeling system. We are posting this research post for friends and followers to help them understand the true structure of price and to allow them to prepare for what we believe will become a much deeper downside price move in the future.
Fibonacci Price Theory teaches us that price moves in waves within up and down price cycles. The recent peak in price, near February 25, 2020, has resulted in a very deep -36% price collapse in the S&P 500 (ES) recently. This downside move has been mostly straight down, excluding a brief retracement in early March. The strength of this downside price move suggests a moderate upside price recovery will take place before the next downside leg sets up.
Before we continue, be sure to opt-in to our free market trend signals before closing this page, so you don’t miss our next special report!
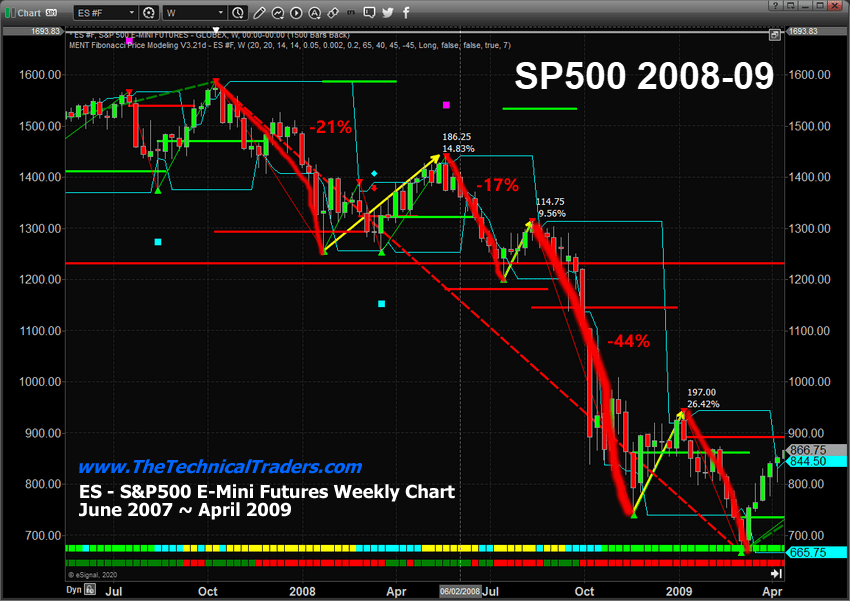
S&P 500 Weekly Chart of 2008-09 Credit Crisis Market Collapse
Throughout the 2008-09 Credit Crisis market collapse, prices staged multiple recovery attempts within the downward price trend. The first, after the initial -20.88% selloff in late 2007, resulted in a +14.83% price recovery that lasted for over 15+ weeks. The second recovery, near the end of July 2008, resulted in a +9.56% recovery after a nearly -17% price decline. After this brief recovery in July 2008, the price collapsed by a massive -44% from August to November 2008.
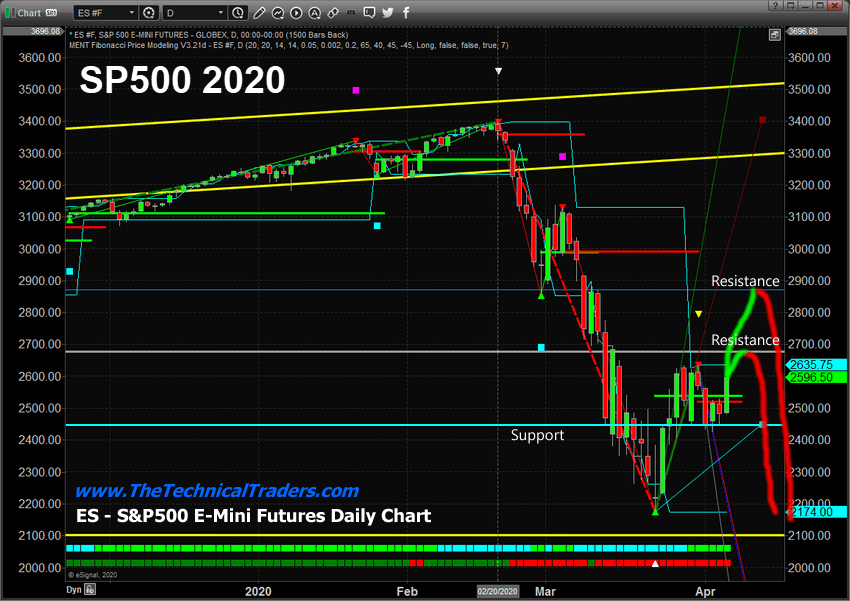
Daily S&P 500 Chart
This Daily ES chart highlights the first two levels of resistance at 2700 & 2870 that could stall the rally and prompt a downside price move in the future. Support is currently at 2450. We believe the 2700 level will act as a soft ceiling in the ES where price may attempt to rally, briefly, above this level, which it did yesterday, then pull back and pause as selling pressure re-enters the market. The 2870 level may act as a hard ceiling where price may attempt to reach this level, but immediately reverse back to the downside.
Overall, we believe continued selling as a result of forward global economic expectations is the most obvious outcome where a deeper price bottom will setup sometime later this spring or early summer.
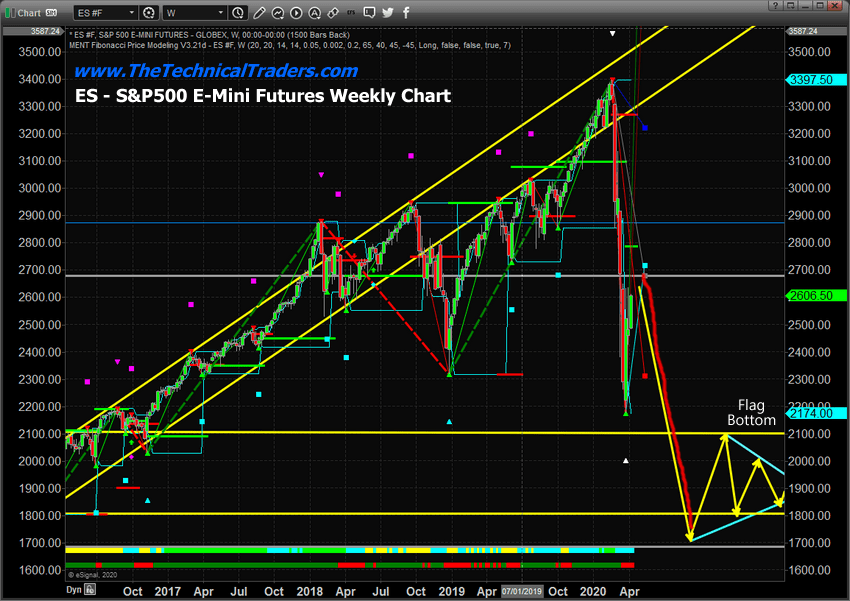
Weekly S&P 500 Chart
This Weekly S&P 500 chart (ES) shows a possible outcome for price going forward if another downside move starts. A new downside price move to levels near to, or just below, the 2015~16 low price range is not unreasonable. From this level, we believe a “Flag” formation will setup creating an extended price bottom pattern down at those extreme lows. We believe this “Flag” formation will end near August~October 2020, just before the 2020 elections and prompt the beginning of a new upside price recovery in the US and global markets.
This is a large forward-looking projection and you may be rolling your eyes, but they are very possible. In fact, last year we predicted the months and price levels in which gold and oil would start new major trends, and we did this 8 months before they took place, similar to what we are proposing here.
Concluding Thoughts:
The rotation in price setup by this brief upside price move will set up a new Fibonacci downside and upside price target range. We believe it is essential for price to continue this type of rotation as the eventual bottom sets up in the US and global markets. We believe the true price bottom will happen only after the virus event has subsided and global economies begin to start functioning like normal again.
Currently, there is simply too much of a world-wide disruption to expect that the bottom has already set up near last year’s (2019) brief price lows. The scale and scope of the current downside price collapse do not properly reflect the total scope of this global virus event yet – it is still a reactionary move in price that has yet to properly digest the total scope of the global economic disruptions. There is a chance for stronger bounce/rally in the next few weeks/months if the virus can start to be contained, and that will continue to mimic that of the 2000 tech bubble. Believe it or not, there is a big similarity to what happened then, to what is happening now in terms of price action and market sentiment. Read article and see these charts.
In other words, we believe more selling will be seen in the global markets and more economic contraction will take place until we are safely beyond this virus event. The longer the global economic shutdown continues, the more likely we are to see a deeper price bottom in the future and the more likely we are to see more extensive economic collateral damage across the world. No matter which way the markets move we will follow and trade the price action and profit. That is the benefit of following price vs trying to trade prediction, fundamental data etc..
In Part II of this research article, we’ll dig deeper into the underlying components that support our research.
As a technical analyst and trader since 1997, I have been through a few bull/bear market cycles in stocks and commodities. I believe I have a good pulse on the market and timing key turning points for investing and short-term swing traders.
I hope you found this informative, and if you would like to get a pre-market video every day before the opening bell, along with my trade alerts visit my Active ETF Trading Newsletter.
We all have trading accounts, and while our trading accounts are important, what is even more important are our long-term investment and retirement accounts. Why? Because they are, in most cases, our largest store of wealth other than our homes, and if they are not protected during a time like this, you could lose 25-50% or more of your entire net worth. The good news is we can preserve and even grow our long term capital when things get ugly like they are now and ill show you how and one of the best trades is one your financial advisor will never let you do because they do not make money from the trade/position.
If you have any type of retirement account and are looking for signals when to own equities, bonds, or cash, be sure to become a member of my Long-Term Investing Signals which we issued a new signal for subscribers.
Ride my coattails as I navigate these financial markets and build wealth while others lose nearly everything they own during the next financial crisis.
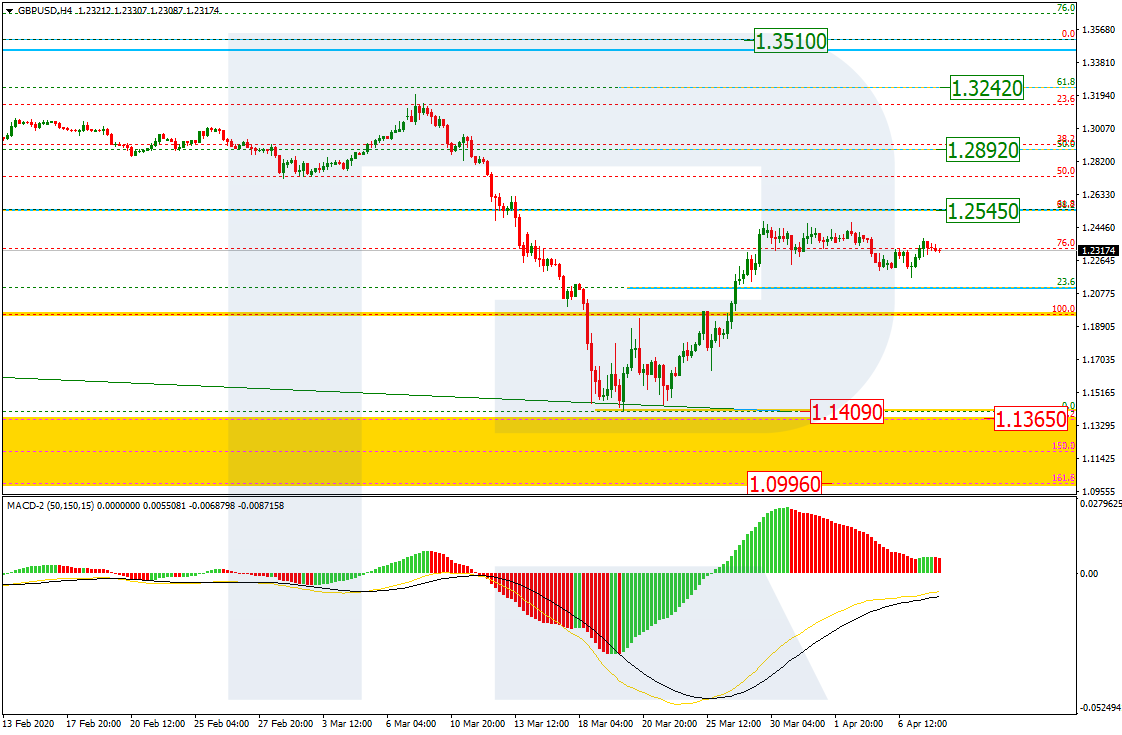
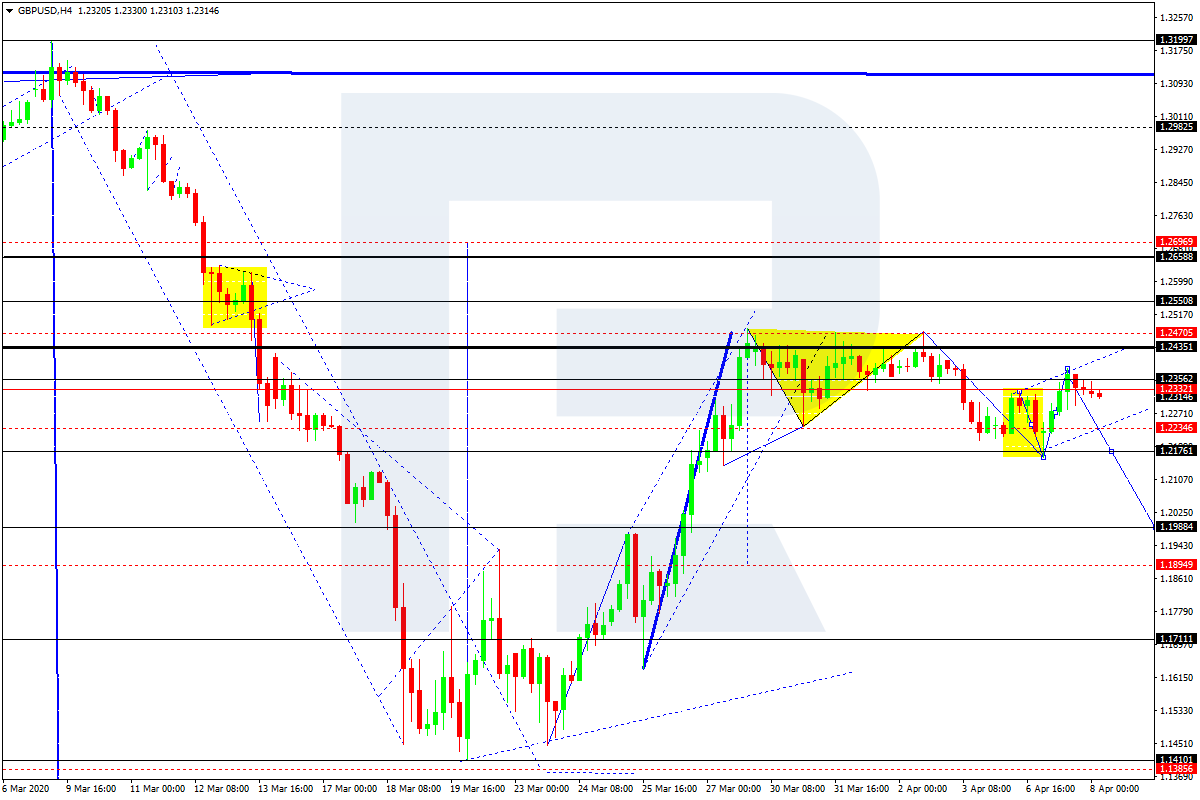
As we can see in the H4 chart, GBPUSD is forming a new rising tendency as a reversal of the previous downtrend. After breaking 23.6% fibo, the first ascending impulse has stopped at 38.2% fibo at 1.2545. The short-term scenario may be described as a correction of the first impulse. After finishing the correction, the pair may start another impulse to the upside to reach 38.2%, 50.0%, and 61.8% fibo at 1.2545, 1.2892, and 1.3242 respectively. If the price breaks the low at 1.1409, the instrument may continue falling towards the post-correctional extension area between 138.2% and 161.8% fibo at 1.1365 and 1.0996 respectively.
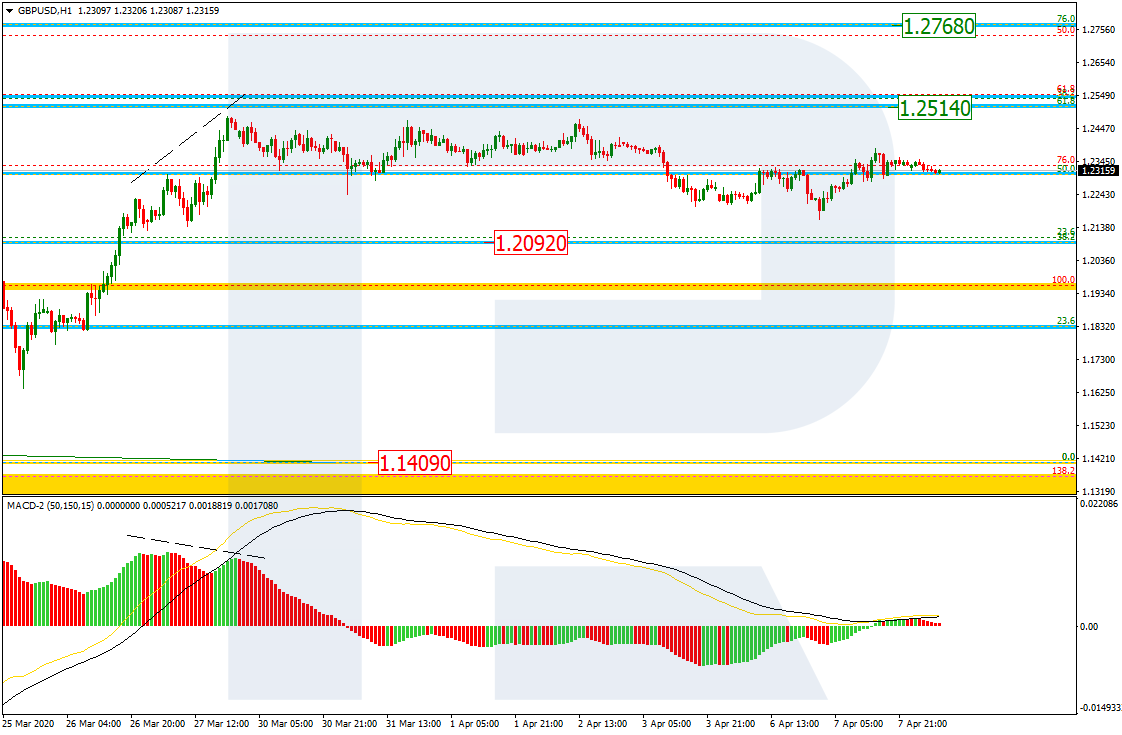
The H1 chart shows a more detailed structure of the current correction. The target of this pullback is 38.2% fibo (1.2092).
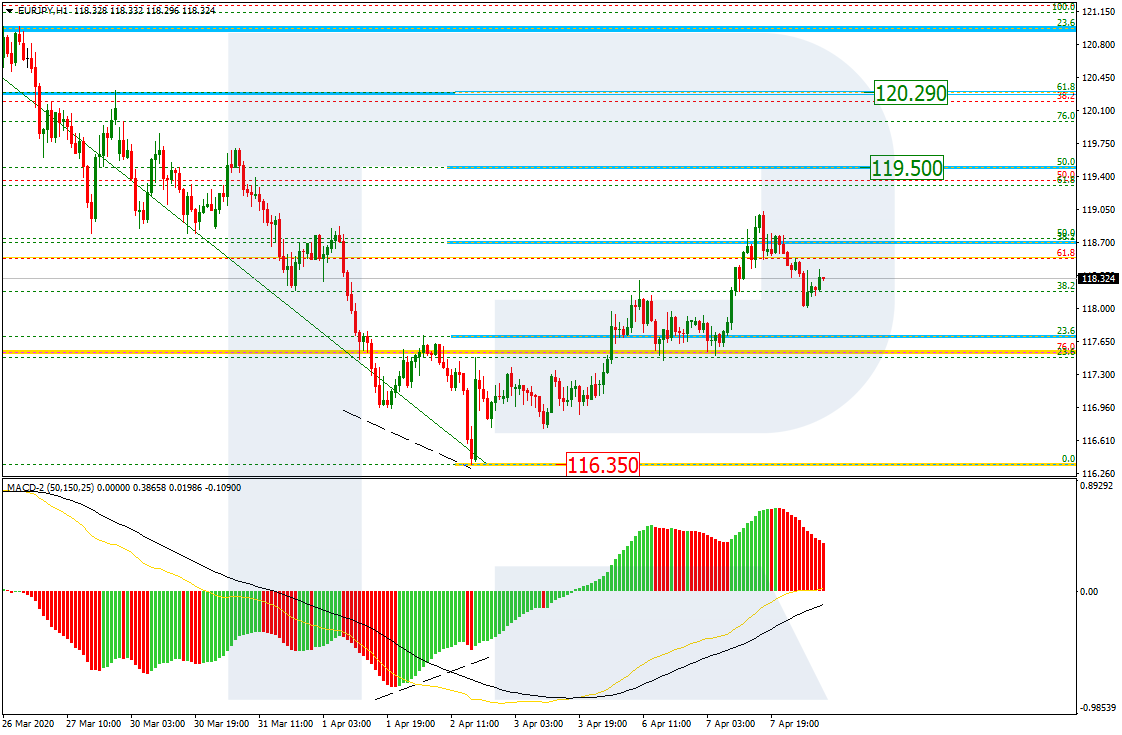
EURJPY, “Euro vs. Japanese Yen”
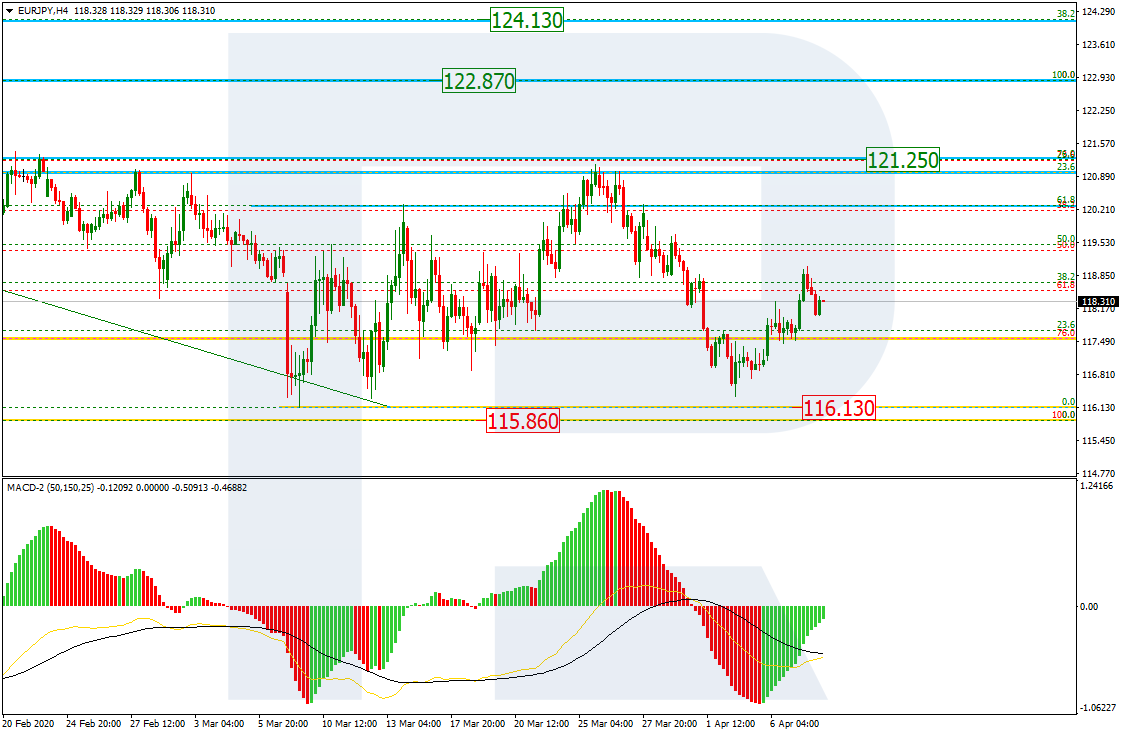
As we can see in the H4 chart, after failing to break the local low at 116.13 and then falling towards 115.85, EURJPY may start a new growth or even a long-term ascending wave. The first signal of the new long-term tendency may be the price’s reaching 76.0% fibo at 121.25 and then breaking the high at 122.87. After breaking this level and forming a slight pullback, the instrument may resume growing to reach its long-term target at 38.2% fibo (124.13).
The H1 chart a more detailed structure of the current uptrend. The pair has already reached 38.2% fibo and may continue growing towards 50.0% and 61.8% fibo at 119.50 and 120.29 respectively. The support is the low at 116.35.
Attention! Forecasts presented in this section only reflect the author’s private opinion and should not be considered as guidance for trading. RoboForex LP bears no responsibility for trading results based on trading recommendations described in these analytical reviews.
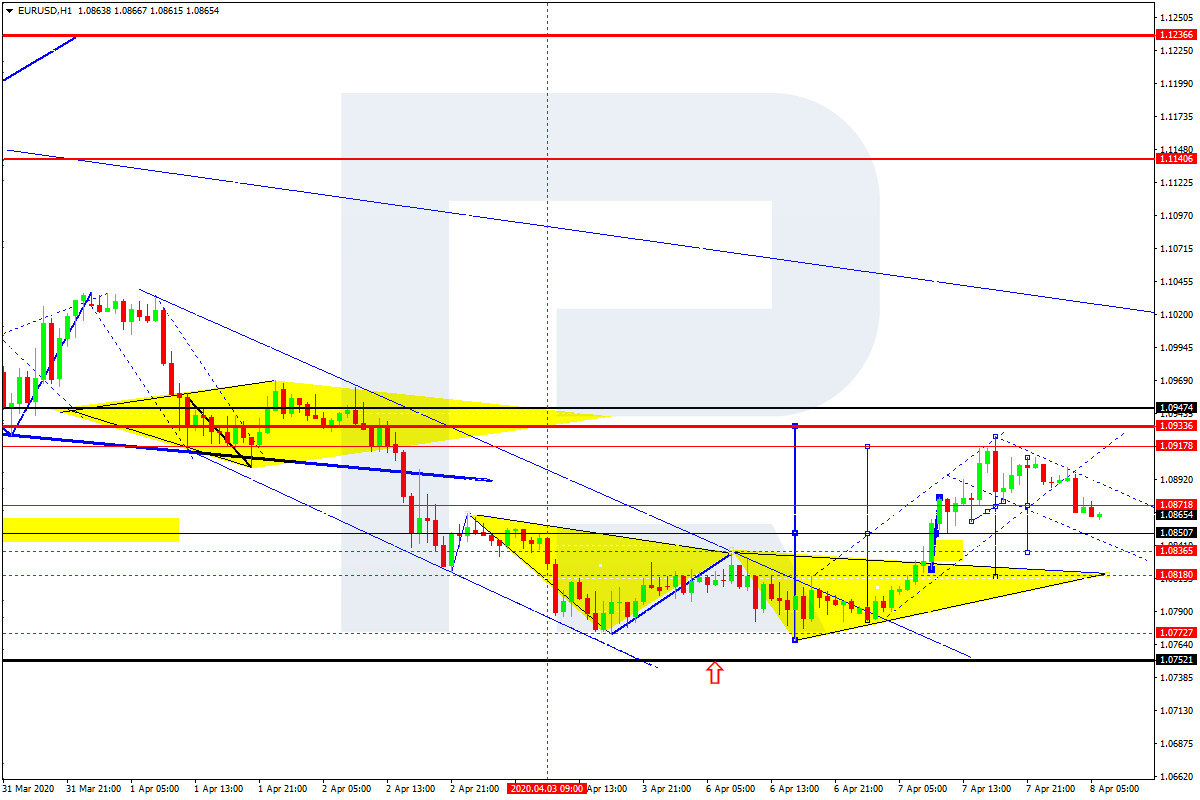
After breaking 1.0836 and then reaching 1.0926, EURUSD is trading downwards to1.0836. After that, the instrument may form one more ascending structure towards 1.0870 and then resume moving inside the downtrend with the target at 1.0820.
GBPUSD, “Great Britain Pound vs US Dollar”
GBPUSD has finished the correctional structure at 1.2356; right now, it is forming another descending wave to reach 1.2176. Possibly, the pair may break this level to the downside and then continue moving inside the downtrend with the short-term target at 1.1988.
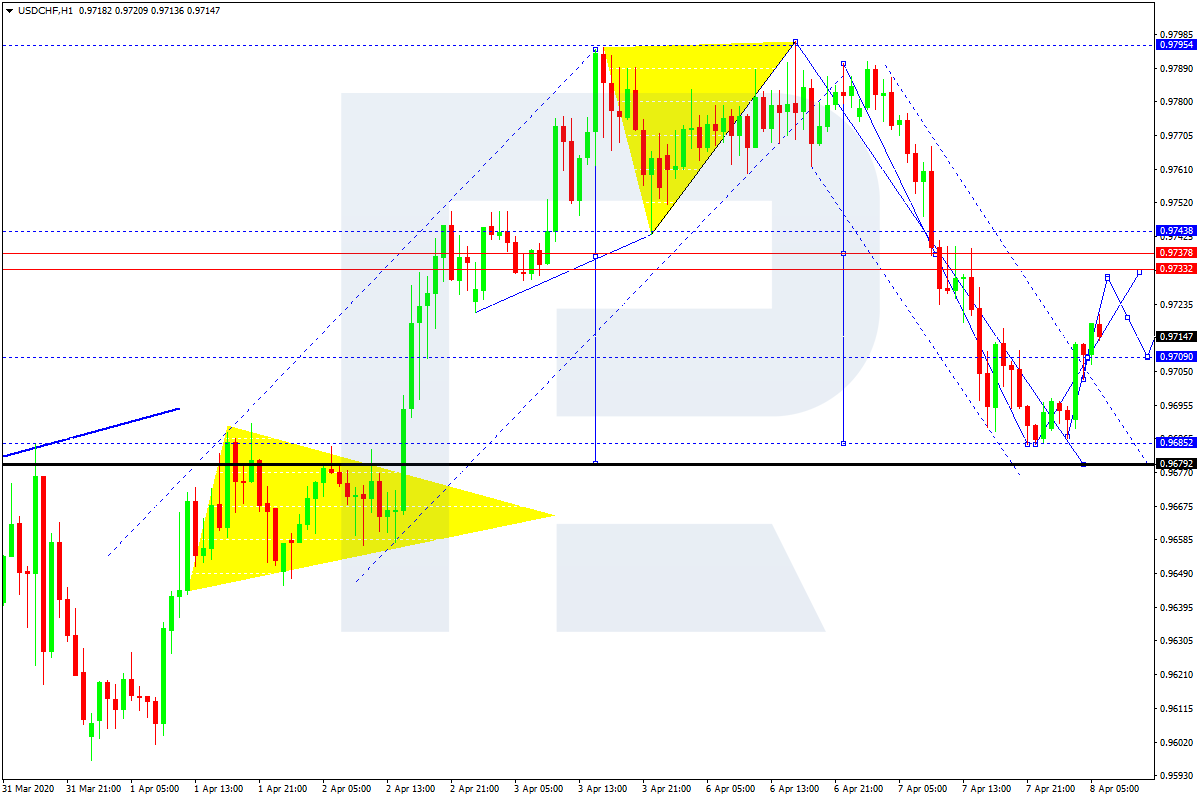
USDCHF, “US Dollar vs Swiss Franc”
After completing the descending wave at 0.9685, USDCHF is correcting towards 0.9733. Today, the pair may reach this level and then form a new descending structure with the target at 0.9679.
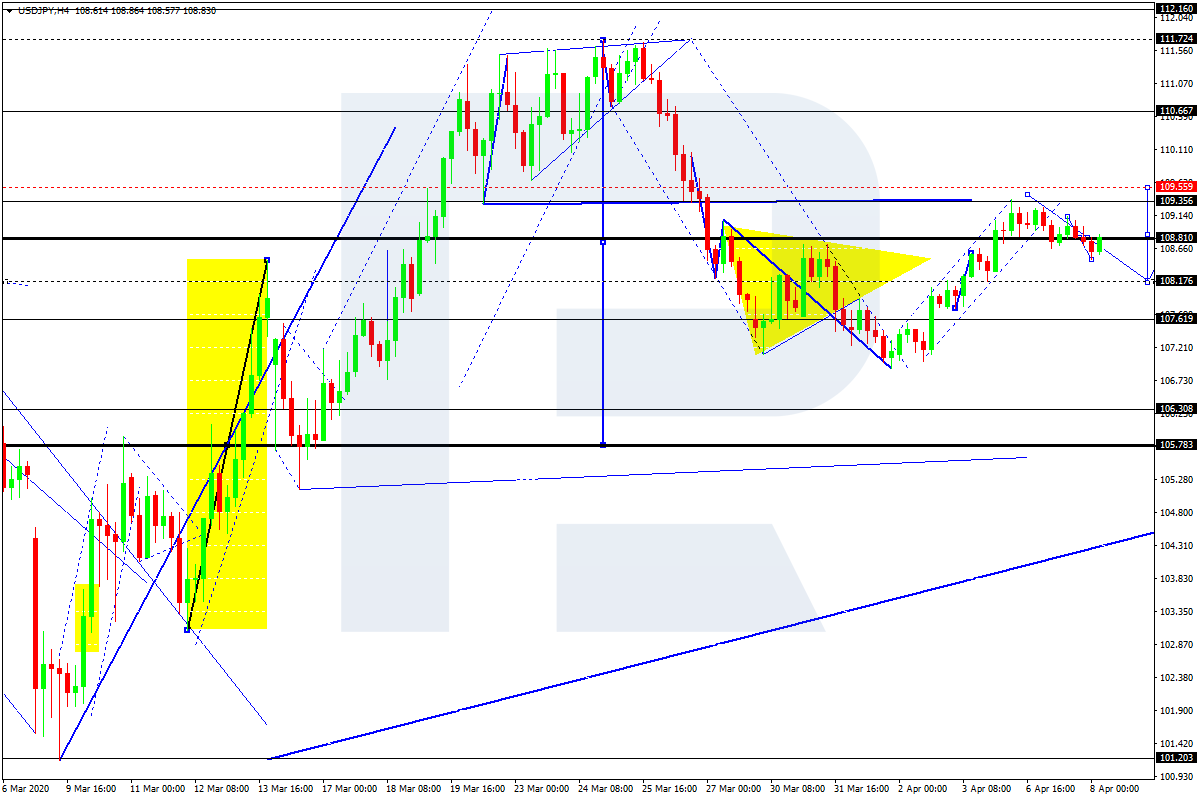
USDJPY, “US Dollar vs Japanese Yen”
After finishing the structure of the first descending impulse at 108.44, USDJPY has returned to 108.95, thus forming a new consolidation range between these two levels. If later the price breaks this range to the upside, the market may form one more ascending structure towards 109.55; if to the downside – resume moving downwards with the target at 107.62.
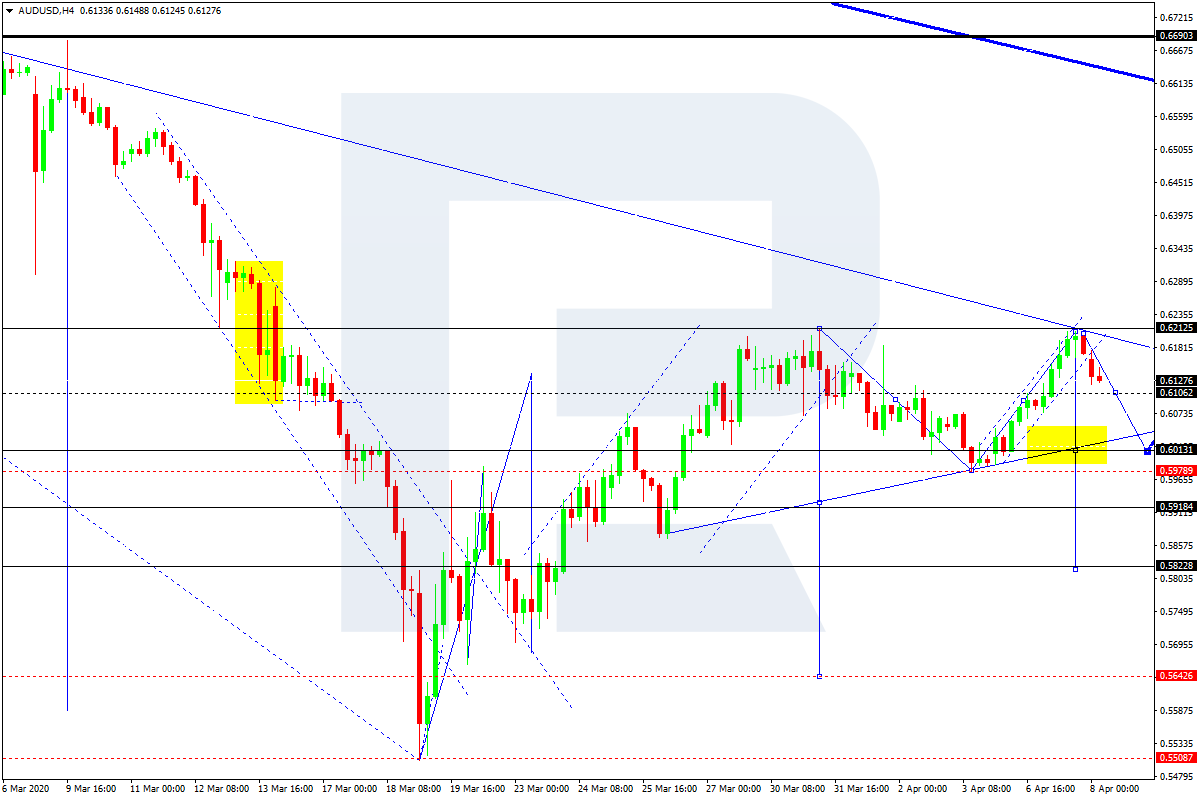
AUDUSD, “Australian Dollar vs US Dollar”
AUDUSD is consolidating around 0.6106. Possibly, the pair may expand the range up to 0.6220 and then fall towards its downside border at 0.5920. After that, the instrument may break this level and start another correction with the target at 0.5822.
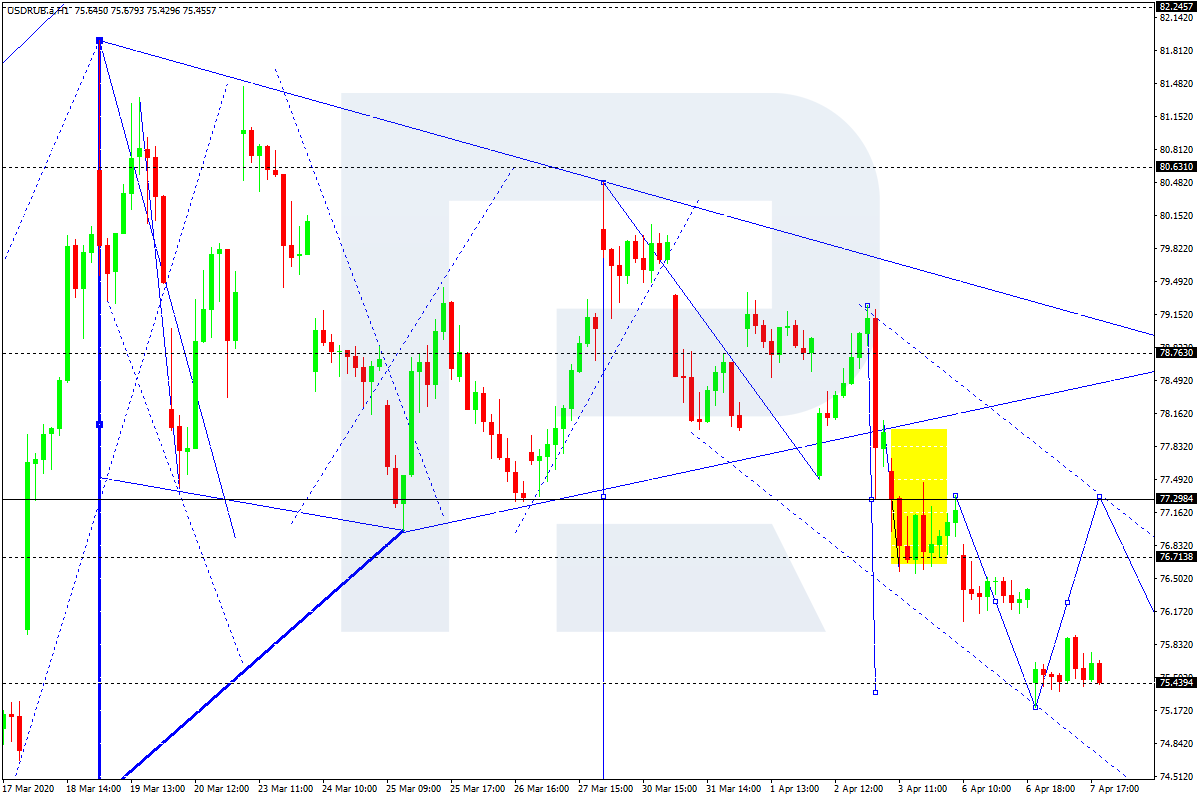
USDRUB, “US Dollar vs Russian Ruble”
USDRUB has finished the descending structure at 75.44. According to the main scenario, the price is expected to correct towards 77.30. Later, the market may resume trading downwards with the short-term target at 74.22.
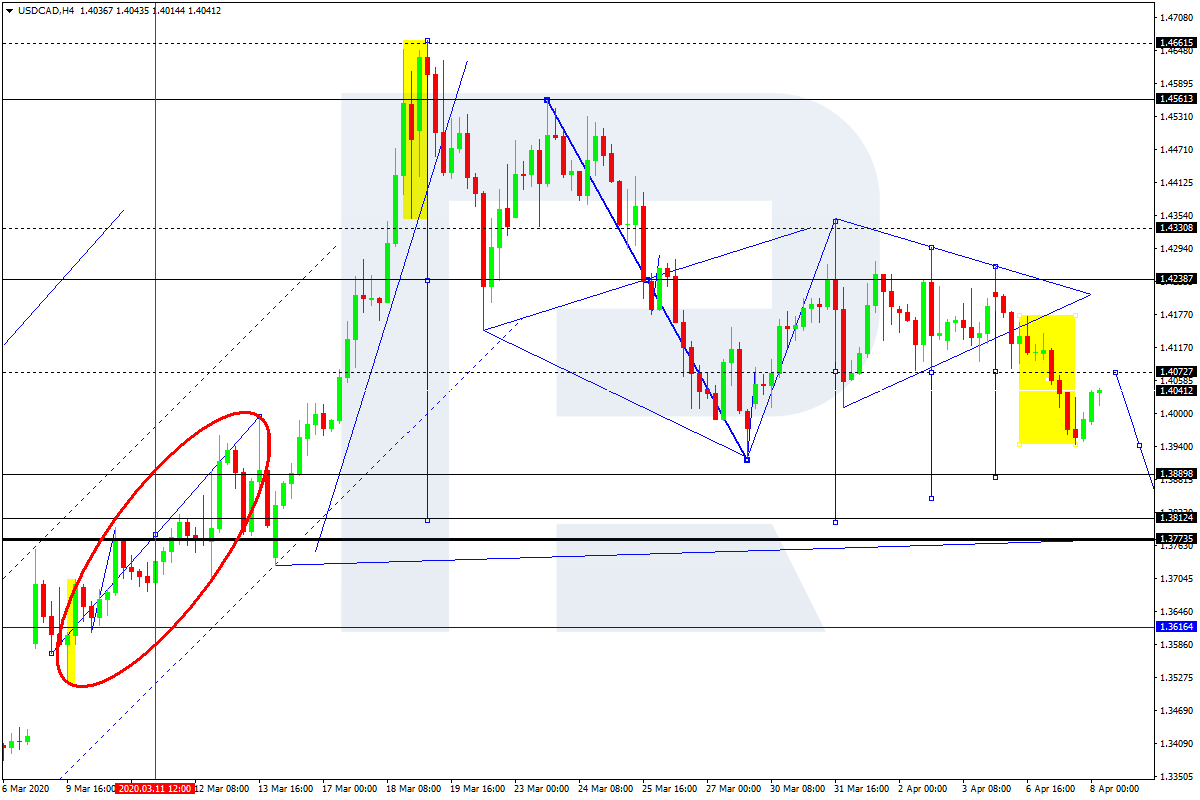
USDCAD, “US Dollar vs Canadian Dollar”
USDCAD continues forming the fifth descending wave; after breaking 1.4060, it has reached 1.3944. Possibly, today the pair may test the broken level from below and then resume trading downwards with the short-term target at 1.3888. The key target is at 1.3812.
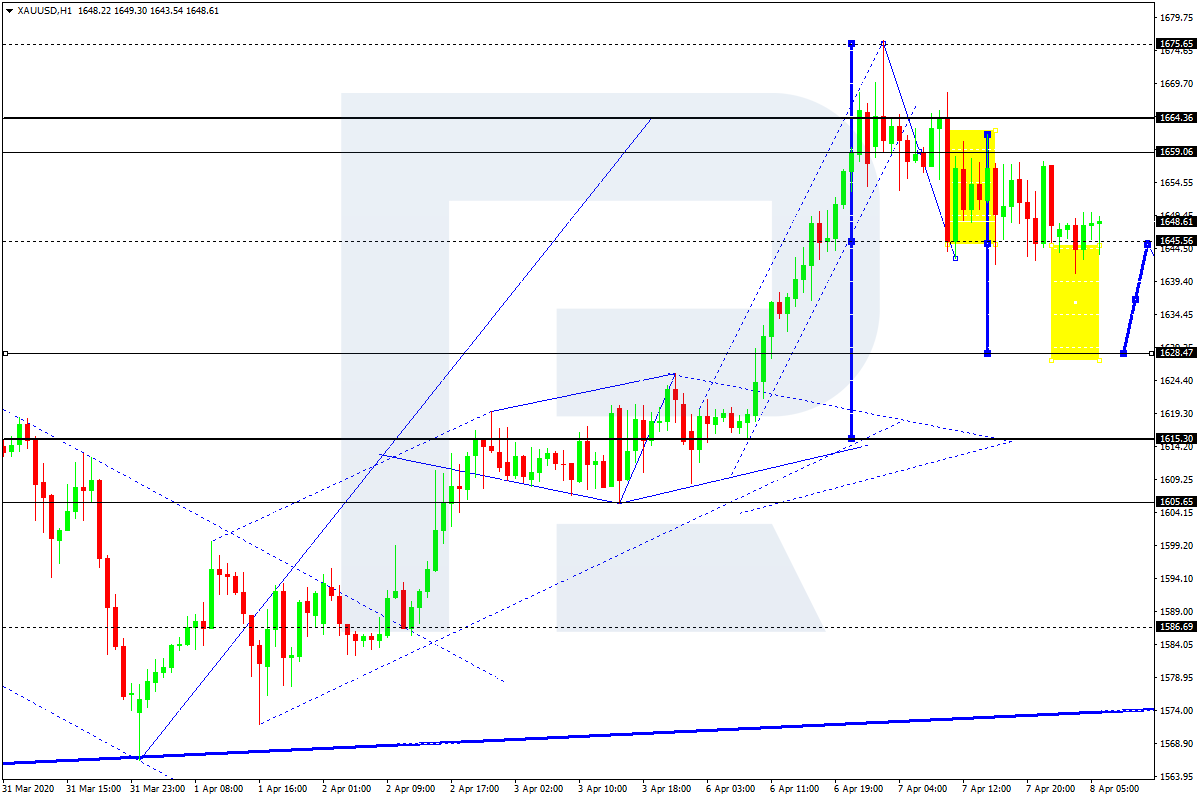
XAUUSD, “Gold vs US Dollar”
Gold continues forming the descending wave towards 1635.77. Possibly, the pair may reach this level and then grow towards 1655.55. Later, the market may resume trading inside the downtrend to continue the correction with the short-term target at 1628.47. The key target is at 1615.30.
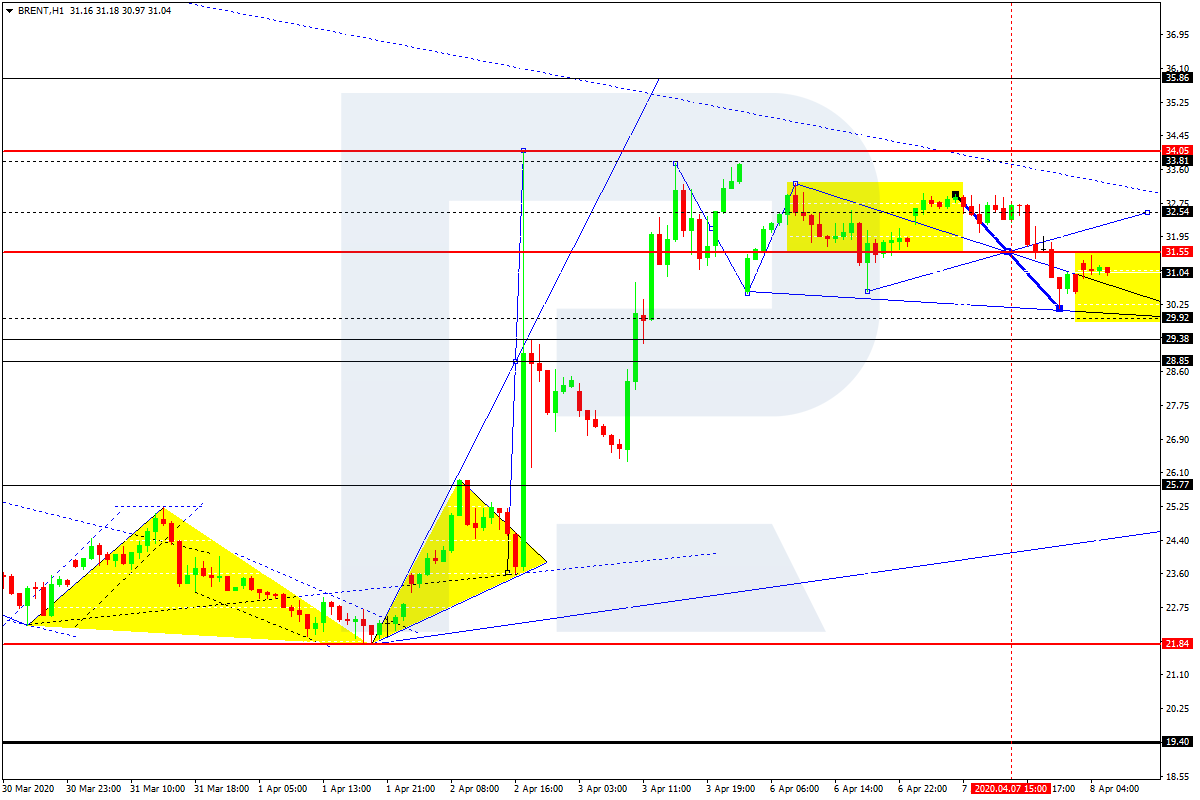
BRENT
Brent is consolidating around 31.65. Possibly, today the pair may fall towards 29.92 and then grow to return to 31.65. Later, the market may form a new descending structure to complete the correction at 29.33. After that, the instrument may resume trading upwards with the target at 35.86.
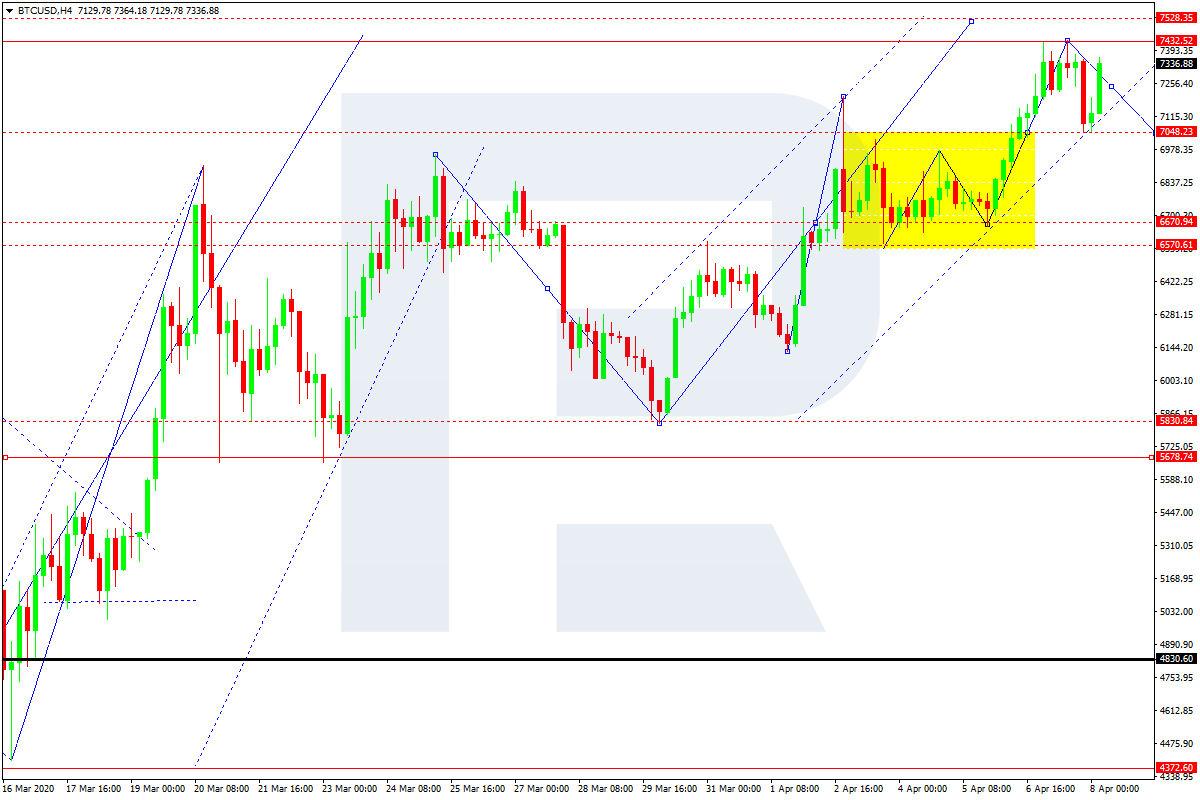
BTCUSD, “Bitcoin vs US Dollar”
BTCUSD is still forming the ascending wave with the target at 7530.00. Later, the market may form the first descending impulse towards 6600.00. After that, the instrument may start a new correction with the key target at 5600.00.
Attention! Forecasts presented in this section only reflect the author’s private opinion and should not be considered as guidance for trading. RoboForex LP bears no responsibility for trading results based on trading recommendations described in these analytical reviews.
The EUR/USD currency pair has moved away from local highs. At the moment, the technical pattern is ambiguous. EUR/USD quotes are consolidating in the range of 1.08250-1.08850. Financial market participants have taken a wait-and-see attitude before the publication of FOMC minutes. We recommend paying attention to the comments by representatives of the regulator. The COVID-19 epidemic is still in the focus of attention. The number of recorded cases of coronavirus in the world exceeded 1.45 million. Positions should be opened from key levels of support and resistance.
At 21:00 (GMT+3:00), the FOMC meeting minutes will be published.
Indicators do not give accurate signals: the price has fixed between 50 MA and 100 MA.
The MACD histogram is near the 0 mark.
Stochastic Oscillator is in the neutral zone, the %K line is above the %D line, which indicates the bullish sentiment.
Trading recommendations
Support levels: 1.08250, 1.07750
Resistance levels: 1.08850, 1.09250, 1.09700
If the price fixes above 1.08850, the EUR/USD currency pair is expected to grow. The movement is tending to 1.09250-1.09500.
An alternative could be a drop in the EUR/USD quotes to 1.07900-1.07700.
The GBP/USD currency pair
Technical indicators of the currency pair:
Prev Open: 1.22303
Open: 1.23253
% chg. over the last day: +0.89
Day’s range: 1.22880 – 1.23528
52 wk range: 1.1466 – 1.3516
The GBP/USD currency pair is still being traded in a flat. There is no defined trend. Investors expect additional drivers. Today, the FOMC meeting minutes will be the key event. The local support and resistance levels are 1.22500 and 1.23450, respectively. We also recommend following current information regarding the distribution of COVID-19. We recommend opening positions from key levels.
The news feed on the UK economy is calm.
Indicators do not give accurate signals: the price has crossed 50 MA and 100 MA.
The MACD histogram is near the 0 mark.
Stochastic Oscillator is in the neutral zone, the %K line has crossed the %D line. There are no signals at the moment.
Trading recommendations
Support levels: 1.22500, 1.21650, 1.20500
Resistance levels: 1.23450, 1.24250, 1.24800
If the price fixes below 1.22500, GBP/USD quotes are expected to fall. The movement is tending to 1.21700-1.21200.
An alternative could be the growth of the GBP/USD currency pair to 1.24250-1.24800.
The USD/CAD currency pair
Technical indicators of the currency pair:
Prev Open: 1.41104
Open: 1.39921
% chg. over the last day: -0.82
Day’s range: 1.39823 – 1.40814
52 wk range: 1.2949 – 1.4668
USD/CAD quotes have moved away from local lows. Loonie is currently consolidating. The technical pattern is ambiguous. The key support and resistance levels are 1.40100 and 1.41000, respectively. Investors expect the publication of the FOMC meeting minutes. We also recommend paying attention to the dynamics of oil quotes. Positions should be opened from key levels.
The News Feed on Canada’s Economy:
– Building permits at 15:30 (GMT+3:00).
Indicators do not give accurate signals: the price has crossed 50 MA.
The MACD histogram is near the 0 mark.
Stochastic Oscillator is in the neutral zone, the %K line has crossed the %D line. There are no signals at the moment.
Trading recommendations
Support levels: 1.40100, 1.39450
Resistance levels: 1.41000, 1.41750, 1.42600
If the price fixes below 1.40100, a further drop in the USD/CAD quotes is expected. The movement is tending to 1.39500-1.39200.
An alternative could be the growth of the USD/CAD currency pair to 1.41500-1.41800.
The USD/JPY currency pair
Technical indicators of the currency pair:
Prev Open: 109.216
Open: 108.744
% chg. over the last day: -0.47
Day’s range: 108.505 – 109.005
52 wk range: 101.19 – 112.41
At the moment, the USD/JPY currency pair is consolidating. There is no defined trend. USD/JPY quotes are testing local support and resistance levels: 108.550 and 109.000, respectively. Publication of the FOMC meeting minutes is in the spotlight. We also recommend paying attention to the dynamics of US government bonds yield. Positions should be opened from key levels.
The news feed on Japan’s economy is quite calm.
Indicators do not give accurate signals: the price has fixed between 50 MA and 100 MA.
The MACD histogram is near the 0 mark.
Stochastic Oscillator is in the neutral zone, the %K line is below the %D line, which indicates the bearish sentiment.
Trading recommendations
Support levels: 108.550, 108.150, 107.600
Resistance levels: 109.000, 109.350, 110.100
If the price fixes above 109,000, further growth of the USD/JPY quotes is expected. The movement is tending to 109.400-109.800.
An alternative could be a decrease in the USD/JPY currency pair to 108.200-107.800.
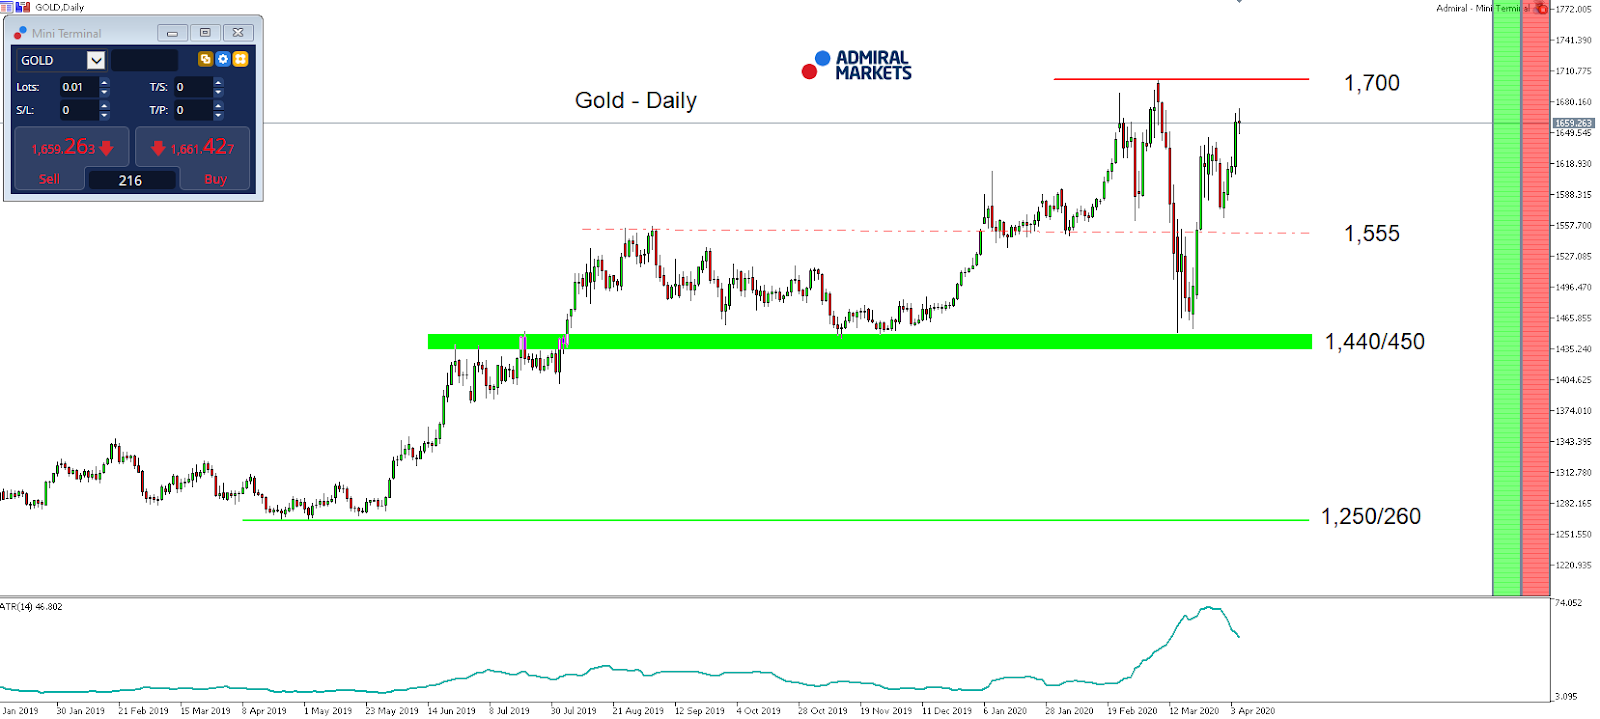
The technical picture in Gold stays tense. After finding a (short-term) bottom around 1,440/450 USD, and then pushing back above 1,600 USD in response the massive monetary stimulus from the Fed on March 23, the precious metal dropped back below 1,600 USD over the course of the last week of trading.
And even if the situation and volatility in Equities is to relax a little, despite the VIX having dropped back below 50 points since the beginning of March, we consider chances to be still high that a new wave of de-leveraging hitting global financial markets is a serious option, and will naturally not only result in high demand for the US dollar given the global USD shortage, but potentially also in a new wave of aggressive selling in Gold.
That disruption in mind, and given the massive steps from the Fed in addition to the deficit spending from the US government, to be long with Gold in the mid- to long-term is an interesting bet from a risk-reward perspective. But in the short-term, in our opinion, a sharp drop in Gold could happen at any time.
Technically, the key-support can still be found around 1,440/450, above that level another push up to 1,700 USD stays realistic.
Nevertheless, another “liquidation wave” could bring a short-term drop below 1,440/450 USD into play which would technically darken the picture, activating 1,250/260 USD as a first target:
Source: Admiral Markets MT5 with MT5-SE Add-on Gold Daily chart (between January 8, 2019, to April 7, 2020). Accessed: April 7, 2020, at 10:00pm GMT – Please note: Past performance is not a reliable indicator of future results, or future performance.
In 2015, the value of Gold fell by 10.4%, in 2016, it increased by 8.1%, in 2017, it increased by 13.1%, in 2018, it fell by 1.6%, in 2019, it increased by 18.9%, meaning that after five years, it was up by 28%.
Discover the world’s #1 multi-asset platform
Admiral Markets offers professional traders the ability to trade with a custom, upgraded version of MetaTrader 5, allowing you to experience trading at a significantly higher, more rewarding level. Experience benefits such as the addition of the Market Heat Map, so you can compare various currency pairs to see which ones might be lucrative investments, access real-time trading data, and so much more. Click the banner below to start your FREE download of MT5 Supreme Edition!
Disclaimer: The given data provides additional information regarding all analysis, estimates, prognosis, forecasts or other similar assessments or information (hereinafter “Analysis”) published on the website of Admiral Markets. Before making any investment decisions please pay close attention to the following:
This is a marketing communication. The analysis is published for informative purposes only and are in no way to be construed as investment advice or recommendation. It has not been prepared in accordance with legal requirements designed to promote the independence of investment research, and that it is not subject to any prohibition on dealing ahead of the dissemination of investment research.
Any investment decision is made by each client alone whereas Admiral Markets shall not be responsible for any loss or damage arising from any such decision, whether or not based on the Analysis.
Each of the Analysis is prepared by an independent analyst (Jens Klatt, Professional Trader and Analyst, hereinafter “Author”) based on the Author’s personal estimations.
To ensure that the interests of the clients would be protected and objectivity of the Analysis would not be damaged Admiral Markets has established relevant internal procedures for prevention and management of conflicts of interest.
Whilst every reasonable effort is taken to ensure that all sources of the Analysis are reliable and that all information is presented, as much as possible, in an understandable, timely, precise and complete manner, Admiral Markets does not guarantee the accuracy or completeness of any information contained within the Analysis. The presented figures refer that refer to any past performance is not a reliable indicator of future results.
The contents of the Analysis should not be construed as an express or implied promise, guarantee or implication by Admiral Markets that the client shall profit from the strategies therein or that losses in connection therewith may or shall be limited.
Any kind of previous or modeled performance of financial instruments indicated within the Publication should not be construed as an express or implied promise, guarantee or implication by Admiral Markets for any future performance. The value of the financial instrument may both increase and decrease and the preservation of the asset value is not guaranteed.
The projections included in the Analysis may be subject to additional fees, taxes or other charges, depending on the subject of the Publication. The price list applicable to the services provided by Admiral Markets is publicly available from the website of Admiral Markets.
Leveraged products (including contracts for difference) are speculative in nature and may result in losses or profit. Before you start trading, you should make sure that you understand all the risks.
Even a quick look at a chart’s Elliott waves “usually pays off in spades”
By Elliott Wave International
In the world of investing, “complacency” is a potentially hazardous state of mind.
Consider that every year, September and October have often been rough on investors. But, in 2019, the S&P 500 had gained approximately 2% during each of those months.
Investors were comfortable with owning shares. Too comfortable.
That’s why in November 2019, the Elliott Wave Theorist discussed the U.S. stock market and said:
Complacency is widespread now.
Yes, that complacency actually extended well beyond the borders of the U.S.
Indeed, in 2019, investors were even pouring into some of the past decades worst-performing markets. As examples: Moscow’s main stock index spiked 29% and Italy’s MIB index rose 28%.
Even Greece, a nation that brings to mind headlines of financial woes, had its equity market as Europe’s top performer in 2019.
In fact, our January Global Market Perspective zeroed in on Greece specifically and showed this chart as an example of extreme complacency:
That complacency indeed marked a top in Greece’s ASE Index. Here’s an updated chart from our March Global Market Perspective, along with the commentary:
After prices briefly rose above the diagonal lines in a pattern that R.N. Elliott referred to as a “throwover,” the Athens Composite reversed course and plummeted 21%. Investors punished all stock markets in February, but they positively brutalized the markets they still perceive to be riskiest. As we have said before, it’s never wise to blindly jump into a market no matter how beaten down it has become. Likewise, even a quick consultation with the waves usually pays off in spades.
You see, in addition to the epic complacency, Elliott waves in the ASE Index also clearly indicated to our subscribers that a change in trend was at hand.
Now that a downturn has occurred in global equity markets, this is the time to learn about the Elliott wave method and get insights into how to apply it to your market analysis.
You can do so by reading the online version of Frost & Prechter’s Wall Street classic book, Elliott Wave Principle: Key to Market Behavior. Access is 100% free when you become a member of Club EWI. Membership is also free.
This article was syndicated by Elliott Wave International and was originally published under the headline Europe’s Best-Performing 2019 Market: a Harsh Lesson in Complacency. EWI is the world’s largest market forecasting firm. Its staff of full-time analysts led by Chartered Market Technician Robert Prechter provides 24-hour-a-day market analysis to institutional and private investors around the world.
By OilPrice.com – As the global economy faces $1 trillion in damages within five years because of climate change, the explosive ride-sharing business is facing heightened scrutiny as one of the transportation sector’s biggest new polluters.
So, when a group of tech innovators with a vision of environmental and social responsibility from Ontario’s ‘Silicon Valley’ unleashed the next generation of CO2-reduced ride-sharing, Wall Street is likely to pay attention.
Ride-sharing 2.0 is being redefined by Facedrive (TSX:FD.V), which now offers riders something they can’t get from Uber or Lyft: A carbon-offset way to share a ride.
Facedrive’s business model puts the “people and planet first”, and that means planting trees and offsetting the CO2 for every ride hailed. The company’s innovative, state-of-the-art, in-app algorithm calculates estimated CO2 emissions for each car journey and allocates a monetary value to the local organizations to plant trees. Last year alone, in partnership with Forest Ontario, they planted over 3,500 trees in their soft launch phase.
For the first time in ride-sharing history, a company allows its riders to choose between EVs, hybrids and traditional cars. It’s a choice no one’s ever given to consumers–all without customers having to pay a premium.
Trees and the New Investing Mega-Trend
There are three realities that have come together to position Facedrive to change ride-sharing forever.
First, ESG (environmental, social and governance) investing isn’t just a fad anymore–it’s minting millionaires and billionaires. It’s in high demand, and it’s pressuring companies to make major changes. It’s the ethical squeeze of the century.
From Jeff Bezos’ $10-billion commitment to a Global Earth Fund to BlackRock CEO Larry Fink, we’re now seeing major ESG assets under management. BlackRock will increase its ESG assets from $90 billion to $1 trillion within a decade.
The second reality is that ride-sharing is already huge, and set for explosive growth in our “sharing” economy. The global market is already worth $235 billion, according to Canada’s commercial banking giant, Scotiabank, which has jumped on the Facedrive bandwagon as it embraces ride-sharing 2.0.
The third reality is that this same explosive growth is also having a huge negative impact on the environment.
A recent study by the Union of Concerned Scientists estimates that the average (U.S.) ride-hailing trip results in 69% more pollution than whatever transportation option it displaced.
Facedrive (TSX:FD.V) is positioned to solve this critical environmental problem by changing the footprint of ride-sharing, forever–and their goal is, without sacrificing profit.
According to researchers, it would require $300 billion to plant that many trees, working out to less than USD$1.50 per tonne of CO2 removed. In contrast, the best carbon capture technologies boast a breakeven point of ~$50/tonne of CO2 removed, or about 33x the cost of planting trees.
Each year, plants remove about 25% of the carbon emissions produced by human activities such as burning fossil fuels while a similar amount ends up in the oceans.
So, Facedrive is getting back to Mother Nature, and millennials love that.
This next-gen ride-share company also offers customers a choice for every ride; whether they want an EV, a hybrid, or a conventional car and then offsets the CO2 for ALL types of rides.
While Uber and Lyft were busy spending billions of dollars bringing ride-sharing into the mainstream, Facedrive was already getting ahead of the game, pinpointing the major problems the ride-hailing explosion was going to create for the environment at a time when investors are squeezing companies over ethics.
Facedrive doesn’t have to spend big on bringing ride-sharing into the mainstream, which is exactly why the giants in this space aren’t seeing any profit. There’s a lot of money to recoup.
What Next for Ride-Share 2.0?
It only gets greener from here–in more ways than one.
Facedrive’s ride count has gone from 200 a day just 4 months ago to 1,000+ rides per day right now–and counting.
In Ontario, Facedrive has been planting trees even before it went public in September 2019 and plans to move to over 15 cities over the next 24 months.
Its vision is to become #1 recognized eco-friendly and socially responsible TaaS (Transportation as a Service) platform and to benefit every community it enters. It’s already partnered with Canadian mobile giant to build a ride-sharing ecosystem with a unique ethos and revenue model, and even celebrities such as Will Smith and Jada Pinket Smith are on board with the first company in ride-sharing history to offset carbon in the best way possible, and for real.
Now, it’s planning to take its ride-sharing plus tree-planting global. The next stop is the United States and Europe, where the launch is already being prepared.
With ESG investing the hottest mega-trend in investing right now, and with ride-sharing going even beyond the mainstream, the company that plants trees while you ride and fixes all the mistakes that the giants of ride-sharing 1.0 made is positioned at that lucrative intersection of people, planet and profit.
Tech Giants Join the ESG Push
Google’s parent company Alphabet (GOOGL) is a shining star in the tech world. Despite being one of the largest companies on the planet, in many ways it has lived up to its original “Don’t Be Evil” slogan.
Not only is Google powering its data centers with renewable energy, it is also on the cutting edge of innovation in the industry, investing in new technology and green solutions to build a more sustainable tomorrow.
It’s bid to reduce its carbon footprint has been well received by both younger and older investors. And as the need to slow down climate change becomes increasingly dire, it’s easy to see why.
It’s no secret that Apple (AAPL) has always thought outside of the box. And when it brought back Steve Jobs in 1997, the company really took off.
Jobs also paved the way to a greener future for the company.
From the products themselves, to the packages they came in, and even the data centers powering them, Steve Jobs went above and beyond to cut the environmental impact of his company.
Transportation Mega-Companies Scramble To Stay In The Mix
General Motors (GM) has created its own brand of electric bikes, called Ariv. The bikes were just launched this year, but have already captured the attention of the European market.
While they err on the side of pricey, coming in at $3,800 per unit, they do boast a high top speed and can travel a modest distance on a single charge.
The kicker for many, however, is that they can fold into an easily carriable pack, making them the perfect choice for a lot of commuters. Especially in big cities like London or Berlin.
Ford (F) is taking a different approach. It’s swooped right into the scooter market, buying Spin for a clean $100 million.
Initially deployed in San Francisco back in 2017, Spin is widely considered to be a part of the Big Three of the scooter world, along with Lime and Bird.
While Ford’s buyout of Spin made headlines, it’s certainly not the first urban transportation alternative Ford’s sunk its teeth into.
In recent years, Ford also bought commuter shuttle service Chariot, Autonomic and TransLoc, aiming to ensure that it does not miss the boat as this new movement accelerates.
BAIDU (BIDU), for its part, is taking on the automated car market. With more miles under its belt than any of its competitors in Beijing, it’s an easy choice for a number of investors.
Likewise, it has an equally large portfolio of innovative new technology…at a lower entry point than its competitors.
As the ‘Chinese Google,’ Baidu is following a similar path to its American counterpart. It began as a search engine but is quickly expanding into almost all things tech related.
From artificial intelligence to television and finance, Baidu’s ever-expanding reach is a not to be ignored. Especially for investors looking to stay on top of the new tech trends.
Canadian Tech Companies Key to a Greener Tomorrow
Shopify Inc (TSX:SH) is a Canadian e-commerce company. More than 500,000 companies rely on Shopify’s real-time e-commerce, including Tesla, Budweiser and Red Bull, among many others. Shopify makes purchasing goods and services easy for anyone – and in a time where convenience is king, Shopify surely has staying power.
In addition to its revolutionary approach on e-commerce, Shopify is also delving into blockchain technology, making it a promising pick for investors, especially given that the sector is red hot right now.
BCE Inc. (TSX:BCE) is a Canadian giant. Founded in 1980, the company, formally The Bell Telephone Company of Canada is composed of three primary subsidiaries. Bell Wireless, Bell Wireline and Bell Media, however throughout its push into the position of one of Canada’s top telco groups, it has bought and sold a number of different firms.
BCE is also at the forefront of the Internet of Things movement in Canada. Its Machine to Machine solutions are being used by numerous businesses throughout North America and its new LTE-M network is sure to rapidly increase the adoption of these solutions.
Power Financial Corp (TSX:PWF) has been in the finance industry since 1984. The company operates in three segments: Lifeco, IGM and Pargesa Holding SA (Pargesa). And, with its holdings in a diversified portfolio spanning the United States and Europe, Power Financial is a leader in its field.
Focusing its investments in emerging industries, Power Financial stands to benefit by riding this wave into the future. The company’s forward-thinking attitude and liberal approach to technology is sure to leave investors satisfied.
Shaw Communications Inc (TSE:SJR.B): Shaw Communications, a giant in the Canadian telecoms sector, saw a drop in its share price following its disappointing forecasted earnings growth in 2017. In a sector that is set to see growth, undervalued and experienced companies such as this can make for a great hold play.
Shaw owns a ton of infrastructure throughout Canada and its cloud services and open-source projects look to address some of the biggest issues that its customers might face before the customers even face them.
With a market cap of $13.73 billion, Shaw Communications is going to be a big player in the sector for quite some time to come, and as it nears its 52-week low this could be a great time to pick up a telecoms giant.
The Descartes Systems Group Inc. (TSX:DSG) (commonly referred to as Descartes) is a Canadian multinational technology company specializing in logistics software, supply chain management software, and cloud-based services for logistics businesses. The company is making waves in the tech industry with its futuristic products and visionary leadership.
Recently, Descartes announced that it has successfully deployed its advanced capacity matching solution, Descartes MacroPoint Capacity Matching. The solution provides greater visibility and transparency within their network of carriers and brokers. This move could solidify the company as a key player in transportation logistics which is essential in the world of commerce.
By. Meredith Taylor
**IMPORTANT! BY READING OUR CONTENT YOU EXPLICITLY AGREE TO THE FOLLOWING. PLEASE READ CAREFULLY**
Forward-Looking Statements
This publication contains forward-looking information which is subject to a variety of risks and uncertainties and other factors that could cause actual events or results to differ from those projected in the forward-looking statements. Forward looking statements in this publication include that the demand for ride sharing services will grow; that the demand for environmentally conscientious ride sharing services companies in particular will grow; that Facedrive can achieve its environmental goals without sacrificing profit; that Facedrive plans to move to over 15 cities over the next 24 months; that Facedrive will be able to fund its capital requirements in the near term and long term; and that Facedrive will be able to carry out its business plan. These forward-looking statements are subject to a variety of risks and uncertainties and other factors that could cause actual events or results to differ materially from those projected in the forward-looking information. Risks that could change or prevent these statements from coming to fruition include changing governmental laws and policies; the company’s ability to obtain and retain necessary licensing in each geographical area in which it operates; the success of the company’s expansion activities; the ability of the company to attract a sufficient number of drivers to meet the demands of customer riders; the ability of the company to attract drivers who have electric vehicles and hybrid cars; the ability of the company to keep operating costs and customer charges competitive with other ride-hailing companies; and the company’s ability to continue agreements on affordable terms with existing or new tree planting enterprises in order to retain profits. The forward-looking information contained herein is given as of the date hereof and we assume no responsibility to update or revise such information to reflect new events or circumstances, except as required by law.
DISCLAIMERS
ADVERTISEMENT. This communication is not a recommendation to buy or sell securities. An affiliated company of Oilprice.com, Advanced Media Solutions Ltd, and their owners, managers, employees, and assigns (collectively “the Company”) has signed an agreement to be paid in shares to provide services to expand ridership and attract drivers in certain jurisdictions outside Canada and the United States. In addition, the owner of Oilprice.com has acquired additional shares of FaceDrive (TSX:FD.V) for personal investment. This compensation and share acquisition resulting in the beneficial owner of the Company having a major share position in FD.V is a major conflict with our ability to be unbiased, more specifically:
This communication is for entertainment purposes only. Never invest purely based on our communication. Therefore, this communication should be viewed as a commercial advertisement only. We have not investigated the background of the featured company. Frequently companies profiled in our alerts experience a large increase in volume and share price during the course of investor awareness marketing, which often end as soon as the investor awareness marketing ceases. The information in our communications and on our website has not been independently verified and is not guaranteed to be correct.
SHARE OWNERSHIP. The owner of Oilprice.com owns shares of this featured company and therefore has a substantial incentive to see the featured company’s stock perform well. The owner of Oilprice.com will not notify the market when it decides to buy more or sell shares of this issuer in the market. The owner of Oilprice.com will be buying and selling shares of this issuer for its own profit. This is why we stress that you conduct extensive due diligence as well as seek the advice of your financial advisor or a registered broker-dealer before investing in any securities.
NOT AN INVESTMENT ADVISOR. The Company is not registered or licensed by any governing body in any jurisdiction to give investing advice or provide investment recommendations. ALWAYS DO YOUR OWN RESEARCH and consult with a licensed investment professional before making an investment. This communication should not be used as a basis for making any investment.
RISK OF INVESTING. Investing is inherently risky. Don’t trade with money you can’t afford to lose. This is neither a solicitation nor an offer to Buy/Sell securities. No representation is being made that any stock acquisition will or is likely to achieve profits.