Author Archive for InvestMacro – Page 604

Forex Technical Analysis & Forecast 24.01.2017 (EUR/USD, GBP/USD, USD/CHF, USD/JPY, AUD/USD, USD/RUB, GOLD, BRENT)

Article By RoboForex.com

EUR USD, “Euro vs US Dollar”

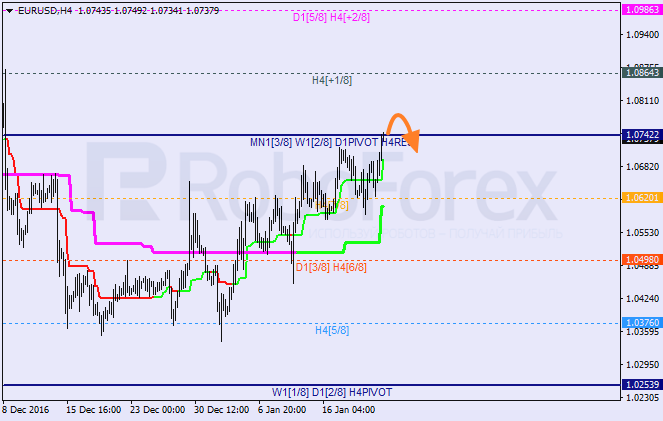
The EUR/USD pair is forming another ascending structure. Possibly, today the price may reach 1.0787 and then fall towards 1.0707. Later, in our opinion, the market may continue growing with the target at 1.0830.


GBP USD, “Great Britain Pound vs US Dollar”

The GBP/USD pair has completed another ascending structure. Possibly, today the price may fall towards 1.2398. After that, the instrument may move upwards to reach 1.2550.


USD CHF, “US Dollar vs Swiss Franc”

The USD/CHF pair is forming another descending structure with the target at 0.9945. Later, in our opinion, the market may be corrected towards 1.0020 and then fall to reach 0.9915.


USD JPY, “US Dollar vs Japanese Yen”

The USD/JPY pair is forming the descending structure with the target at 112.25. After that, the instrument may grow towards 113.82 and then continue falling to reach 112.00.


AUD USD, “Australian Dollar vs US Dollar”

The AUD/USD pair is moving upwards with the target at 0.7640. Later, in our opinion, the market may continue falling to reach 0.7400.


USD RUB, “US Dollar vs Russian Ruble”

The USD/RUB pair is still consolidating. Possibly, today the price may grow towards 60.41 and then fall to reach 58.40.


XAU USD, “Gold vs US Dollar”

Gold is consolidating at the top. Possibly, today the price may grow towards 1222. After that, the instrument may return to 1210 and then continue moving upwards with the target at 1235.


BRENT

Brent is consolidating in the center of the range. Possibly, the price may grow towards 56.00 and then move downwards to reach 53.80. Later, in our opinion, the market may return to 55.00 and then continue falling with the target at 53.00.


RoboForex Analytical Department

Article By RoboForex.com

Attention!
Forecasts presented in this section only reflect the author’s private opinion and should not be considered as guidance for trading. RoboForex LP bears no responsibility for trading results based on trading recommendations described in these analytical reviews.

EUR/USD: Tuesday’s movements could look like Monday’s

By Gabriel Ojimadu, Alpari

Previous:

On Monday, euro/dollar trading closed up. In the first half of the day the euro cheapened to 1.0707 dollars as part of a correction. After Trump spoke and the yield for US bonds fell, the price restored to 1.0772.

Trump promised to cut business rates and implement a protectionist policy. While he hasn’t given any detailed plan of how to stimulate the US economy, the USD will swing in both directions.

The US president has started to fulfil his promises. Donald Trump has signed a decree to leave the Trans-Pacific Partnership. Barak Obama’s team saw this agreement as one of the key measures to counter Chinese economic influence.

Market expectations:

In Asia the yield for American bonds is in the red zone. The euro/dollar is trading slightly down. Taking into account that the split between short and long is at 74/25, today we will probably see movements similar to that of yesterday: the pair will fall to offload the hourly indicators and then update the maximum to balance out the split between short/long. 1.0728 is the support. From here we could see a bounce to 1.0785. Sharp rebounds after a renewal of the session minimum will indicate the market’s intention to head higher.

The UK supreme court ruling on Brexit could increase volatility on the market. The court will decide whether there will need to be a vote in parliament about the conditions for the UK leaving the EU. Taking into account that Theresa May has already announced that she will put the plans to a vote in parliament, market participants could well ignore the court’s decision.

Day’s news (GMT+3):

  • 11:30, German preliminary data for business activeness in the industrial and service sectors for January;
  • 12:00, Eurozone preliminary data for business activeness in the industrial and service sectors for January;
  • 12:30, UK supreme court decision on the procedure for carrying out Brexit, net state borrowing in December;
  • 17:45, US preliminary data for January business activity in industry;
  • 18:00, US housing sales on the secondary market in December, January industrial index from the Richmond Fed;
  • 18:30, Australian index for leading indicators in November from the Conference Board.

Technical analysis:

Euro/ rate on the hourly. Source: TradingView dollar

Intraday forecast: minimum: 1.0728, maximum 1.0785, close: 1.0758.

On Monday the euro fell 45 degrees during trading in Europe. From here the price ricocheted back 45 degrees from the 1.0707 minimum. In Asia the pair is in a correctional phase. Taking into account that the hourly candle has closed below the trend line, in my forecast I’ve gone for a fall to 1.0730.

The line at 1.0730 is a copy of the line which runs across the 1.0755 and 1.0772 peaks. If the price bounces from it then it’s highly likely that there will be a test of 1.0800. If the price drops to the 45thdegree at 1.0720 then we will need to be prepared for a correction to the 67th degree on Wednesday. For my set up it would be better to have a deep correction after the forming of three peaks (1.0755-1.0772-1.0785) as forecasted.

How Bond Investors Were Fooled Twice

The Commercials and Large Speculators are routinely on the opposite sides of trades

By Elliott Wave International

[Editor’s Note: The text version of the story is below.]

*********

Most investors, including large groups of professional money managers, extrapolate financial trends into the future. So they’re often completely caught off guard when a trend changes.

The history of financial markets is full of such instances.

Right now, let’s focus on bonds. As you look at this chart from our July 11, 2016 Short Term Update, keep in mind that Large Speculators represent the trend followers who are usually caught off guard at important price junctures. Conversely, the Commercials routinely take the opposite side of the trade.

The sentiment backdrop for [30-year U.S T-bond prices] is strongly bearish for prices. We continue to point out the extremes that remain in place in the Commitment of Traders data (shown above). In overnight trading last night, prices nudged up to 177^11.0 and then reversed lower during the day session. A decline below 173^15.0 would indicate that prices have reversed their rising trend and a larger selloff is underway.

The high of 177^11.0 remained intact, and as you probably know, prices careened below 173^15.0 as a large selloff took bonds sharply lower and interest rates rose.

Fast forward five months.

Our Dec. 5, 2016 Short Term Update showed subscribers that the price and sentiment picture had changed:

Tonight’s chart shows the weekly pattern in [30-year U.S. T-bond futures], which have made a low at 148^11.0 so far (Dec. 1). … After reaching a 21-year record extreme in conjunction with the wave (5) July peak, both the Large Speculators and Commercials have completely reversed their positions. … A countertrend rally is fast approaching.

Just 10 days later, on Dec. 15, 30-year U.S. Treasury bond prices declined to 147^04.0, and since then, the expected rally has started.

This Jan. 6, 2017 Short Term Update chart tells the story:

[U.S. 30-year T-bond futures] pushed to 153^09.0 early this morning, just shy of filling the open gap at 153^25.0 from November 28.

Investors should now be keeping a close watch on the evolving market action. We suggest focusing on the Elliott wave price pattern and time-tested sentiment measures.


Markets all around the world are at a critical juncture — you must see this free report now.

This is the fifth year EWI has created our annual State of the Global Markets Report. And since many markets around the world are at a critical juncture, this may be the most-timely edition of the State of the Global Markets Report yet!

It comes right out of the pages of their paid publications. For a limited time, you can see this report at no cost.

Get your 21-page State of the Global Markets Report — 2017 Edition now.

This article was syndicated by Elliott Wave International and was originally published under the headline How Bond Investors Were Fooled Twice. EWI is the world’s largest market forecasting firm. Its staff of full-time analysts led by Chartered Market Technician Robert Prechter provides 24-hour-a-day market analysis to institutional and private investors around the world.

How to Read Trump

By Dan Steinbock

As President, Trump has pledged to reset the White House policies on “America First” basis. But will he deliver?

Around the world, there is great apprehension and much speculation about potential Trump scenarios. Nevertheless, not everything that is possible will happen, even with Trump in the White House.

For all practical purposes, the Trump administration’s ability and willingness to achieve its stated objectives can be illustrated with three probable scenarios.

‘Walking the talk’ scenario

The first scenario is that Trump will “walk the talk.” This is what his constituencies expect. Consequently, any moderation risks being seen as a betrayal.

In this scenario, Trump is more likely to walk the talk than not, as evidenced by his new trade policy appointments. He chose Peter Navarro – the author of The Coming China Wars (2005) and “Death by China” (2011) and “What China’s Militarism Means for the World (2015) – to head the new National Trade Council (NTC), which will oversee industrial policy in the White House. In turn, Navarro’s friend, former CEO of America’s largest steel company Nucor, Dan DiMicco, is now Trump’s trade advisor, while former Reagan administration official and vocal China critic Robert Lighthizer will be the new US Trade Representative.

In this view, Trump administration is set to reverse 70 years of US-led free trade regimes.

‘Sober realism’ scenario

The second scenario is that, as candidates, American presidents say one thing, but, as president, they do something else. President George W. Bush promised “passionate conservatism,” but achieved war and deficits. President Obama pledged massive changes but ended up fostering the military-industrial complex, which led to Eisenhower’s warnings already in his Farewell Address in 1961.

In this view, Trump will adjust to realities. In China, some observers expected Trump to be a pragmatic businessman who will talk tough but only to deal from a better position. Yet, Trump is not a typical conservative, cautious, bland-speaking CEO.

While Trump will have to adjust his stated objectives in an unpredictable global landscape, he will enjoy extraordinary execution power. Today, Republicans control the White House, the Senate and the House of Representatives. Consequently, whatever the administration will decide to do is likely to be bigger and bolder, move ahead faster and have greater consequences.

In this status quo, “sober realism” may not be as likely as with Obama or Bush who faced a hostile opposition in the Capitol Hill. Political power favors unrestrained governance.

‘White black swans’ scenario

The most unpredictable, yet potentially most devastating scenario is the “white black swans” scenario. In this view, Trump administration may make policy mistakes, which can result in low probability but highly consequential adverse consequences.

That’s what happened in the 1930s with the Smoot-Hawley Tariff Act, which initially seemed to work quite well but soon caused other nations to retaliate with even higher tariffs and barriers, which ultimately paved the way to a world war.

Today, the Trump administration’s protectionist initiatives may at first strengthen the US dollar and even markets. But over time, a stronger dollar will make US exports less competitive and defuse exuberance in markets. More importantly, unilateral tariffs tend to result in tit-for-tat unilateral retaliation, which will mitigate the benefits of the original tariff and compound costs over time.

In the coming months, all Trump initiatives – including the administration’s proposed tax cuts, trade policy, manufacturing plans, infrastructure investment, stricter immigration, climate change reversals, balancing power games, military spending and so on – should be seen in light of these three scenarios.

Nevertheless, the early signs suggest that the Trump administration will, at least initially, shun sober realism and walk the talk. And that, unfortunately, translates to greater potential of ‘white black swans’ over time.

About the Author:

Dr Dan Steinbock is the founder of the Difference Group and has served as the research director at the India, China, and America Institute (USA) and a visiting fellow at the Shanghai Institutes for International Studies (China) and the EU Center (Singapore). For more, see http://www.differencegroup.net/

A slightly shorter version of the commentary was released by Shanghai Daily on January 18, 2017


Fibonacci Retracements Analysis 23.01.2017 (EUR/USD, EUR/GBP)

Article By RoboForex.com

EUR USD, “Euro vs US Dollar”

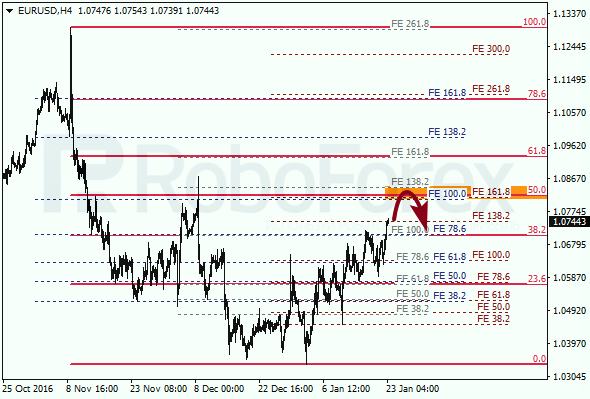
The EUR/USD pair reached a new local high, which means that it may continue growing towards the group of fibo-levels at the correctional retracement of 50%. If later the price rebounds from this area, it may start a new descending correction.

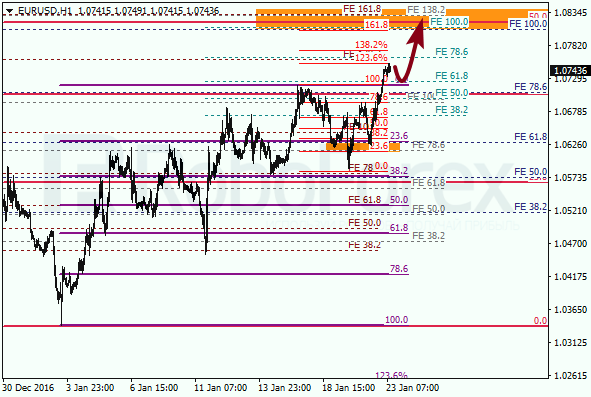
At the H1 chart, the pair may start a new local correction towards the broken high. Later, the price may resume moving upwards to reach the closest group of fibo-levels at 1.0835 – 1.0810. Possibly, the market may rebound from this area start a correction.


EUR GBP, “Euro vs Great Britain Pound”

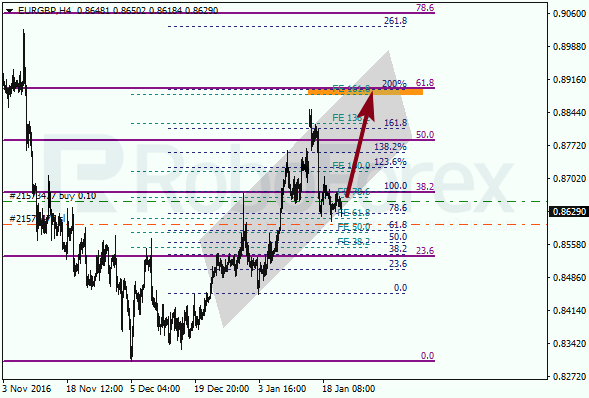
The EUR/GBP pair is still moving inside the ascending channel. If the price rebounds from the channel’s downside border, it may resume moving upwards. The closest target for bulls is the group of fibo-levels at 0.8890 – 0.8880.

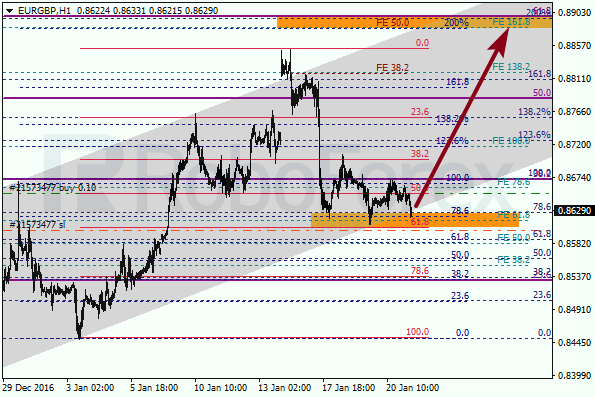
As we can see at the H1 chart, the price is trading very close to the channel’s downside border and trying to rebound from the group of local fibo-levels. If bulls rebound from this area, the market may start a new growth on Monday.


RoboForex Analytical Department

Article By RoboForex.com

Attention!
Forecasts presented in this section only reflect the author’s private opinion and should not be considered as guidance for trading. RoboForex LP bears no responsibility for trading results based on trading recommendations described in these analytical reviews.

RMB Interventions Paving Way for Reforms

By Dan Steinbock

Recently, Chinese renminbi has depreciated substantially. In the short-term, interventions will prevail; in the longer-term, the currency will stabilize.

In the past quarter, Chinese renminbi (RMB) decreased by 4%, which is significantly faster than anticipated, due to rising tensions in foreign-exchange markets over China’s rising debt and bubbling property markets. China has managed to stabilize growth, but not without capital controls, hefty lending and decisive interventions.

Recently, the RMB soared against the US dollar. By encouraging Chinese banks to withhold funds from other banks, the People’s Bank of China (PBoC) tightened liquidity in Hong Kong, which led the overnight lending market to surge from 17% to 61% in 2 days – which, in turn, caused the RMB to soar in offshore market.

Due to efforts to stabilize the currency, China’s foreign-exchange reserves fell to $3 trillion last month; the lowest since spring 2011. In the past 17 months, PBOC actions have penalized the reserves by $1 trillion.

The Trump-Fed challenge

Three years ago, the RMB was still close to 6.00 per US dollar. As Chinese growth decelerated, debt-taking continued and the Fed’s rate hikes began, RMB weakened to 6.95 in 2016. As it recently got close to 7.00 per dollar, the PBOC moved to support the currency.

As Chinese companies and investors have tried to reduce their RMB stakes and diversify risk, the exchange rate has faced further pressure, which has led authorities to ratchet up controls on Chinese companies and investors investing offshore. Thanks to these measures, China’s growth has been stabilizing, but at cost.

During the global financial crisis, China’s huge stimulus package boosted confidence, supported the infrastructure drive, and prevented global depression. But excessive liquidity led to speculation in equity and property markets. The current credit target of 13% remains twice the growth rate. China can no longer rely on credit-fueled growth.
Now Beijing must manage its rebalancing, while deleveraging huge local debt. In practice, that means balancing between RMB depreciation and actions to defend the currency. After January 20, Beijing must also respond to a dual challenge of escalating trade friction with the Trump administration and rate increases by the Fed.

Pro-market economists have urged PBoC to permit the RMB to weaken to an “equilibrium level” before Trump’s inauguration. Otherwise, they argue, PBOC will exhaust reserves to boost the RMB, which will only contribute to destabilization and capital outflows.

Timing of reforms

However, the proposed reforms will contest the tacit guarantees on state-owned enterprises (SOEs) and state-owned banks, which will cause a fair amount of unease and distress in the short- to medium-term.

Nevertheless, the reforms are necessary to achieve China’s rebalancing, which is central government’s explicit long-term economic objective, and to double GDP per capita by 2020, which is vital for long-term social stability. The real question is the timing of the reform implementation.

Currently, analysts expect the RMB to trade at close to 7.10 by the end of this quarter and closer to 7.35 at the year-end. By the same logic, RMB per dollar could exceed 7.50 by 2018 and 8.00 by 2019. These projections are predicated on economic trends, which downplay the impact of government interventions, however.

While the impending economic reforms have been designed by the 18th Central Committee in the past five years, they will be implemented by the new Committee, which will be elected in the fall and which will govern until the early 2020s. Since economic change will not be sustained without political consolidation, leadership transition is likely to precede reform implementation.

In a benign scenario, within 2-3 years, the property markets will be on a more solid footing, credit target is expected to be significantly lower and quality of growth substantially higher. That’s when the landscape will be more favorable for reform implementation. Meanwhile, the authorities are likely to continue the balancing act between short-term interventions and long-term objectives.

Ironically, RMB interventions are paving way for reforms.

Strong dollar – or elevated volatility

At the same time, the relationship between Chinese renminbi and US dollar is shifting. In the past, the markets used the volatility index (VIX) as the barometer for risk appetite and leverage. After the Great Recession, US dollar has replaced the VIX as the “new fear index.”

Indeed, the RMB is not just coping with a strong dollar but with elevated volatility induced by the US dollar.
Consequently, the RMB challenges will intensify in the short-term but stabilize in the medium-term. With the US dollar, the trends may be precisely the reverse.

About the Author:

The author is the founder of Difference Group and has served as research director at the India, China and America Institute (USA) and visiting fellow at the Shanghai Institutes for International Studies (China) and the EU Center (Singapore). For more, see http://www.differencegroup.net/

This is the longer version of a commentary that was originally published by China Daily, January 16, 2017


EUR/USD long target raised to 1.0810

By GrowthAces.com

Macroeconomic overview

Donald Trump is now the 45th President of the United States. Investors had been looking to Trump’s first address as president to highlight his plans for fiscal spending, tax cuts and regulatory reforms. Instead, Trump focused his remarks on his “America first” policies that were short on specific proposals.

The ultimate target of hic policy is “to create 25 million new American jobs in the next decade and return to 4% annual growth.” To get there, the president proposes: 1. a tax reform, which simplifies the tax code, and lowers rates for corporates and individuals in every tax bracket. 2. A moratorium on new federal regulations, as well as the identification (and ultimately the repeal) of job-killing regulations. 3. The withdrawal from or renegotiation of trade deals.

The dollar edged down on Friday, pretty in line with our expectations, as investors were underwhelmed by the limited scope of executive actions and the lack of concrete policy reforms in the inauguration speech of newly sworn-in U.S. President Donald Trump.

Technical analysis

The EUR/USD rises today and is still above 7-day exponential moving average, which strengthens our bullish view in the short term. An important resistance level is at 1.0817 (50% fibo of November-January fall).

EURUSD Daily Forex Signals Chart

Yield spread between German and U.S. 10-year bonds

Yield spread between German and U.S. 10-year bonds

Trading strategy

We have raised the target of our long position to 1.0810.


USD/CAD: Doji candlestick on Friday suggests return to downward move

Macroeconomic overview

Canadian inflation rate rose to 1.5% from November’s 1.2%, below market forecasts for an increase to 1.7%. Gasoline prices jumped 5.5% compared to the year before. But annual food prices fell for the third month in a row and were down 1.3% in December as Canadians paid less for fresh fruit and vegetables.

Two of the three new measures of core inflation the Bank of Canada established late last year showed underlying inflation was closer to the central bank’s 2% target.

CPI median, which shows the median inflation rate across CPI components, held at 2.0% after the previous month was revised up, while CPI trim, which excludes upside and downside outliers, was also steady at 1.6%.

But CPI common, which the central bank has said has the best correlation to the output gap, was furthest away from target, edging up to 1.4% from 1.3%. Common measures price changes across categories in the CPI basket.

Canadian retail sales rose 0.2% in November vs. market expectations for an increase of 0.5%. Excluding vehicles, retail sales were up just 0.1%. Stores normally associated with Black Friday sales saw mixed results. Purchases at electronics and appliance stores were up 1.0%, but sales at sporting goods and hobby stores declined 0.3% and clothing stores were up just 0.1%.

The CAD pared earlier losses following weaker-than-expected inflation and retail sales data, to finish little changed against its U.S. counterpart on Friday. On Monday the USD/CAD falls on broad USD weakness.

Technical analysis

A doji candlestick on Friday suggests the end of USD/CAD recovery and a return to downward trend.  In our opinion a fall to 1.3030 is the most likely scenario for the coming days.

USDCAD Daily Forex Signals Chart

Yield spread between U.S. and Canadian 10-year bonds

Yield spread between U.S. and Canadian 10-year bonds

Trading strategy

We keep our short USD/CAD positions unchanged.


TRADING STRATEGIES SUMMARY:

FOREX – MAJOR PAIRS:

Daily Forex Trading Strategies - Major Pairs

FOREX – MAJOR CROSSES:

Daily Forex Trading Strategies - Major Crosses

PRECIOUS METALS:

Daily Trading Strategies - Precious Metals

It is usually reasonable to divide your portfolio into two parts: the core investment part and the satellite speculative part. The core part is the one you would want to make profit with in the long term thanks to the long-term trend in price changes. Such an approach is a clear investment as you are bound to keep your position opened for a considerable amount of time in order to realize the profit. The speculative part is quite the contrary. You would open a speculative position with short-term gains in your mind and with the awareness that even though potentially more profitable than investments, speculation is also way more risky. In typical circumstances investments should account for 60-90% of your portfolio, the rest being speculative positions. This way, you may enjoy a possibly higher rate of return than in the case of putting all of your money into investment positions and at the same time you may not have to be afraid of severe losses in the short-term.

How to read these tables?

1. Support/Resistance – three closest important support/resistance levels
2. Position/Trading Idea:
BUY/SELL – It means we are looking to open LONG/SHORT position at the Entry Price. If the order is filled we will set the suggested Target and Stop-loss level.
LONG/SHORT – It means we have already taken this position at the Entry Price and expect the rate to go up/down to the Target level.
3. Stop-Loss/Profit Locked In – Sometimes we move the stop-loss level above (in case of LONG) or below (in case of SHORT) the Entry price. This means that we have locked in profit on this position.
4. Risk Factor – green “*” means high level of confidence (low level of uncertainty), grey “**” means medium level of confidence, red “***” means low level of confidence (high level of uncertainty)
5. Position Size (forex)– position size suggested for a USD 10,000 trading account in mini lots. You can calculate your position size as follows: (your account size in USD / USD 10,000) * (our position size). You should always round the result down. For example, if the result was 2.671, your position size should be 2 mini lots. This would be a great tool for your risk management!
Position size (precious metals) – position size suggested for a USD 10,000 trading account in units. You can calculate your position size as follows: (your account size in USD / USD 10,000) * (our position size).
6. Profit/Loss on recently closed position (forex) – is the amount of pips we have earned/lost on recently closed position. The amount in USD is calculated on the assumption of suggested position size for USD 10,000 trading account.
Profit/Loss on recently closed position (precious metals) – is profit/loss we have earned/lost per unit on recently closed position. The amount in USD is calculated on the assumption of suggested position size for USD 10,000 trading account.

About the Author:

By GrowthAces.com – Daily Forex Trading Strategies


Murrey Math Lines 23.01.2017 (EUR/USD, USD/CAD)

Article By RoboForex.com

EUR USD, “Euro vs US Dollar”

After rebounding from 7/8 level last Friday, the EUR/USD pair is testing the 8/8 one. Possibly, in the nearest future the price may continue growing. If later the market breaks the 8/8 level downwards, bears may start a new descending correction.

At the H1 chart, the closest target for bulls is at the +1/8 level. In case the price rebounds from this level, bears may start a new local correction, at least. If later the market fixes below the 7/8 level, it may continue falling towards the 4/8 one.


USD CAD, “US Dollar vs Canadian Dollar”

The USD/CAD pair rebounded twice form the 3/8 level, and, as a result, the price started a short-term growth and Super Trends formed “bullish cross”. Considering that the pair failed to fix above the 5/8 level, it may be corrected towards the 4/8 one and the daily Super Trend. If later the price rebounds from these levels, the market will resume moving upwards to reach the 6/8 one.

As we can see at the H1 chart, the 7/8 level provide resistance and, as a result, the pair broke the H1 Super Trend. On Monday, the price may fall towards the 4/8 level. After reaching this level, the market may reverse and resume growing to reach the target at the 8/8 one.


RoboForex Analytical Department
Article By RoboForex.com

Attention!
Forecasts presented in this section only reflect the author’s private opinion and should not be considered as guidance for trading. RoboForex LP bears no responsibility for trading results based on trading recommendations described in these analytical reviews.

EUR/USD: Europe against Asia

By Gabriel Ojimadu, Alpari

Previous:

On Friday, 20th January in Washington, Donald Trump was inaugurated as the 45th president of the USA. The euro restored from a minimum of 1.0625 to 1.0709. In his speech Trump promised to make changes to economic and national security. The euro rose with the growth in American bonds, although the currency should have fallen.

Market expectations:

On Monday in Asia the euro rose to 1.0750 due to a fall in American bond yields. According to the latest data from myfxbooks, the split between long/short is 72%/27% or 10883/4113 lots. If we take into account that the stops for intraday trades are around 30-60 points on average, then we may well see a bounce at around 1.0760/70.

Since today is Monday, trading in New York closed up for the euro and in Asia the growth continued, so I expect to see a downward correction to around 1.0702.

Day’s news (GMT+3):

  • 14:00, German Bundesbank monthly report;
  • 14:30, ECB’s Draghi to speak;
  • 16:15, ECB’s Pratt to speak;
  • 16:30, Canadian wholesale sales in November;
  • 18:00, Eurozone January consumer confidence index.

Technical analysis:

Euro/ rate on the hourly. Source: TradingView dollar

Intraday forecast: minimum: 1.0649, maximum 1.0758 (current Asian at opening), close: 1.0714.

My Friday’s expectations came off in full. The euro fell in the first half of the day and rose in the second. As I wrote above, the euro has been rising in Asia against the dollar due to a fall in American bond yields.

From a minimum of 1.0625, the price has restored by around 112 degrees. Since the buyers’ share of the market is 72%, I think the market will drag the rate to around 1.0755/60.

Today is Monday. In my forecast I’ve gone for a reverse movement against the last two sessions (US and Asia). As I see it: the euro will fall until the middle of Tuesday. For today the price level is at around the 45th degree. On Tuesday we could see a test of the 67th degree. Later we’ll need to take a look at the situation. We also need to keep an eye on the euro/pound cross which could hold the euro from falling against the dollar if it rises. If this happens then the pound will cheapen against the dollar faster than the euro.

COT – USD specs trim for 2nd week, WTI Crude bets jump. SP500,Gold bets down

By CountingPips.com

Here are this week’s links to the latest Commitment of Traders changes.

This week’s results saw speculator positions slightly lower for the US dollar for a 2nd week. The USD remains in a relatively strong bullish position (over +$20 billion for 12 weeks). 10 Year Note speculators pulled back from their record high short position while WTI crude oil futures surged to a new multiyear high in speculative positions. Bets for gold continued to fall for a 9th out of last 10 weeks although silver and copper had increased speculative bullish positions for the week.


Currency Speculators slightly reduced US Dollar bullish positions for 2nd week

US Dollar net speculator positions leveled at $24.44 billion last week

The latest data for the weekly Commitment of Traders (COT) report, released by the Commodity Futures Trading Commission (CFTC) on Friday, showed that large traders and currency speculators slightly decreased their bullish bets for the US dollar last week for a second consecutive week.

  • The individual major currencies that improved versus the US dollar last week were the Japanese yen (2,009 weekly change in contracts), Swiss franc (563 contracts), Canadian dollar (2,479 contracts), Australian dollar (8,693 contracts) and the New Zealand dollar (1,672 contracts).

See full article


WTI Crude Oil Speculators sharply added to bullish net positions last week

The non-commercial contracts of WTI crude futures rose to a net position of 464,678 contracts, according to data from last week. This was a gain of 31,116 contracts from the previous weekly total.

See full article


Gold Speculators decreased bullish net positions, down 9 out of last 10 weeks

The large speculator contracts of gold futures declined to a total net position of 107,041 contracts. This was a weekly slide of -2441 contracts from the previous week.

See full article


10 Year Treasury Note Speculators reduced bearish net positions last week

The large speculator contracts of 10-year treasury note futures totaled a net position of -375,736 contracts. This was a weekly change of 18,953 contracts from the previous week.

See full article


S&P500 Speculators trimmed bullish net positions for 5th week

The large speculator contracts of S&P 500 futures fell to a net position of 1,842 contracts. This was a decrease of -298 contracts from the reported data of the previous week.

See full article


Silver Speculators boosted bullish net positions for 3rd week

The non-commercial contracts of silver futures advanced to a net position of 69,482 contracts, according to data from last week. This was a weekly rise of 4,881 contracts from the previous totals.

See full article


Copper Speculators edged bullish net positions lower last week

The large speculator contracts of copper futures declined to a net position of 46,499 contracts. This was a weekly change of -1,204 contracts from the data of the previous week.

See full article


Article by CountingPips.com

The Commitment of Traders report data is published in raw form every Friday by the Commodity Futures Trading Commission (CFTC) and shows the futures positions of market participants as of the previous Tuesday (data is reported 3 days behind).

To learn more about this data please visit the CFTC website at http://www.cftc.gov/MarketReports/CommitmentsofTraders/index.htm